Download presentation
Presentation is loading. Please wait.

1
Workshop: Emissies schatten vanuit de ruimte
Bas Mijling, Ronald van der A Emissiesymposium Lucht ● 17 juni ● Utrecht

2
Overzicht Meten van luchtvervuling uit de ruimte
Van concentraties naar emissies NOx emissies in China en Zuid Afrika Andere emissies Conclusies en vooruitblik

3
Measuring air pollution from space

4
Atmospheric Composition
(Ar) - Carbon dioxide (CO2) - Ozone (O3) - Nitrogen dioxide (NO2) - ... Samenstelling van droge lucht. N2: 78%, O2: 20.9%, Ar: 0.9%. De overige 0.1% bestaat uit sporegassen zoals CO2 (383 ppm), ozon ( ppm), NO2 (0.02 ppm) CO2 is bekend van het broeikas-effect
 - Carbon dioxide (CO2) - Ozone (O3) - Nitrogen dioxide (NO2) Samenstelling van droge lucht. N2: 78%, O2: 20.9%, Ar: 0.9%. De overige 0.1% bestaat uit sporegassen zoals CO2 (383 ppm), ozon ( ppm), NO2 (0.02 ppm) CO2 is bekend van het broeikas-effect.")
5
The Ozone Monitoring Instrument (OMI)
EOS Aura satellite

6
Sun-synchronous Orbit
km altitude Always same orientations towards sun:rotates eastward about 1 degree each day. Each orbit experiences about 30 minutes darkness and 72 minutes sunlight OMI local overpass time: 13:00 Daily global coverage

7
Measuring trace gases from space

8
spectral irradiance [W/m2/nm]
2.5 2.0 1.5 1.0 0.5 wavelength [nm] spectral irradiance [W/m2/nm]
![spectral irradiance [W/m2/nm]](http://slideplayer.com/slide/2900307/10/images/8/spectral+irradiance+%5BW%2Fm2%2Fnm%5D.jpg "wavelength [nm] spectral irradiance [W/m2/nm]")
9
spectral irradiance [W/m2/nm]
2.5 2.0 1.5 1.0 0.5 wavelength [nm] spectral irradiance [W/m2/nm]
![spectral irradiance [W/m2/nm]](http://slideplayer.com/slide/2900307/10/images/9/spectral+irradiance+%5BW%2Fm2%2Fnm%5D.jpg "wavelength [nm] spectral irradiance [W/m2/nm]")
10
ozone (O3) nitrogen dioxide (NO2) spectral irradiance [W/m2/nm]
2.5 2.0 1.5 1.0 0.5 wavelength [nm] spectral irradiance [W/m2/nm] nitrogen dioxide (NO2)
![ozone (O3) nitrogen dioxide (NO2) spectral irradiance [W/m2/nm]](http://slideplayer.com/slide/2900307/10/images/10/ozone+%28O3%29+nitrogen+dioxide+%28NO2%29+spectral+irradiance+%5BW%2Fm2%2Fnm%5D.jpg "wavelength [nm] spectral irradiance [W/m2/nm] nitrogen dioxide (NO2)")
13
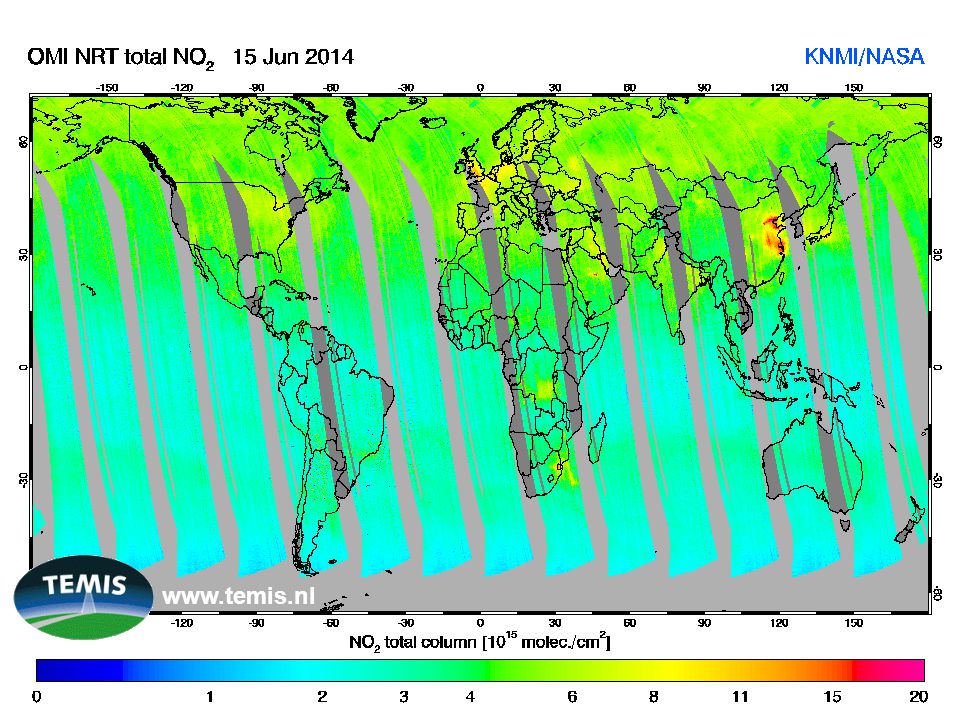
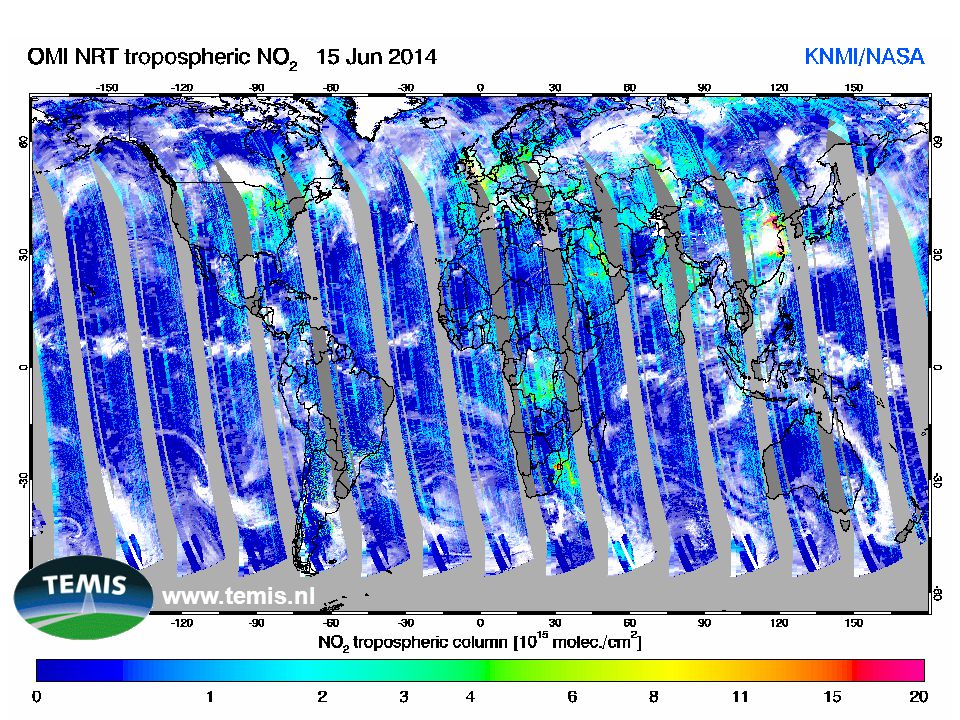
Air pollution from space

14
Air pollution from space

15
Air pollution from space
Shanghai Beijing Hong Kong

16
From concentrations to emissions

17
Basic tools NO2 retrievals from OMI and GOME2 CHIMERE 0.25 °×0.25°

18
Chemical transport model
Meteorology Emission inventory Air pollution concentrations Chemical transport model

19
Difference between simulation and observation...
simulated by model (2008) observed from space (2008) Als je satellietobservaties kunt gebruiken voor emissiebepalingen, dan sla je twee vliegen in een klap: Je kunt nauwkeuriger de luchtvervuiling simuleren (betere luchtkwaliteitsverwachtingen) Je kunt emissiebronnen controleren (houden fabrieken zich wel aan de regels) ...mainly caused by wrong emissions
 observed from space (2008) Als je satellietobservaties kunt gebruiken voor emissiebepalingen, dan sla je twee vliegen in een klap: Je kunt nauwkeuriger de luchtvervuiling simuleren (betere luchtkwaliteitsverwachtingen) Je kunt emissiebronnen controleren (houden fabrieken zich wel aan de regels) ...mainly caused by wrong emissions.")
20
How to find emissions from concentrations?
( wind

21
Properties of DECSO* From concentrations to emissions
Takes transport into account enables high resolution (~2525 km2) Relatively fast enables operational emission estimation Emission updates by addition enables detection new hotspots enables relocation existing hotspots NO2 retrievals from OMI or GOME-2 CHIMERE 0.25° x 0.25° (A) DECSO is relatively fast: (1) Forward model run (2) Sensitivity calculation (3) Inverse with Kalman Filter (4) Emission update (B) DECSO takes transport into account, enabling a high resolution (typically in order of satellite footprint) (A) + (B): DECSO can be implemented operationally Emission results downloadable at GlobEmission website * Daily Emission estimates Constrained by Satellite Observations
 Relatively fast enables operational emission estimation. Emission updates by addition enables detection new hotspots enables relocation existing hotspots. NO2 retrievals from OMI or GOME-2. CHIMERE 0.25° x 0.25° (A) DECSO is relatively fast: (1) Forward model run (2) Sensitivity calculation (3) Inverse with Kalman Filter (4) Emission update. (B) DECSO takes transport into account, enabling a high resolution (typically in order of satellite footprint) (A) + (B): DECSO can be implemented operationally. Emission results downloadable at GlobEmission website. * Daily Emission estimates Constrained by Satellite Observations.")
22
NOx in China

23
Air pollution from space
Shanghai Beijing Hong Kong

24
Bevolkingsdichtheid China

25
Change in NO2 column densities over China
SCIAMACHY mean tropospheric NO2 2003 2006

26
China: Economic indicators
Average annual income per capita, China’s electricity production, GDP per capita in the Netherlands: € (2006) China’s urbanization, Number of vehicles in Beijing, GDP in China still factor of 10 lower than in Europe. Source: China Statistical Yearbook, China Daily (17/2/09)
 China’s urbanization, Number of vehicles in Beijing, GDP in China still factor of 10 lower than in Europe. Source: China Statistical Yearbook, China Daily (17/2/09)")
27
Shanghai 1995 Shanghai 2010

28
Luchtvervuiling Beijing
17 miljoen inwoners; elk jaar nieuwe inwoners erbij 3.3 miljoen auto’s; elke dag 1000 nieuwe auto’s erbij Zware industrie dicht bij de stad Kolengestookte kachels en fornuizen

29
Beijing smog, januari 2013

30
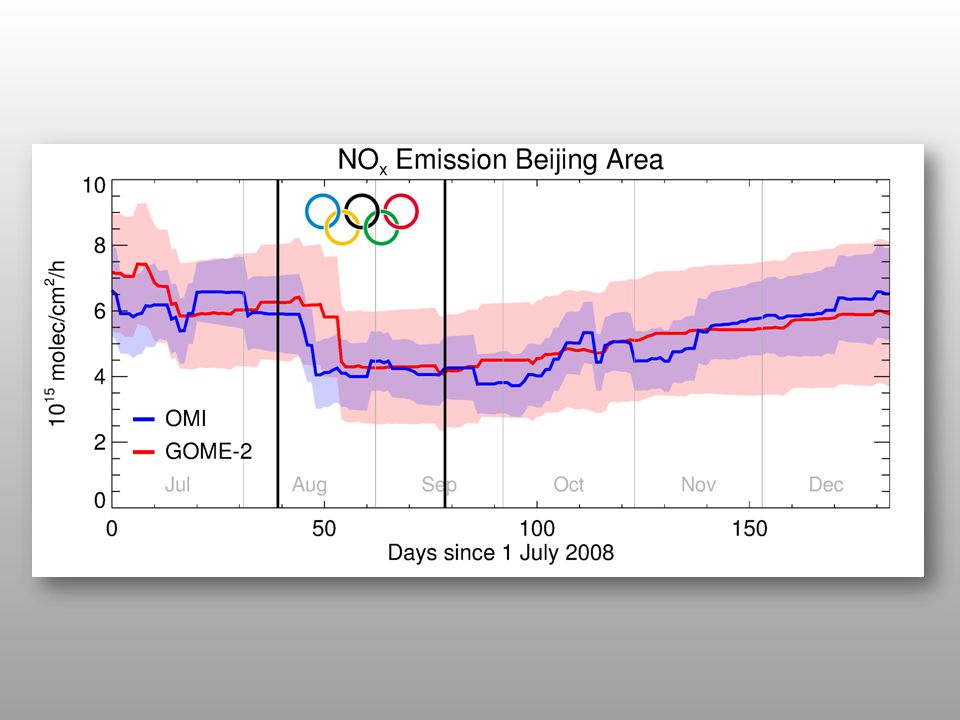
Air quality measures No construction activities
Closure or translation of polluting industry 30% reduction coal-fired power plants Ban high emission vehicles Traffic system with odd/even number plate

32
Emission results China
original emissions new emissions New power plants in Inner Mongolia Distinct emissions along great rivers No emissions in North Korea Ship tracks

33
NOx emission trends Based on GOME-2 observations from 2007-2010
The results in this and following slides are based on 4 years of GOME-2 data ( ). Almost all Chinese provinces show positive emission trends. Economic crisis and air quality measures cause an negative trend for Japan and South Korea. The relative emission trends in (d) show that the fasted growing provinces are also in the interior. Is the economy of the interior catching up with the richer coastal provinces? Based on GOME-2 observations from
. Almost all Chinese provinces show positive emission trends. Economic crisis and air quality measures cause an negative trend for Japan and South Korea. The relative emission trends in (d) show that the fasted growing provinces are also in the interior. Is the economy of the interior catching up with the richer coastal provinces Based on GOME-2 observations from")
34
The DECSO algorithm also provides information on source-receptor relations.
The colored areas show the NO2 column over North and South Korea, separated by its origin. Red shows the monthly emissions (see right vertical axis) Grey shows the part of the NO2 column with an age older than 24h (which is not tracked by the DECSO algorithm). North Korea: Only a small part of NO2 is emitted locally. Most is imported from South Korea (Seoul) and China (Shenyang) South Korea: Emission and concentration factor 10 larger. NO2 concentrations mostly by local emission However: substantial part comes from sea (light blue). Intensive shipping around the peninsula!
 Grey shows the part of the NO2 column with an age older than 24h (which is not tracked by the DECSO algorithm). North Korea: Only a small part of NO2 is emitted locally. Most is imported from South Korea (Seoul) and China (Shenyang) South Korea: Emission and concentration factor 10 larger. NO2 concentrations mostly by local emission. However: substantial part comes from sea (light blue). Intensive shipping around the peninsula!")
35
NOx in South Africa

36
South Africa: Emissions characterized by few hot spots (power plants, heavy industry)
Apriori emissions taken from EDGAR v4.2 Total emissions too low Location and strength of hot spots generally wrong

37
EDGAR v4.2 low high EDGAR v4.2 200 km

38
DECSO low high DECSO exp09_omi/crab2 200 km

40
Majuba power plant

41
Matimba power plant

42
vanadium mine

43
Sasol company oil from coal

44
Biomass burning in Mozambique

45
Other species

47
CH2O (formaldehyde) by GOME-2
 by GOME-2")
48
NMVOC from fire emissions

49
C5H8 (isoprene) emissions
 emissions")
50
PM2.5 / PM10 emissions by MODIS

51
NH3 by IASI NH3 total column distribution above Europe (5-yr weighted mean from morning overpass)
")
52
Conclusions & Outlook

53
Emission estimation from space: Standing on the shoulders of giants
Inversion algorithm Chemical transport modeling Satellite retrievals

54
Current state Relative new technology: quality improving rapidly
Already giving useful complementary information for regions with unknown or outdated emissions Urban scale Monthly emission inventories

55
Shortcomings Not all species can be detected from space
Total emissions: difficult to infer sectorial contributions …

56
(Near) Future Better satellite observations
Switch from scientific to operational missions TROPOMI (spatial resolution) Geostationairy (temporal resolution) Better chemical transport models Better inversion algorithms
 Geostationairy (temporal resolution) Better chemical transport models. Better inversion algorithms.")
57
More information www.globemission.eu www.temis.nl www.tropomi.eu

58
Vragen?

Similar presentations