Download presentation
Presentation is loading. Please wait.

1
Cindy DeBlauw RD University of Missouri Extension-MOCAN Healthy Concessions Eat Smart in Parks Sponsored by: Missouri Park and Recreation Association

2
Funded by Missouri Foundation for Health Purpose: Assist parks with offering healthy choices Steps: – Surveys – Develop Nutrition Guidelines – Train – Marketing

3
MPRA Survey

4
2012 MPRA Member Survey Results

7
Missouri Park Visitor Interviews Don’t believe healthy food is available in park Bring own food to eat healthy Wished fruit was available for sale Would pay more for healthy food

8
How to: Healthy Concessions

9
1. Get Approval/Support Why Healthy Concessions?

10
Obesity Trends* Among U.S. Adults BRFSS, 1985 (*BMI ≥30, or ~ 30 lbs. overweight for 5’ 4” person) No Data <10% 10%–14%
 No Data <10% 10%–14%.")
11
Obesity Trends* Among U.S. Adults BRFSS, 1986 (*BMI ≥30, or ~ 30 lbs. overweight for 5’ 4” person) No Data <10% 10%–14%
 No Data <10% 10%–14%.")
12
Obesity Trends* Among U.S. Adults BRFSS, 1987 (*BMI ≥30, or ~ 30 lbs. overweight for 5’ 4” person) No Data <10% 10%–14%
 No Data <10% 10%–14%.")
13
Obesity Trends* Among U.S. Adults BRFSS, 1988 (*BMI ≥30, or ~ 30 lbs. overweight for 5’ 4” person) No Data <10% 10%–14%
 No Data <10% 10%–14%.")
14
Obesity Trends* Among U.S. Adults BRFSS, 1989 (*BMI ≥30, or ~ 30 lbs. overweight for 5’ 4” person) No Data <10% 10%–14%
 No Data <10% 10%–14%.")
15
Obesity Trends* Among U.S. Adults BRFSS, 1990 (*BMI ≥30, or ~ 30 lbs. overweight for 5’ 4” person) No Data <10% 10%–14%
 No Data <10% 10%–14%.")
16
Obesity Trends* Among U.S. Adults BRFSS, 1991 (*BMI ≥30, or ~ 30 lbs. overweight for 5’ 4” person) No Data <10% 10%–14 15%–19%
 No Data <10% 10%–14 15%–19%.")
17
Obesity Trends* Among U.S. Adults BRFSS, 1992 (*BMI ≥30, or ~ 30 lbs. overweight for 5’ 4” person) No Data <10% 10%–14 15%–19%
 No Data <10% 10%–14 15%–19%.")
18
Obesity Trends* Among U.S. Adults BRFSS, 1993 (*BMI ≥30, or ~ 30 lbs. overweight for 5’ 4” person) No Data <10% 10%–14% 15%–19%
 No Data <10% 10%–14% 15%–19%.")
19
Obesity Trends* Among U.S. Adults BRFSS, 1994 (*BMI ≥30, or ~ 30 lbs. overweight for 5’ 4” person) No Data <10% 10%–14% 15%–19%
 No Data <10% 10%–14% 15%–19%.")
20
Obesity Trends* Among U.S. Adults BRFSS, 1995 (*BMI ≥30, or ~ 30 lbs. overweight for 5’ 4” person) No Data <10% 10%–14% 15%–19%
 No Data <10% 10%–14% 15%–19%.")
21
Obesity Trends* Among U.S. Adults BRFSS, 1996 (*BMI ≥30, or ~ 30 lbs. overweight for 5’ 4” person) No Data <10% 10%–14% 15%–19%
 No Data <10% 10%–14% 15%–19%.")
22
Obesity Trends* Among U.S. Adults BRFSS, 1997 (*BMI ≥30, or ~ 30 lbs. overweight for 5’ 4” person) No Data <10% 10%–14% 15%–19% ≥20%
 No Data <10% 10%–14% 15%–19% ≥20%.")
23
Obesity Trends* Among U.S. Adults BRFSS, 1998 (*BMI ≥30, or ~ 30 lbs. overweight for 5’ 4” person) No Data <10% 10%–14% 15%–19% ≥20%
 No Data <10% 10%–14% 15%–19% ≥20%.")
24
Obesity Trends* Among U.S. Adults BRFSS, 1999 (*BMI ≥30, or ~ 30 lbs. overweight for 5’ 4” person) No Data <10% 10%–14% 15%–19% ≥20%
 No Data <10% 10%–14% 15%–19% ≥20%.")
25
Obesity Trends* Among U.S. Adults BRFSS, 2000 (*BMI ≥30, or ~ 30 lbs. overweight for 5’ 4” person) No Data <10% 10%–14% 15%–19% ≥20%
 No Data <10% 10%–14% 15%–19% ≥20%.")
26
Obesity Trends* Among U.S. Adults BRFSS, 2001 (*BMI ≥30, or ~ 30 lbs. overweight for 5’ 4” person) No Data <10% 10%–14% 15%–19% 20%–24% ≥25%
 No Data <10% 10%–14% 15%–19% 20%–24% ≥25%.")
27
(*BMI ≥30, or ~ 30 lbs. overweight for 5’ 4” person) Obesity Trends* Among U.S. Adults BRFSS, 2002 No Data <10% 10%–14% 15%–19% 20%–24% ≥25%

28
Obesity Trends* Among U.S. Adults BRFSS, 2003 (*BMI ≥30, or ~ 30 lbs. overweight for 5’ 4” person) No Data <10% 10%–14% 15%–19% 20%–24% ≥25%
 No Data <10% 10%–14% 15%–19% 20%–24% ≥25%.")
29
Obesity Trends* Among U.S. Adults BRFSS, 2004 (*BMI ≥30, or ~ 30 lbs. overweight for 5’ 4” person) No Data <10% 10%–14% 15%–19% 20%–24% ≥25%
 No Data <10% 10%–14% 15%–19% 20%–24% ≥25%.")
30
Obesity Trends* Among U.S. Adults BRFSS, 2005 (*BMI ≥30, or ~ 30 lbs. overweight for 5’ 4” person) No Data <10% 10%–14% 15%–19% 20%–24% 25%–29% ≥30%
 No Data <10% 10%–14% 15%–19% 20%–24% 25%–29% ≥30%.")
31
Obesity Trends* Among U.S. Adults BRFSS, 2006 (*BMI ≥30, or ~ 30 lbs. overweight for 5’ 4” person) No Data <10% 10%–14% 15%–19% 20%–24% 25%–29% ≥30%
 No Data <10% 10%–14% 15%–19% 20%–24% 25%–29% ≥30%.")
32
Obesity Trends* Among U.S. Adults BRFSS, 2007 (*BMI ≥30, or ~ 30 lbs. overweight for 5’ 4” person) No Data <10% 10%–14% 15%–19% 20%–24% 25%–29% ≥30%
 No Data <10% 10%–14% 15%–19% 20%–24% 25%–29% ≥30%.")
33
Obesity Trends* Among U.S. Adults BRFSS, 2008 (*BMI ≥30, or ~ 30 lbs. overweight for 5’ 4” person) No Data <10% 10%–14% 15%–19% 20%–24% 25%–29% ≥30%
 No Data <10% 10%–14% 15%–19% 20%–24% 25%–29% ≥30%.")
34
Obesity Trends* Among U.S. Adults BRFSS, 2009 (*BMI ≥30, or ~ 30 lbs. overweight for 5’ 4” person) No Data <10% 10%–14% 15%–19% 20%–24% 25%–29% ≥30%
 No Data <10% 10%–14% 15%–19% 20%–24% 25%–29% ≥30%.")
35
Obesity Trends* Among U.S. Adults BRFSS, 2010 (*BMI ≥30, or ~ 30 lbs. overweight for 5’ 4” person) No Data <10% 10%–14% 15%–19% 20%–24% 25%–29% ≥30%
 No Data <10% 10%–14% 15%–19% 20%–24% 25%–29% ≥30%.")
36
Missouri In 2010, 30.5% of adults were obese. -10 th highest rate in US In 2007, 31.5% of children were either obese or overweight. - 27 th highest rate in US

37
So What?

38
Weight of the Nation HBO-CDC documentary

39
2. Assess Your Menu

40
Eat Smart in Parks Guidelines FRUITS Offer at least one fresh, canned, dried or frozen fruit daily. All canned or frozen fruit should be packaged in 100% water or unsweetened juice, with no added sweeteners. VEGETABLES Offer at least one fresh, canned or frozen vegetable daily. Vegetables should be served raw, steamed, baked or grilled seasoned without added fat. GRAINS Offer 100% whole grain products such as cereal, bread, crackers, rice and pasta. DAIRY Offer low and nonfat milk and dairy products such as yogurt, cheese and pudding. PROTEINS: Offer low fat and unprocessed options such as lean meats, poultry, fish or vegetarian options. Protein options should be baked, broiled, grilled or boiled without added fat or oil.

42
Menu ItemFruitVegetableGrainProteinDairyNone 1.Sodax 2.Diet Sodax 3.Waterx 4.Gatoradex 5. Cheese Pizza/xx 6. Candyx 7. ChipsX 8.Popcornx 9. Slushiesx 10.NachosXx 11.FriesX 12. Hot Dogxx 13. Hamburgerxx 14. Grilled Cheesexx 15. Chicken Nuggets xx Totals01/29336

43
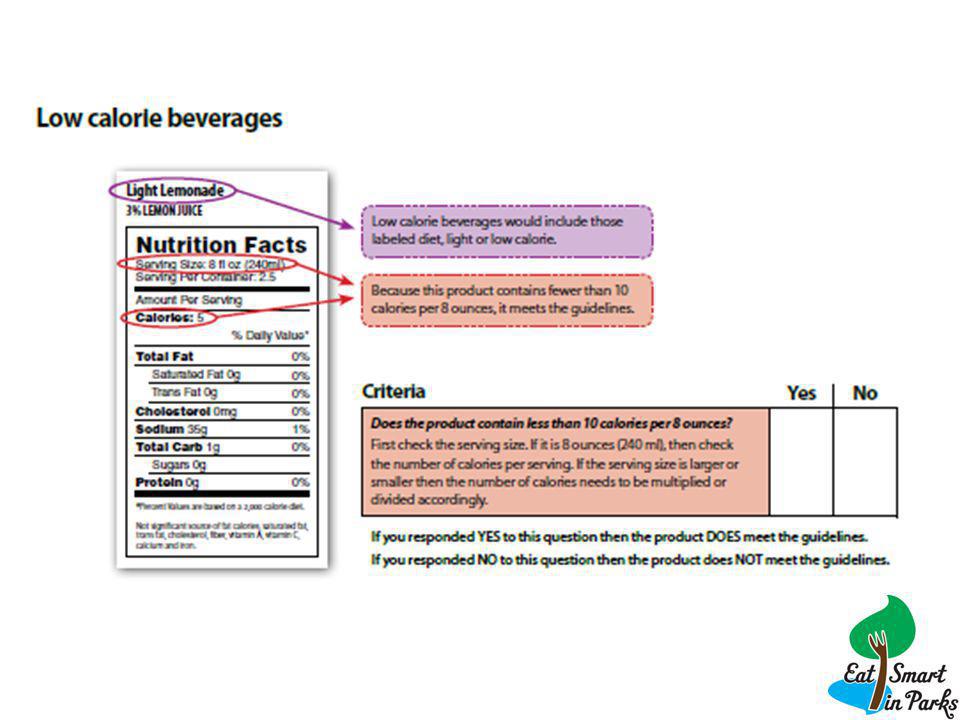
At least 60% of the BEVERAGES offered meet the following nutrition standards: Water Unflavored, non-carbonated and no additives Milk Nonfat and/or low-fat (1% or ½ %) flavored, unflavored. Milk contains no more than 24 grams of sugar and no more than 150 calories per 8 ounces Juice 100% (liquid or frozen) juice with no added sweeteners in containers of 8 ounces or less Calories/Portion size Low calorie beverages contain less than 10 calories per 8 ounces Beverages with greater than 66 calories per 8 ounces are sold in portions of 12 ounces or less Other Vegetable juices contain < 230 mg sodium per serving Electrolyte replacements don’t contain more than 42 grams of sweetener per 20 ounce serving Energy drinks are not sold
 juice with no added sweeteners in containers of 8 ounces or less Calories/Portion size Low calorie beverages contain less than 10 calories per 8 ounces Beverages with greater than 66 calories per 8 ounces are sold in portions of 12 ounces or less Other Vegetable juices contain < 230 mg sodium per serving Electrolyte replacements don’t contain more than 42 grams of sweetener per 20 ounce serving Energy drinks are not sold.")
47
Let’s Practice

48
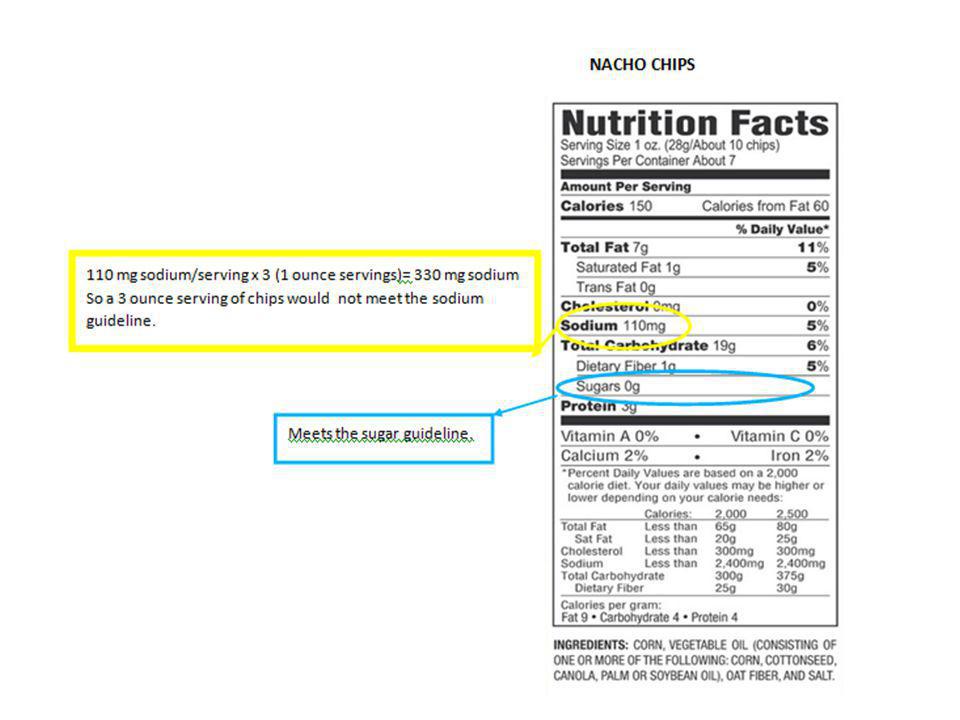
At least 60% of the FOODS offered meet all of the following nutrition standards: CALORIES: No more than 250 calories per item (excluding nut and seeds without added fat or sweeteners). FAT: No more than 35% of calories from total fat (excluding nuts, seeds and nut butters without added fat or caloric sweeteners) per serving. Snack mixes with nuts and other foods aren’t exempt from the 35% fat limit. o No more than 10% calories from saturated fat o 0 gm trans fat (<.5/serving) SUGAR: No more than 35% of calories from sugar per serving, except for fruit without added caloric sweeteners. No more than 30 grams sugar per 8 oz of yogurt, pudding, frozen yogurt or milk desserts. SODIUM: 250 mg or less per serving
 per serving. Snack mixes with nuts and other foods aren’t exempt from the 35% fat limit. o No more than 10% calories from saturated fat o 0 gm trans fat (<.5/serving) SUGAR: No more than 35% of calories from sugar per serving, except for fruit without added caloric sweeteners. No more than 30 grams sugar per 8 oz of yogurt, pudding, frozen yogurt or milk desserts. SODIUM: 250 mg or less per serving.")
54
Menu ItemMeets Guidelines Does Not Meet Guidelines Comment 1.Soda (16oz)x Has more than 66 cals per 8 oz. and portion size is greater than 12oz 2.Diet Sodax 3.Waterx 4.Gatorade (20oz)x 5. Cheese Pizza (1 slice 16”) x More than 250 calories/slice. Saturated fat is greater than 10%. Sodium is greater than 250 mg. 6. Candyx M&Ms, Reece’s cups, Snickers, Twix, Skittles, Ring Pops, Pixy Sticks all have more than 35% of their calories from sugar. 7. Chipsx Baked chips only. 8.Popcornxx Depends upon how it is prepared. Popcorn prepared with fat typically has more than 35% of the calories from fat. 9. Slushiesx More than 35% of calories are from sugar. 10.Nachos (3oz chips,4oz cheese) x More than 250 calories.(450 calories from chips) 11.Fries (4oz)X More than 250 calories.(380 calories) 12. Hot Dogx More than 250 calories, more than 35% calories from fat, more than 10% saturated fat, more than 250 mg sodium 13. Hamburgerx More than 10% of calories from saturated fat. 14. Grilled Cheesex More than 250 calories from fat (320 calories). More than 35% of calories from fat 15. Chicken Nuggets x More than 35% of calories from fat
x 5. Cheese Pizza (1 slice 16 ) x More than 250 calories/slice. Saturated fat is greater than 10%. Sodium is greater than 250 mg. 6. Candyx M&Ms, Reece’s cups, Snickers, Twix, Skittles, Ring Pops, Pixy Sticks all have more than 35% of their calories from sugar. 7. Chipsx Baked chips only. 8.Popcornxx Depends upon how it is prepared. Popcorn prepared with fat typically has more than 35% of the calories from fat. 9. Slushiesx More than 35% of calories are from sugar. 10.Nachos (3oz chips,4oz cheese) x More than 250 calories.(450 calories from chips) 11.Fries (4oz)X More than 250 calories.(380 calories) 12. Hot Dogx More than 250 calories, more than 35% calories from fat, more than 10% saturated fat, more than 250 mg sodium 13. Hamburgerx More than 10% of calories from saturated fat. 14. Grilled Cheesex More than 250 calories from fat (320 calories). More than 35% of calories from fat 15. Chicken Nuggets x More than 35% of calories from fat.")
55
3. Improve Your Menu

56
Menu ItemBetter Does Not Meet Guidelines Comment 1.Soda (16oz)Soda (12oz)x Has more than 66 cals per 8 oz. and portion size is greater than 12oz 2.Diet Soda 3.Water 4.Gatorade (20oz) Low-calorie sports drink 5. Cheese Pizza (1 slice 16” pie ) Cheese Pizza (1 slice 12” pie) xExceeds 250 mg sodium 6. Candy -Limit # candies 100 cal packs x M&Ms, Reece’s cups, Snickers, Twix, Skittles, Ring Pops, Pixy Sticks all have more than 35% of their calories from sugar. 7. Chips Baked chips only. 8.Popcorn Low fat microwave Depends upon how it is prepared. Popcorn prepared with fat typically has more than 35% of the calories from fat. 9. Slushies Frozen 100% juice cups 10.Nachos (3oz chips,4oz cheese) 2 oz chips, low fat cheese sauce x More than 250 calories.(450 calories from chips) 11.Fries (4oz) Tropical fruit in juice 12. Hot Dog Fat-free hot dog/ whole wheat bun x More than 250 mg sodium 13. Hamburger Grilled chicken/whole wheat bun 14. Grilled Cheese Uncrustables sandwich 15. Chicken Nuggets Dry roasted peanuts
 Low-calorie sports drink 5. Cheese Pizza (1 slice 16 pie ) Cheese Pizza (1 slice 12 pie) xExceeds 250 mg sodium 6. Candy -Limit # candies 100 cal packs x M&Ms, Reece’s cups, Snickers, Twix, Skittles, Ring Pops, Pixy Sticks all have more than 35% of their calories from sugar. 7. Chips Baked chips only. 8.Popcorn Low fat microwave Depends upon how it is prepared. Popcorn prepared with fat typically has more than 35% of the calories from fat. 9. Slushies Frozen 100% juice cups 10.Nachos (3oz chips,4oz cheese) 2 oz chips, low fat cheese sauce x More than 250 calories.(450 calories from chips) 11.Fries (4oz) Tropical fruit in juice 12. Hot Dog Fat-free hot dog/ whole wheat bun x More than 250 mg sodium 13. Hamburger Grilled chicken/whole wheat bun 14. Grilled Cheese Uncrustables sandwich 15. Chicken Nuggets Dry roasted peanuts.")
57
Shopping for Healthy Choices Talk with food distributors Distributors that serve MO – American Food Service – Kohls – Performance Food Service – Reinhart Food Service – Sysco – US Foods

58
Shopping for Healthy Choices Buying clubs-shop online Buy local produce Ask local resources for help- Extension, Schools

61
4. Test New Products

62
5. Market Healthy Choices

63
Poster

64
Business Cards

65
Eat Smart in Park Pick Designate foods that meet guidelines Post symbol key Train staff

66
In the first 30 years of your life, you make your habits. For the last 30 years of your life, your habits make you. - Hindu saying

67
Questions? Cindy DeBlauw RD University of Missouri Extension 573-882-2399 deblauwc@missouri.edu www.mocan.org

Similar presentations


 Learning Comes Alive through Classroom Cooking.>")


![HEALTHY COMMUNITY DESIGN Planning and designing communities that make it easier for people to live healthy lives [presenter name/title here/affiliation]](/8/2309633/big_thumb.jpg "HEALTHY COMMUNITY DESIGN Planning and designing communities that make it easier for people to live healthy lives [presenter name/title here/affiliation]>")


 Definitions: Obesity: having a very high amount of body fat in relation to lean body mass, or Body Mass Index.>")

