Download presentation
Presentation is loading. Please wait.

1
Major Trends in QLD State School Student Results [Socioeconomic Background and Student Mobility] Dr Roland Simons (DETA) Performance Monitoring and Reporting Branch
![Major Trends in QLD State School Student Results [Socioeconomic Background and Student Mobility] Dr Roland Simons (DETA) Performance Monitoring and Reporting Branch](http://images.slideplayer.com/10/2754213/slides/slide_1.jpg "Major Trends in QLD State School Student Results [Socioeconomic Background and Student Mobility] Dr Roland Simons (DETA) Performance Monitoring and Reporting Branch")
2
Purpose Fundamental / Induction –What measures do we have? –What do International and National results indicate? –How advanced are Qld systems? Advanced –What are Qld state results indicating? –How relevant is international and national research to Qld? –Evidence Based Practice List of related research. Opportunity to discuss implications, –[strategic] [policy] [operations]

3
Outline Recent Advances in Measurement in Qld Relationships with Student Achievement –Socio Economic Position (SEP) –Mobility Questions
 –Mobility Questions")
4
Recent advances This research is only possible because of recent advances / developments –Unique Student ID –Collection of parental SEP data – linked to student Trends –Data integration –Data specificity –Data diversity –New Measures (e.g., Value Add)
")
5
This is helping us to Investigate relevance of international / national research Test theoretical propositions / assumptions Investigate major trends across and within the state Disseminate information / knowledge for Departmental use Reaffirm existing practices Respond to National agenda Develop an “Evidence Base” for practice

6
Today’s presentation Has arisen from specific methodological work that PMRB has been doing and we have extracted the key findings because they also inform us about QLD specific relationships Limitations with data presented –It is largely a sample rather than the full population of students (but the numbers are large enough to warrant attention) –Typically focusing only on a small segment of time (e.g., 2002 to 2005)
 –Typically focusing only on a small segment of time (e.g., 2002 to 2005)")
7
When talking about student performance it is important to note = international and national research to date suggests…..

8
The single largest Predictor of Student Performance is….. Student ability… Decomposing influences generally has resulted in P isg = ƒ{X:S}+ε E.g., 2005 year 7 numeracy Student IRSED (5.6%) School IRSED (6.7%)
 School IRSED (6.7%).")
9
P isg = ƒ{X:S}+ε e.g., Resourcing Teacher Quality Curriculum Culture e.g., SEP Mobility Family Isolation Performance Unknowns ( ε ) Schooling (S) Characteristics (X) e.g., Ability Cultural
 Schooling (S) Characteristics (X) e.g., Ability Cultural")
10
P isg = ƒ{X:S}+ε e.g., SEP Mobility Family Isolation 3 5 7 Test Performance Unknowns ( ε ) Schooling (S) Proxy Measures (X)
 Schooling (S) Proxy Measures (X)")
11
Socio-Economic Position (SEP) Exploratory study using emerging information Context, Hypotheses, Sample, Results Implications for the future of SEP and achievement measurement and reporting
 Exploratory study using emerging information Context, Hypotheses, Sample, Results Implications for the future of SEP and achievement measurement and reporting")
12
Introduction SEP is one of the most commonly included variables in studies of student achievement General consensus is that it is relevant to the experience of education and therefore related to performance. Studies both local and international have implicated it with early, middle, tertiary education and beyond.

13
What is SEP? “the relative position of a family or individual in a social structure, based on their access to scarce and valued resources such as education, wealth, and prestige” (Marks, McMillan, Jones, & Ainley, 2000, p.9) SES – employment status, occupational status, education and income/wealth Social class Disadvantage …..of parents/caregivers!!!
 SES – employment status, occupational status, education and income/wealth Social class Disadvantage …..of parents/caregivers!!!.")
14
Research Advances … has matured somewhat from pure methodological debate thanks to international data sources (e.g, PISA, TIMMS). ….. countries do differ….. But a relationship remains What do these studies tell us? –different levels of effectiveness, and/or –different base levels of equity variation (i.e., learning contexts)
.")
15
PISA Reading Literacy 2003

16
PISA

17
Research Advances It is likely that the states also differ because of either: –different levels of effectiveness, and/or –different base levels of equity variation (i.e., learning contexts) Qld is likely to have a particular interest in the relationship….. Recent NATSEM paper on child social exclusion is yet another reminder of regional distributions of disadvantage that our education system responds to

18
Link to Achievement Student aspirations, self-esteem, attitude to education, ability/disability, parental aspirations, parental attitudes, home education resources, exposure to literature, teacher attitudes, curriculum delivery, peer group attitudes, school physical condition, class sizes, quality of teaching and materials, community characteristics… Direct / Indirect

19
International, National and State Research International Gary Marks, et al.,: 30 countries (2006) National and State Ken Rowe: All states (2006) Phillip Holmes-Smith: ACT, NSW, QLD, SA, NT (2006) Stephen Lamb: VIC (2004)
 National and State Ken Rowe: All states (2006) Phillip Holmes-Smith: ACT, NSW, QLD, SA, NT (2006) Stephen Lamb: VIC (2004)")
20
Studies largely at different levels International/ National State School Individual Ultimate level of conceptual accuracy Reporting High level research established generally resilient and enduring relationship but not be relevant to specific jurisdictions

21
Phillip Holmes-Smith Holmes-Smith, P. (2006). School Socio-Economic Density and its Effect on School Performance. Report for the New South Wales Department of Education and Training. School Research Evaluation and Measurement Services, 1-39. ” … while individual characteristics are poor predictors of individual performance, school average student characteristics are very strong predictors of school average performance. ” He later concluded: “..school average student characteristics (particularly socioeconomic indicators) are very strong predictors of school average performance. ” (2006, p.2).
 are very strong predictors of school average performance. (2006, p.2)..")
22
Individual versus School Level Achievement SES Achievement SES School Level Regression (n=1,000+) Hypothetical Regression Graphs Individual Level Regression (n=200,000+) School Averages Exaggerate the Effects of SES!
 Hypothetical Regression Graphs Individual Level Regression (n=200,000+) School Averages Exaggerate the Effects of SES!")
23
Achievement SES State Level Regression (n=1) Hypothetical Regression Graph State Level
 Hypothetical Regression Graph State Level")
24
Research findings - QLD School Ken Rowe – [~20.8% - 21.6%] – Reading / Maths / Science PISA sample Phillip Holmes-Smith – [~32.4% - 47.2%] – Literacy / Numeracy QLD Individual Ken Rowe – [~7.6% - 8.8%] – Reading / Maths / Science PISA sample Phillip Holmes-Smith – [~2.8% VIC] – Literacy / Numeracy VIC
![Research findings - QLD School Ken Rowe – [~20.8% %] – Reading / Maths / Science PISA sample Phillip Holmes-Smith – [~32.4% %] – Literacy / Numeracy QLD Individual Ken Rowe – [~7.6% - 8.8%] – Reading / Maths / Science PISA sample Phillip Holmes-Smith – [~2.8% VIC] – Literacy / Numeracy VIC](http://images.slideplayer.com/10/2754213/slides/slide_24.jpg "Research findings - QLD School Ken Rowe – [~20.8% %] – Reading / Maths / Science PISA sample Phillip Holmes-Smith – [~32.4% %] – Literacy / Numeracy QLD Individual Ken Rowe – [~7.6% - 8.8%] – Reading / Maths / Science PISA sample Phillip Holmes-Smith – [~2.8% VIC] – Literacy / Numeracy VIC")
25
Our Research ABS – School IRSED measure ABS (SEIFA) – geographically coded based on 2001 census Relatively scores (mean 1000, sd 100) Qld uses ABS IRSED data (combines income, education, occupation & employment, housing status, English fluency)…. Calculated at CD (collection district level) and then averaged to a best fit approach for postcodes and schools. Parental Data (each student) 2005-2006 introduction of parental data collection, collecting data and building databases continues Post code (student IRSED), parental occupation, parental education.
 and then averaged to a best fit approach for postcodes and schools. Parental Data (each student) introduction of parental data collection, collecting data and building databases continues Post code (student IRSED), parental occupation, parental education..")
26
Collection of Parental Education / Occupation Now, under National guidelines, state is collecting Parental data Occupation –Snr Management –Other business managers –Trades, skilled staff –Operators, assistants, labourers –Not working Education –Yr9 –Yr10 –Yr11 –Yr12 –Non-school qualification –Cert I to IV –Diploma –Degree or higher

27
Argument 1 Parental data is more relevant than geographically coded data because of the amount of error implicit in geographically coded SEP data Therefore should be a better prediction of student achievement than IRSED

28
Argument 2 IRSED data and parental data should start to approximate one another at higher levels of aggregation (e.g., school level). Assuming patterns of socio-economic mobility would not confound the value of the older census data (2001). Therefore there should be no added benefit for parental data at the school level over and above school IRSED
. Therefore there should be no added benefit for parental data at the school level over and above school IRSED.")
29
Socio-economic Mobility Low SEP Region Scenario 1 – Net increase in SEP, people don’t move 2001 2007 High SEP Region Transforms CENSUS DATA GOES OUT OF DATE Scenario 2 – Geographic SEP is same, people move High SEP Region 2001 2007 Low SEP Region People Transfer CENSUS DATA REMAINS CURRENT

30
Argument 3 Social mobility is not high. Therefore IRSED data based on 2001 will not demonstrate a decline in its relationship to student achievement over time.

31
Argument 4 The new trend toward growth or gain scores has led some to argue that gain scores effectively account for SEP… …and therefore student gain scores should be free of SEP effects.

32
How SEP might be controlled via gain scores Student A Student B Same Gain e.g., Year 3 to Year 5 Student Achievement Yr 5 Yr 3 High SEPLow SEP

33
BUT, this is also possible Student A Student B e.g., Year 3 to Year 5 Student Achievement Yr 5 Yr 3 High SEPLow SEP

34
Data used N=291,705 2003-2005, Reading, Writing, Numeracy 48.7% female, 51.2% male 5.8% Indigenous, 1.1% TSI, 0.6% both 63.9% metropolitan, 11.0% provincial city, 20.7% rural, 4.4% remote 1,104 schools (2-1,031 students) About 34% had parental data…of some sort (10% could not be categorised leaving 24% with usable parental data)
 About 34% had parental data…of some sort (10% could not be categorised leaving 24% with usable parental data)")
35
Parental Occupation/Employment Please note: Highlighted categories were removed from the analyses

36
Parental Education Please note: Highlighted categories were removed from the analyses

37
IRSED Student Postcode IRSED. IRSED values calculated using student postcode collection district averages indicated a range from 472.0 to 1,177.9, with an average of 980.7 and standard deviation of 88.2. Of the sample 274,628 students were allocated an IRSED value based on the postcode listed in their address at the time of their most recent test. When categorized into four IRSED groups the sample indicated 93,702 (34.1%) of students were of the high SEP group and 61,559 (22.4%) were of the low SEP group
 of students were of the high SEP group and 61,559 (22.4%) were of the low SEP group.")
38
School IRSED. IRSED values calculated using school CD coverage averages indicated a range from 472.0 to 1,141.5, with an overall average of 978.8 and standard deviation of 67.7. Of the sample 291,413 students were allocated an IRSED value based on the school that they were attending at the time of their most recent test. When categorized into four IRSED groups the sample indicated 60,140 (20.6%) of students were of the high SEP group and 43,655 (15.0%) were of the low SEP group
 of students were of the high SEP group and 43,655 (15.0%) were of the low SEP group.")
39
One measure of disadvantage ATSI. Indigeneity has been argued to be relevant to SEP as a proxy measure for disadvantage separate from the issue of socioeconomic status.

40
Outcome measures Student achievement scores (means) –Student –School –mid 80% of scores Raw gain scores Standardised gain scores (mean 0, sd 1)
 –Student –School –mid 80% of scores Raw gain scores Standardised gain scores (mean 0, sd 1)")
41
Initial Results

42
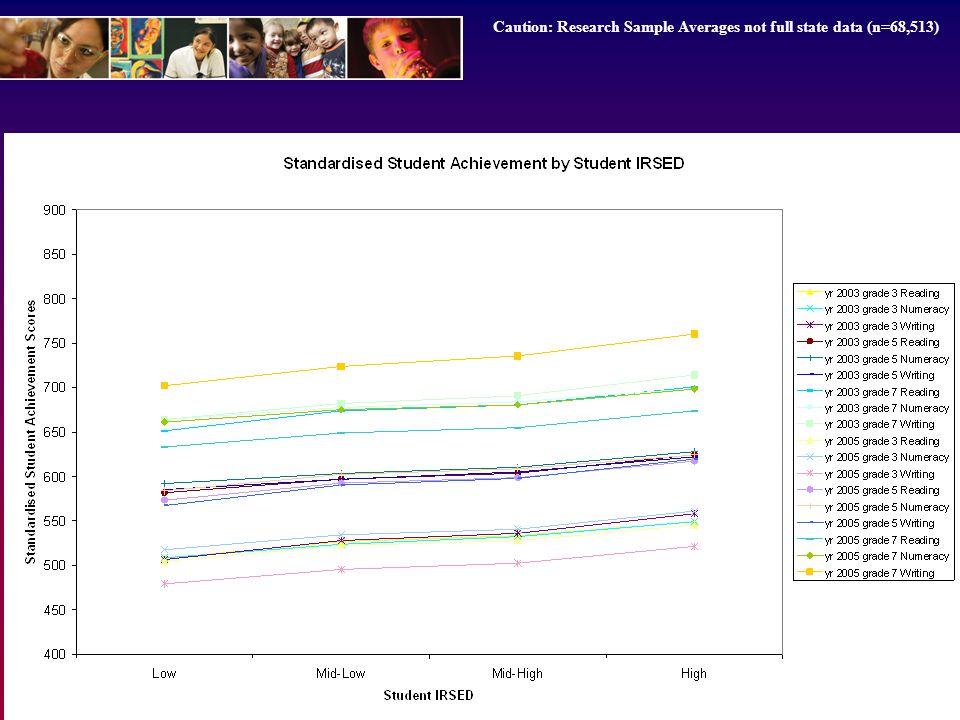
Individual student achievement Graphs of relationship

43
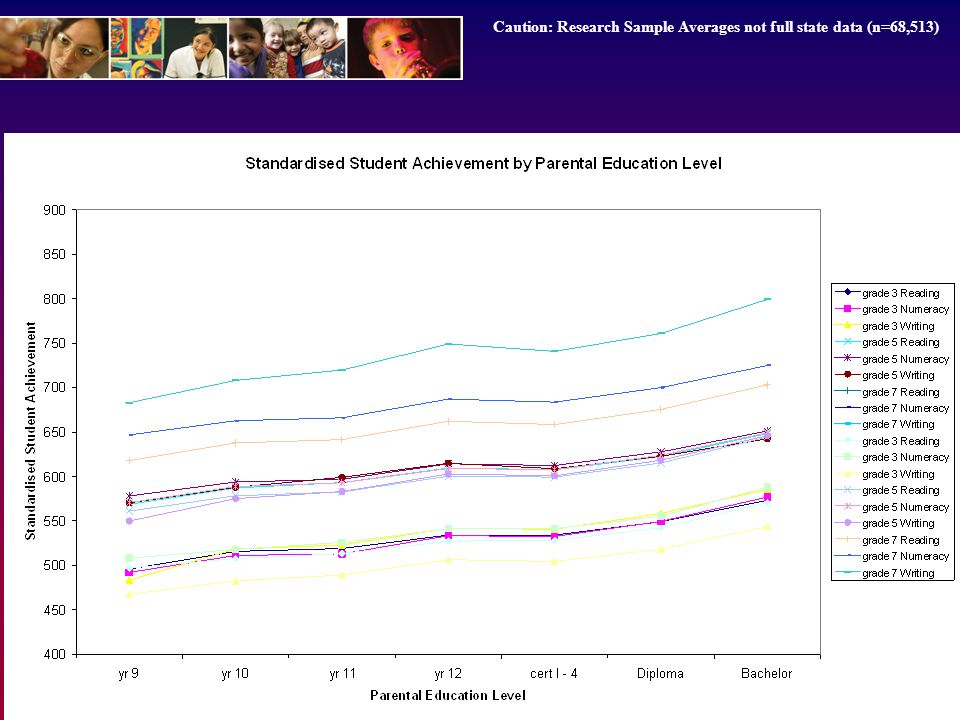
Caution: Research Sample Averages not full state data (n=68,513)
")
47
Argument 1 Individual – Stepwise regressions ATSI at step 3 Caution: Research Sample Averages not full state data (n=68,513)
")
48
Argument 2 School – Stepwise Regressions ATSI at step 3 Caution: Research Sample Averages not full state data (n=68,513)
")
49
Argument 3 IRSED over time (school level) Caution: Research Sample Averages not full state data (n=68,513)
 Caution: Research Sample Averages not full state data (n=68,513)")
50
Argument 4 SEP and gain scores ATSI at step 1 for raw scores & step 2 for standardised Caution: Research Sample Averages not full state data (n=68,513)
")
51
Special issues tested Mid 80% of student achievement scores tested against the full range of scores - error at the extremes Metro only versus all areas – social mobility Missing data – no special variation by achievement or regional zones Scaling types: Probabilities versus multi-level versus binomial categorisations….. All suggest similar profiles

52
Arguments for SEP Parental data would be better at predicting individual student achievement – supported. Parental data would not be better at predicting school achievement – supported. IRSED does not appear to be influenced by social mobility – supported. SEP is not relevant to study of growth/gain scores (value add) – not supported.
 – not supported..")
53
Implications Developmental - Parental data is superior to census data at the individual level but apart from a conceptually accurate understanding we can’t use this data for individual reporting…. It is useful at an academic level. School level + reporting – only marginal incremental value is suggested by parental measures. Trading pragmatics with accuracy with regard to student achievement. Earlier criticisms leveled at school based IRSED measures do not seem to hold for school and higher level reporting purposes and that issues of instability such as socio- economic mobility were not suggested by the data (limitation = restricted range).
..")
54
More Implications SEP is almost as relevant to the notion of gain-scores as it is to mean scores. National consistency in SEP measurement and usage is going to be important or else we will revert to methodological debates again. Correlations for Qld seem to be on par with previously reported research both nationally and internationally.

55
The path VERY well traveled! Some would say that we have known this for a long time…. (e.g., 1960s) Only recently is empirical testing becoming possible on such a large scale. We are trying many things – collection of parental data has made much of this possible….
 Only recently is empirical testing becoming possible on such a large scale. We are trying many things – collection of parental data has made much of this possible…..")
56
Student Mobility Similar methodological debates Similar history of debate Similar lack of empirical data EQ ID allows for some tracking 2003 to 2005 Broad classifications of mobility only 8% to 12% prediction at student level Relationship to Student IRSED (-.16**)
")
57
Results support literature For whatever reason, students experiencing high mobility perform less well on tests. Some reasoning offered in the literature -Disruption of home environment -Disruption of schooling (e.g., curriculum flow, class time lost) -Disruption of peer groups -Increased stress and anxiety -Change of teacher
 -Disruption of peer groups -Increased stress and anxiety -Change of teacher.")
58
Mobility SEP 1sd The Best Predictor of Performance is Student Ability In Perspective

59
P isg = ƒ{X:S}+ε e.g., Resourcing Teacher Quality Curriculum Culture e.g., SEP Mobility Family Isolation Performance Unknowns ( ε ) Schooling (S) Characteristics (X) e.g., Ability Cultural
 Schooling (S) Characteristics (X) e.g., Ability Cultural")
60
Correlation is not causation (e.g., SEP could be a proxy for something else) SEP Achievement Mobility e.g., Health… Not likely to be that simple
 SEP Achievement Mobility e.g., Health… Not likely to be that simple")
61
Correlation is not causation (e.g., our measures are only proxy measures for real phenomena) SEP Achievement Mobility e.g., Health, Community Service, Housing, Educational Continuity, Parenting, Home Stability, Peer Group, …… AbsenteeismATSISEP And with all the error implicit in measurement we could even doubt this too if the research internationally and nationally were not converging on similar relationships
 SEP Achievement Mobility e.g., Health, Community Service, Housing, Educational Continuity, Parenting, Home Stability, Peer Group, …… AbsenteeismATSISEP And with all the error implicit in measurement we could even doubt this too if the research internationally and nationally were not converging on similar relationships")
62
Questions / Share your views

Similar presentations