Download presentation
Presentation is loading. Please wait.

1
Trends in On-Duty Firefighter Deaths and Injuries Focusing on Career Firefighters Rita F. Fahy National Fire Protection Association Urban Fire Forum September 6, 2014

2
Presentation Overview Review data sources for the two studies Overview of injury statistics Brief overview of the 2013 Firefighter Fatality Study Trends in career firefighter fatalities

4
Data Sources Firefighter injury data: Aggregate data collected as part of our annual fire experience survey Based on national estimates from a stratified random sample of fire departments Career vs. volunteer status of victims not reported Firefighter fatality data: Firefighter fatality database is a ‘census’

5
Firefighter Injury Study Firefighter exposures - to infectious diseases - to hazardous conditions Matrix reporting - Nature of Injury by Type of Duty Fire Ground injuries by Cause of Injury Fire Department Vehicle Crashes

6
Firefighter Injuries - 1981 – 2012 Number of Injuries 69,400

7
Overall Results 69,400 firefighter injuries occurred on duty in 2012 – the lowest since study began in 1981. There were 8,150 exposures to infectious diseases (e.g., hepatitis, meningitis, HIV, others) in 2012 (0.3 exposures per 1,000 emergency medical runs by fire departments in 2012). There were 19,200 exposures to hazardous conditions (e.g., asbestos, radioactive materials, chemicals, fumes, other) in 2012 (18.2 exposures per 1,000 hazardous condition runs in 2012). An estimated 14,350 firefighter injuries resulted in lost time in 2012 (20.6% of all injuries).
 in 2012 (0.3 exposures per 1,000 emergency medical runs by fire departments in 2012). There were 19,200 exposures to hazardous conditions (e.g., asbestos, radioactive materials, chemicals, fumes, other) in 2012 (18.2 exposures per 1,000 hazardous condition runs in 2012). An estimated 14,350 firefighter injuries resulted in lost time in 2012 (20.6% of all injuries)..")
8
Firefighter Injuries by Type of Duty 31,490

9
Fire Department Calls Year Total Fires Medical False alr Mut aid HazMat HazCn Other 198611,890,0002,271,5006,437,500992,500441,000171,500318,0001,258,000 199114,556,5002,041,5008,176,0001,578,500494,000221,000428,5001,617,000 199617,503,0001,975,0009,841,5001,816,500688,000285,000536,5002,360,500 200120,965,0001,734,50012,331,0002,157,500838,500381,500605,0002,917,500 200624,470,0001,642,50015,062,5002,119,5001,159,500388,500659,0003,438,500 201028,205,0001,331,50018,522,0002,187,0001,189,500402,000660,0003,913,000 201130,098,0001,389,50019,803,0002,383,0001,252,000379,000720,0004,171,500 201231,854,0001,375,00021,705,5002,238,0001,326,500360,000694,0004,155,000 Change from 1986 More than doubled Down 2/5 More than tripled More than doubledTripled Doubled More than doubled More than tripled

10
U.S. Fire Department Calls

12
YearInjuriesPer 1K firesInjuries Per 1K Incidents 1998 1999 2000 2001 2002 2003 2004 2005 2006 2007 2008 2009 2010 2011 2012 43,080 45,500 43,065 41,395 37,860 38,045 36,880 41,950 44,210 38,340 36,595 32,205 32,675 30,505 31,490 24.5 25.0 25.2 23.9 22.4 24.0 22.1 26.2 26.9 24.6 25.2 24.1 24.5 22.0 22.9 13,960 13,565 13,660 14,140 15,095 14,550 13,150 12,250 13,090 15,435 15,745 15,455 13,355 14,905 12,760 0.82 0.76 0.73 0.77 0.70 0.62 0.56 0.57 0.65 0.66 0.62 0.50 0.42 Firefighter Injuries and Injury Rates At the Fireground At Non-Fire Emergencies

13
Firefighter Injuries at the Fire Ground and at Non-Fire Emergencies Injuries Injuries per 1K Inc Non-Fire Emergency Fire Ground

14
Fire Ground Injuries by Nature of Injury

15
Population Protected Average Number of Fires Average Number of Fire Ground Injuries Fire Ground Injuries per 100 Fires Fire Ground Injuries per 100 FFs 1,000,000 or more* 500,000 - 999,999 250,000 - 499,999 100,000 - 249,999 50,000 - 99,999 25,000 - 49,999 10,000 - 24,999 5,000 - 9,999 2,500 - 4,999 Under 2,500 4,223.2 2,506.5 1,157.0 509.5 223.0 113.6 65.2 35.3 24.5 12.5 87.1 81.5 38.0 9.8 4.0 2.1 1.0 0.4 0.3 0.2 2.1 3.3 1.9 1.8 1.5 1.1 1.2 1.6 4.3 7.1 8.3 4.5 3.9 3.4 2.4 1.3 1.0 0.8 Average Number of Fires, Fire Ground Injuries and Injury Rates by Population Protected * Excludes New York City

16
Year CollisionsFF InjuriesCollisions FF Injuries 1998 1999 2000 2001 2002 2003 2004 2005 2006 2007 2008 2009 2010 2011 2012 14,650 15,450 15,300 14,900 15,550 15,900 15,420 15,885 16,020 14,650 14,950 15,100 14,200 14,850 14,300 1,050 875 990 960 1,040 850 980 1,120 1,250 915 670 820 775 970 725 1,350 1,080 1,160 1,325 1,030 980 1,150 1,080 1,070 665 1,000 870 1,000 790 750 315 90 170 140 210 85 220 125 210 120 70 100 75 190 70 Vehicle Crashes and Resulting Injuries While Responding to or Returning from Alarms Involving FD Vehicles Involving FF personal vehicles

17
Crashes and Firefighter Injuries While Responding to or Returning from Alarms

18
Firefighter Fatalities

19
Who is a firefighter? State and local fire service personnel, career and volunteer State or local public service officer, acting as firefighter Federal government fire service personnel Temporary fire suppression personnel operating under official auspices of one of the above Privately employed firefighters

20
How do we define “on-duty?” At scene of alarms, whether fire or non-fire En route responding to or returning from alarms Performing other duties, including training, maintenance, public education, inspection, investigation, etc. Performing non-fire duties on official assignment Station duty

21
What do we count as an on-duty fatality? Any injury that was incurred while on duty and proves fatal Any illness that was incurred as a result of actions while on duty and proves fatal On-duty fatalities are associated with specific on-duty activities and are reported as of the date of injury or onset.

22
Defining the U.S. Firefighter Death Problem

23
Off-Duty, Retired and Former Firefighters Defining the U.S. Firefighter Death Problem The long-term health effects of firefighting cannot be reliably measured, in terms of resulting job-related deaths. A complete picture of the hazards of firefighting would include these fatalities.

24
Defining the U.S. Firefighter Death Problem On-Duty Firefighters The NFPA inclusion criteria counts deaths where onset occurred while the firefighter was on-duty. USFA adds Hometown Hero/PSOB qualifiers who were off-duty.

25
NFFF Defining the U.S. Firefighter Death Problem The National Fallen Firefighters Foundation uses the most narrow inclusion criteria, counting on-duty deaths and Hometown Hero qualifiers, but excluding on-duty deaths where drug abuse or negligence was a factor.

26
Off-Duty, Retired and Former Firefighters Defining the U.S. Firefighter Death Problem On-Duty Firefighters

27
41 volunteer firefighters 30 wildland firefighters 25 career firefighters 1 prison inmate 97 On-Duty Fatalities in 2013

28
Volunteer Career

29
2013 Firefighter Deaths by Type of Duty

30
2013 Career Firefighter Deaths by Type of Duty

33
Career Firefighter Deaths by Time of Day 2004 - 2013

34
Career Firefighter Deaths by Time of Incident 2004 - 2013

35
Career Firefighter Deaths by Time of Incident 2004 - 2013

36
Career Firefighter Deaths by Time of Incident 2004 - 2013

37
Career Firefighter Deaths by Time of Incident 2004 - 2013

38
Career Firefighter Deaths by Time of Incident 2004 - 2013

39
Career Firefighter Deaths by Time of Incident 2004 - 2013

41
2013 Career Firefighter Deaths by Cause of Injury

45
2013 Career Firefighter Deaths by Nature of Injury

52
1994-2013 Career Firefighter Deaths by Type of Duty

53
Structures 93% Vehicles 1% Refuse 1% Wildland 5% Career Firefighter Deaths by Type of Duty and Incident Type

54
Structure Fire Deaths by Fixed Property Use Career Only 1994-2013

55
Structure Fire Deaths by Fixed Property Use Career Only Vol – 6.9% Vol – 11.8% Vol – 4.5% Vol – 4.9% Vol – 62.2% Vol – 8.5%

56
CauseInsideOutside On Roof On LadderTotal Structural collapse Exertion/stress/other medical Fire progress Lost inside Struck by object/vehicle Explosion Fell in hole burned in floor/roof Fell/jumped from structure Other falls Electrocution Smoke exposure (all no SCBA) Gunshot Other caught/trapped Total 59 20 49 30 3 2 7 3 2 5 13 187 5 32 4 5 1 48 1322813228 11241124 65 56 43 30 7 9 5 3 5 1 13 247 Causes of Fatal Injuries at Structure Fires
 Gunshot Other caught/trapped Total Causes of Fatal Injuries at Structure Fires")
58
Patterns for Career Firefighter Deaths at Structure Fires

59
Major Causes of Non-Cardiac Deaths Inside Structures

60
Death Due to the Three Major Causes of Fatal Injuries While Operating Inside at Structure Fires

61
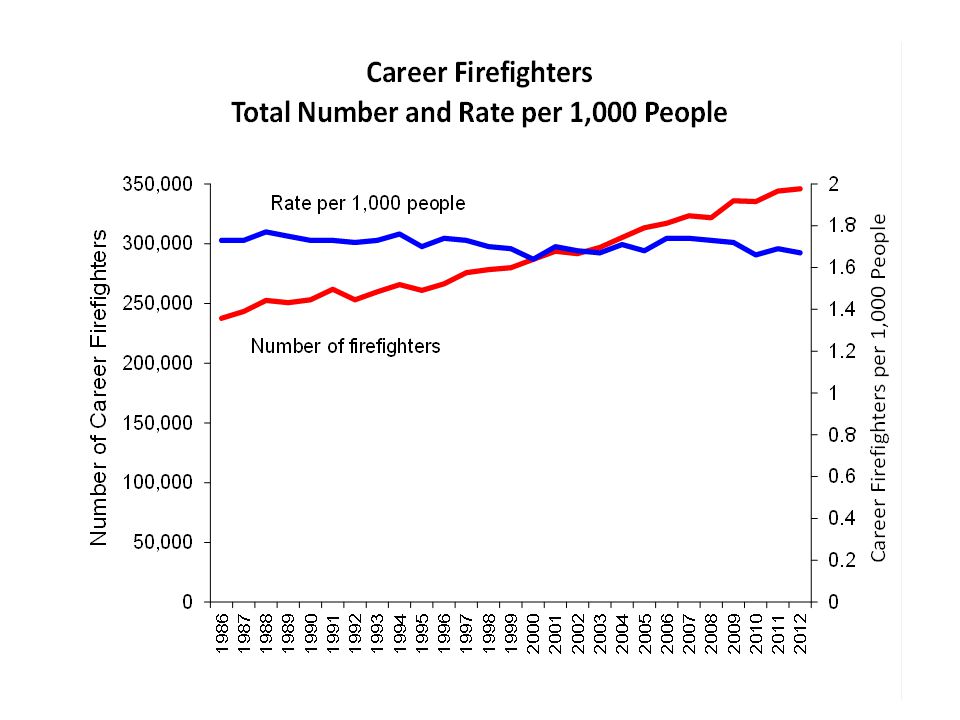
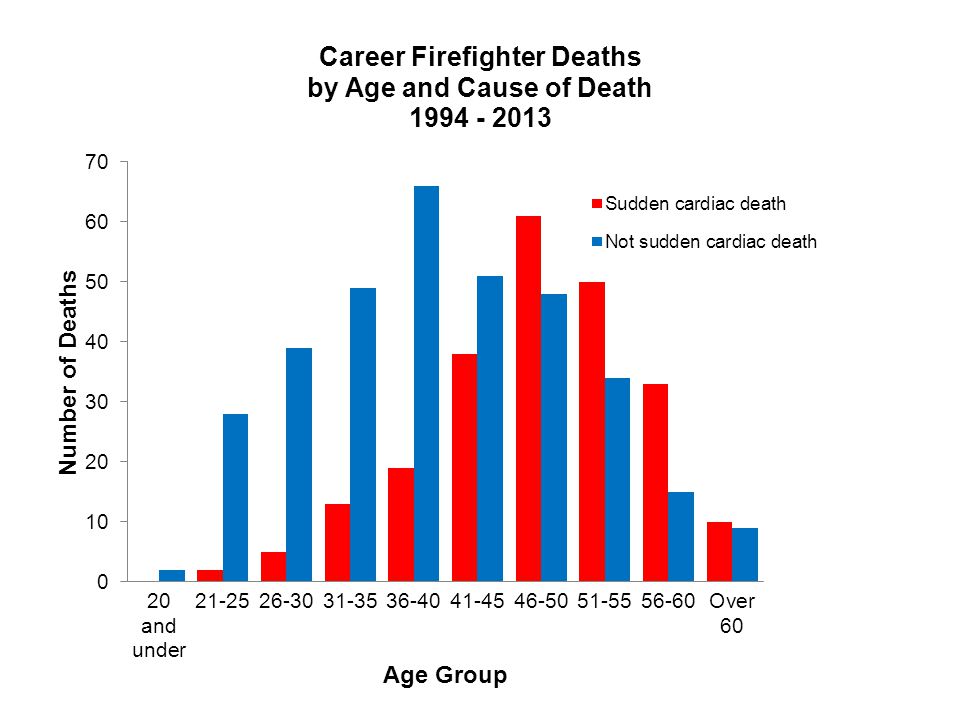
The average number of career firefighter deaths annually has dropped by half over the past 25 years. Among career firefighters, on-duty sudden cardiac deaths have dropped as well, but remain the #1 cause of on-duty firefighter deaths Almost half of all career firefighter deaths occur on the fire ground Snapshot

62
Sudden cardiac death continues to be the major problem Real progress has been made in reducing firefighter deaths over the past 30 years, but more can be done, but on-duty career firefighter deaths are at a plateau of approximately 25 deaths each year. Concluding remarks

63
The 2013 firefighter fatality study was published in the July/August issue of NFPA Journal and the full report is available free on NFPA’s website: www.nfpa.org (under Research & Reports)
")
Similar presentations


 pantry survey found that.>")


 HIV prevalence rate (%) globally and in Sub-Saharan Africa,>")
