Download presentation
Presentation is loading. Please wait.

1
A Case Study of Heavy Precipitation Occurring in Continental Environment To investigate a case of a heavy winter precipitation event of 7 January 2002 that was a challenge to operational forecasters. John R. Gyakum, McGill Paul A. Sisson, NWS Ron McTaggart-Cowan, McGill Garry Toth, Met Svc Canada Peter Lewis, MSC John K. Parker, MSC

2
A Cooperative program for Operational Meteorology, Education, and Training (COMET) Cooperative Outreach Project McGill University Montreal, QC, Canada National Weather Service Burlington, VT USA Cold-Season Quantitative Precipitation Forecasting for the Burlington, Vermont Region
 Cooperative Outreach Project McGill University Montreal, QC, Canada National Weather Service Burlington, VT USA Cold-Season Quantitative Precipitation Forecasting for the Burlington, Vermont Region")
3
Outline Synoptic Overview Diagnosis Mesoscale Modelling using MC2 Summary

4
Synoptic Overview Summary 12-18” Snowfall in 3-6hrs in narrow mesoscale band KALY-KVSF-KLEB Little if any orographic enhancement 16:1 Snow to water ratios 3-4”/hr snowfall rates for ~3 hrs Cloud to ground Lightning detected at KPOU. Surface Low Track ACY-ISP-PVD-PYM Intense Upper-level mesoscale trough

5
Snowfall ending 12 UTC 7 Jan 02 KBTV KLEB KVSF 6 inch 12 inch 6 inch 3 inch

6
24-h Precipitation (in) ending 12 UTC 7 January 2002 KBTV
 ending 12 UTC 7 January 2002 KBTV")
7
KVSF 070654Z AUTO VRB04KT 2 1/2SM -SN BR BKN012 OVC021 00/M01 A2946 RMK AO2 SLP983 P0012 T00001006= KVSF 070554Z AUTO 35004KT 1/4SM +SN FG OVC002 00/M01 A2949 RMK AO2 SLP990 P0020 60068 T00001006 10000 21011 56039= KVSF 070454Z AUTO VRB03KT 1/2SM SN FG OVC003 00/M01 A2949 RMK AO2 SLP993 P0019 T00001006 400281033= KVSF 070354Z AUTO 00000KT 1/4SM +SN FZFG OVC002 M01/M01 A2954 RMK AO2 SLP010 P0014 T10061006= KVSF 070254Z AUTO 36003KT 1/2SM SN FZFG BKN003 OVC010 M01/M01 A2960 RMK AO2 PRESFR SLP032 P0008 60015 T10061011 58047= KVSF 070154Z AUTO 00000KT 3/4SM -SN BR VV004 M01/M01 A2966 RMK AO2 SLP052 P0006 T10061011= KVSF 070054Z AUTO 00000KT 1 1/2SM -SN BR OVC014 M01/M02 A2970 RMK AO2 SLP066 P0001 T10111017= Springfield VT ASOS (KVSF) 0.80” = 12.0” Snow
 0.80 = 12.0 Snow")
8
Reflectivity (dbZ) 02-09 UTC 7 Jan 2002
 UTC 7 Jan 2002")
9
03 UTC 7 January CG Lightning RUC SLP METAR KPOU

10
500 hPa Heights at 00Z 7 Jan 2002 SLP 06 UTC

11
Albany Sounding 00 UTC 7 Jan 2002

12
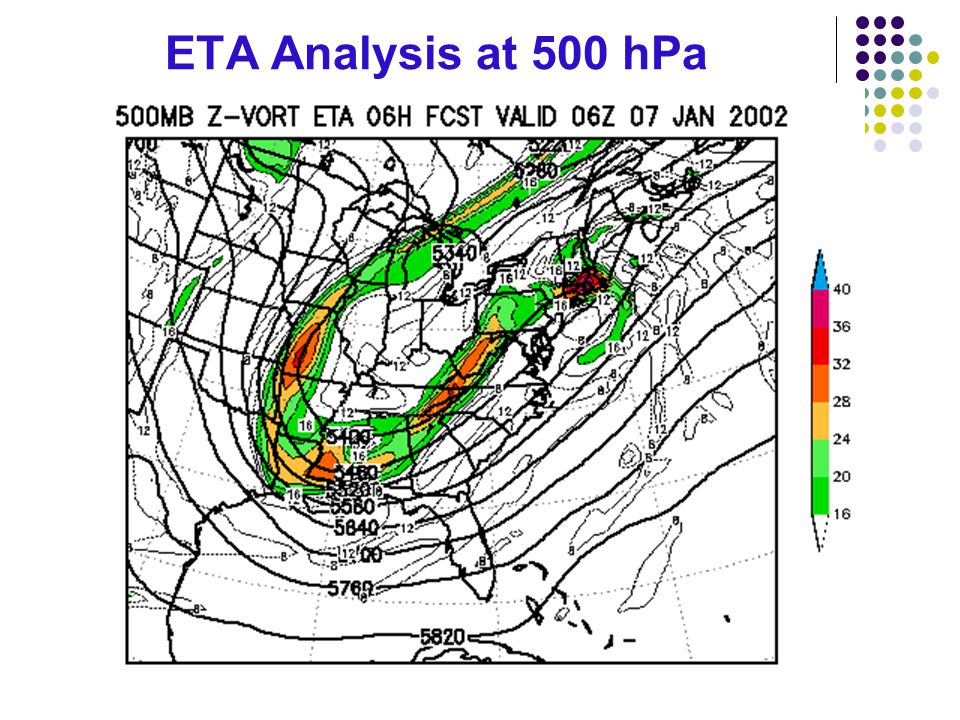
ETA Analysis at 500 hPa

16
ETA 36 hr Forecast From

17
NCEP Short Range Ensemble Forecast (SREF) from 21 UTC 5 Jan 2002
 from 21 UTC 5 Jan 2002")
18
Mesoscale Modeling MC2 version 4.9.3 Non-hydrostatic, semi-implicit time step, semi-Lagrangian advection Kain-Fritsch Convective Paramertization(36km,12km) Three one-way nest domains (36km,12km,3km) Model Description
 Three one-way nest domains (36km,12km,3km) Model Description")
19
Nesting Strategy 36km 12 km 3 km KBTV

20
MC2 36-h Forecast 12-h Precipitation Accumulation (mm) valid 12 UTC 7 January 2002 36-km 12-km
 valid 12 UTC 7 January km 12-km")
21
Precipitable Water (mm) 24-h Forecast valid 00 UTC 7 Jan 2002 36-km 12-km
 24-h Forecast valid 00 UTC 7 Jan km 12-km")
22
Dynamic Tropopause (DT) Defined as 1.5 Potential Vorticity unit surface (where 1 PVU is 1.0 X 10 -6 K m 2 kg -1 s -1 ) DT separates high PV air in the stratosphere from lower PV in the troposphere Useful for a concise display of jets and upper troughs which usually are at a maximum at the DT Advections of lower potential temperature (higher pressure) on the DT are favorable for cyclogenesis
 Defined as 1.5 Potential Vorticity unit surface (where 1 PVU is 1.0 X K m 2 kg -1 s -1 ) DT separates high PV air in the stratosphere from lower PV in the troposphere Useful for a concise display of jets and upper troughs which usually are at a maximum at the DT Advections of lower potential temperature (higher pressure) on the DT are favorable for cyclogenesis")
23
Potential Temperature (K) Dynamic Tropopause (DT;1.5 PVU) 24-h Forecast valid 00 UTC 7 Jan 2002 36-km 12-km
 Dynamic Tropopause (DT;1.5 PVU) 24-h Forecast valid 00 UTC 7 Jan km 12-km")
24
Dynamic Trop 21 – 03 UTC

27
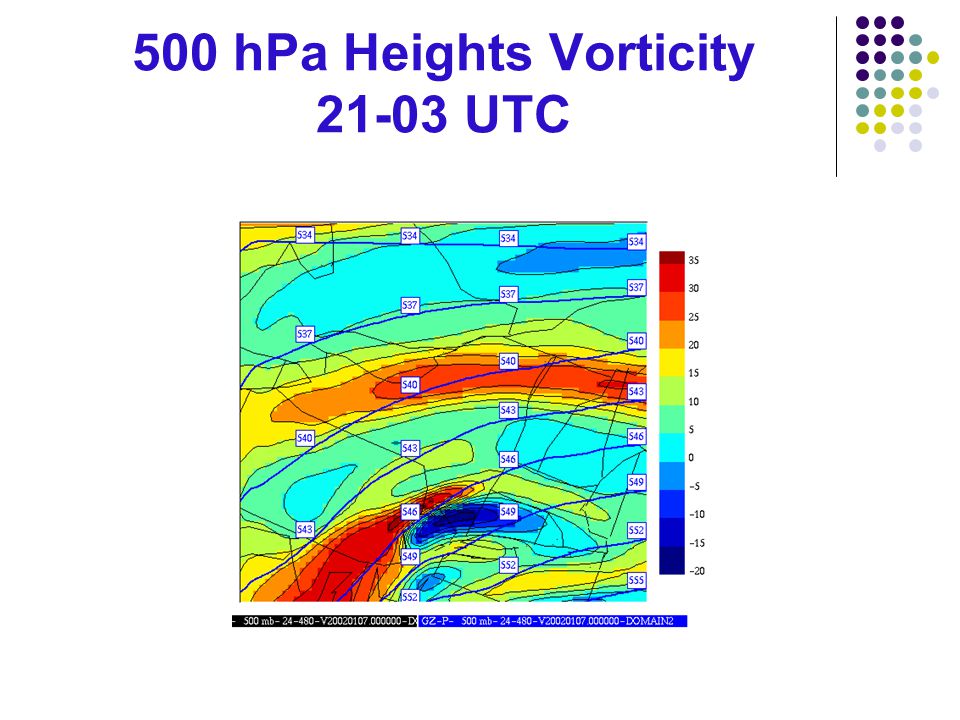
500 hPa Heights Vorticity 21-03 UTC

30
Coupling Index (CI) Bosart and Lackmann MWR 1995 Theta(Dyn Trop) – Theta-e (850hPa) “…crude measure of tropospheric lapse rate” “ …small positive or negative values indicate where deep convection is possible, given the existence of a suitable lifting mechanism.” MC2 variation of CI “Best” or most unstable CI using maximum theta sfc-850 hPa
 Bosart and Lackmann MWR 1995 Theta(Dyn Trop) – Theta-e (850hPa) …crude measure of tropospheric lapse rate …small positive or negative values indicate where deep convection is possible, given the existence of a suitable lifting mechanism. MC2 variation of CI Best or most unstable CI using maximum theta sfc-850 hPa")
31
Coupling Index Theta(DT) – Theta-e max(850hPa) 00 UTC 7 January 2002 36-km 12-km
 – Theta-e max(850hPa) 00 UTC 7 January km 12-km")
32
Time Lapse CI

35
Potential Vorticity (PVU) X-Section CYMX-KACK Equivalent Potential Temp (K) shaded 27-hr fcst valid 3 UTC 7 Jan 2002 KLEB Lowering DT Convective Instability
 X-Section CYMX-KACK Equivalent Potential Temp (K) shaded 27-hr fcst valid 3 UTC 7 Jan 2002 KLEB Lowering DT Convective Instability")
36
Poor? AWIPS substitutes For CI use Showalter Index (SI) Temp (500 hPa) – Temp (lifted from 850 hPa) For DT use single1.5 PVU contours on multiple theta surfaces
 Temp (500 hPa) – Temp (lifted from 850 hPa) For DT use single1.5 PVU contours on multiple theta surfaces.")
37
ETA Showalter Index 3-hr fcst valid 0300 UTC 7 Jan 2002

39
Summary The 7 January 2002 Heavy Precipitation Event was a challenge to Operational Forecasters Band of intense precipitation occurred north of forecasted precipitation maximum 24-36-h in advance 12km MC2 captured important detail at the dynamic tropopause Deep layer instability appeared to be important in location and intensity of precipitation 36km MC2 did not capture this detail Precipitable Water may have been deficient at 12-km and contributed to lower QPF

40
Future Work Nudge Precipitable Water near band location Move 3km grid to the heavy precipitation area Will use in a Warning Event Simulation for BTV forecasters in 2002 Have forecasters look at the DT based Coupling Index to assess tropospheric stability RUC use AWIPS Volume Browser Difference Function; other NCEP models DT grids soon? Move MC diagnostics into AWIPS (via LDAD)
.")
41
McGill University Real-Time MC2 http://132.206.43.151:5080/realtime/ Dynamic Tropopause and PV diagnostics 00Z Initial time

Similar presentations