Download presentation
Presentation is loading. Please wait.

1
Enron Broadband Services
Jeff Skilling President & CEO-Elect Enron Corp

2
Enron Annual Sales 100.8B 9.2B 5.5B

3
Enron Market Value 72.1B 9.6B 2.7B

4
Enron Price/Earnings Ratio
46.4 17.4 16.4 *Continuing operations

5
Enron Assets 53B 12B 10B * As of Q3 2000

6
Total Return to Shareholders Jan 1, 1990 to Dec 31, 2000
1600 Enron Corp. S&P 500 Pipeline Avg. Utility Avg. E&P Avg. 1,415% 383% 545% 281% 217% 1400 1200 1000 800 600 400 200 Aug 00 -200 Dec 90 Dec 91 Dec 92 Dec 93 Dec 94 Dec 95 Dec 96 Dec 97 Dec 98 Dec 99 Nov 00 Dec 00 Note: Calculated to December 31, 2000

7
® Enron Transportation Services Enron Wholesale Services Enron Energy
Broadband Services

8
Market Capitalization (Billions)
World’s Largest Gas-Fired Power Plant Completed in the U.K. Enron Broadband Services Established Leading U.S. Wholesale Power Marketer Leading U.S. Wholesale Gas Marketer Largest U.S. Gas Pipeline Company from HNG/InterNorth Merger EnronOnline Introduced Leading European Wholesale Gas & Power Marketer Enron Oil & Gas Company IPO Enron Energy Services Established

9
Economic Trade-Off Cost of Interaction $ Value of Specialization
Volume

10
Evolution of Economic Trade-Off
1300’s Creation of Money $ Barter Economy Volume

11
Evolution of Economic Trade-Off
1300’s 1800’s Creation of Money $ Transportation & Communication Barter Economy Volume

12
Evolution of Economic Trade-Off
1300’s 1800’s Creation of Money 2000’s $ Transportation & Communication Internet & InfoTech Barter Economy Volume

13
Types of Interaction Costs
Credit Legal & Regulatory Logistics Price of Successful Economic Transactions Information Seeking & Gathering Payments Inventory

14
Cost of Interaction 30-40% 60-70% 55% 40-50% Financial Mining
Institutions Mining U.S. 30-40% 60-70% 55% India 40-50% Source: McKinsey

15
Business Structure Transformation Interaction 1.0 1.0 1.0 .90 Finished Product .85 Transformation Costs Interaction Costs Total Costs .90 3.45 3.00 6.45 .80 Finished Product Transformation Costs Interaction Costs Total Costs .95 1.10 1.20 1.10 .20 .20 .20 4.35 .60 4.95 15

16
Cost of Teller Transaction
$1.50 $0.30 $0.01 1985 (Bank) 1995 (ATM) 2000 (Internet)
 (ATM) (Internet)")
17
Length of Time to Provision Bandwidth
6-8 months 2-3 months < 1 second 1995 Today Next Year

18
2-3 years 9 months 2 weeks < 1 second
Length of Time to Execute a Long-Term Gas Contract 2-3 years 9 months 2 weeks < 1 second 1981 1989 1997 2000

19
Change in Economics of Business Structure
Transformation Interaction .90 1.0 1.0 1.0 .10 .10 .10 Finished Product .85 Transformation Costs Interaction Costs Total Costs .90 3.45 3.00 6.45 3.45 .30 3.75 .80 Finished Product Transformation Costs Interaction Costs Total Costs .95 1.10 1.20 1.10 .20 .20 .20 4.35 .60 4.95 19 19

20
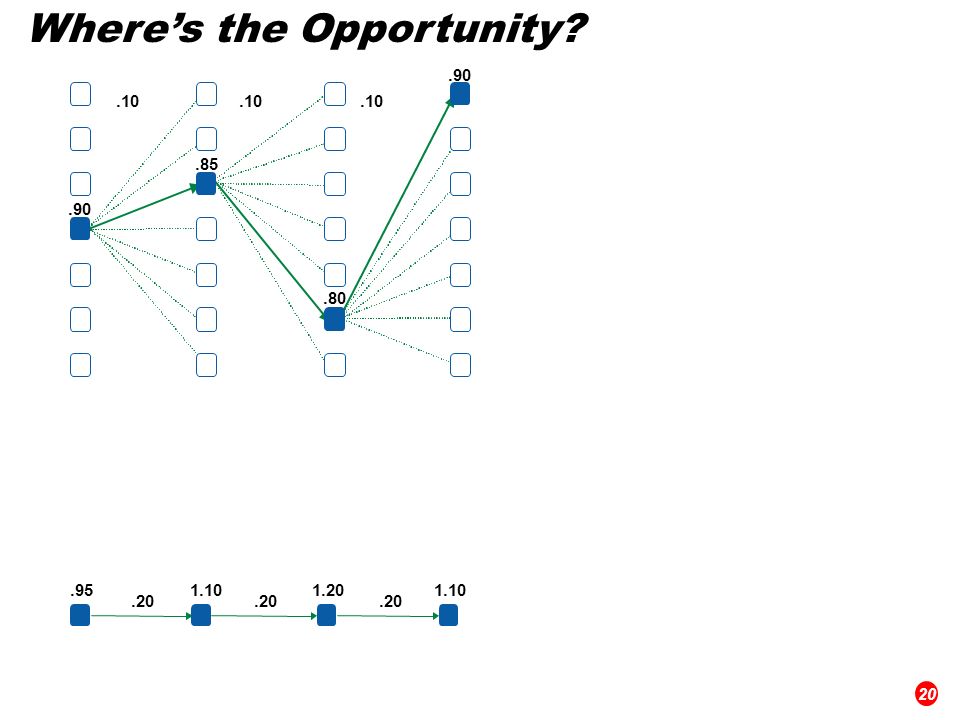
Where’s the Opportunity?
.90 .10 .10 .10 .85 .90 .80 .95 1.10 1.20 1.10 .20 .20 .20 20
21
Where’s the Opportunity?
.90 .10 .10 .10 .85 .90 .80 Not Cost Competitive .95 1.10 1.20 1.10 .20 .20 .20 21

22
Where’s the Opportunity?
.90 .10 .10 .10 Commoditized Overcapitalized Globalized Can’t make compensatory return in traditional asset business .85 .90 .80 .95 1.10 1.20 1.10 .20 .20 .20 22

23
Where’s the Opportunity?
.90 .10 .10 .10 Creating low cost, dependable market interfaces Market making Logistics Back office Trade finance .85 .90 .80 .95 1.10 1.20 1.10 .20 .20 .20 23

24
Where’s the Opportunity?
.90 .10 .10 .10 .85 .90 .80 Providing packaged turnkey solutions for customers Complex structures Differentiation Customization “Virtual” Integration .95 1.10 1.20 1.10 .20 .20 .20 24

25
Enron Opportunity Traditional Asset intensive Business Model
Vertically integrated Slow moving and rigid Hierarchical New Business Model Brain power intensive Networked Oriented toward “real options” Fast moving Entrepreneurial

26
Enron–Accelerating Market Development
Metals Commodity Product Financial Bandwidth Australian Power & Gas Pulp & Paper Coal Weather Scandinavian Power & Gas Plastics Emissions Financials (interest rate, equity) UK Power & Gas Electricity Currencies Natural Gas 1985 1986 1987 1988 1989 1990 1991 1992 1993 1994 1995 1996 1997 1998 1999 2000 * Lighter shading indicates a developing market Darker shading indicates a mature market
 UK Power & Gas. Electricity. Currencies. Natural. Gas * Lighter shading indicates a developing market. Darker shading indicates a mature market.")
27
EnronOnline – Changing the Way Commodities Are Traded
Free, Reliable Transaction System with Enron as Principal Transactions per day

28
Enron Efficiency Gains
Transactions Per Market Maker Marginal Cost Per Transaction (Indexed) 100 3,084 25 672 1999 2000 1999 2000
 ,")
Similar presentations


