Download presentation
Presentation is loading. Please wait.

1
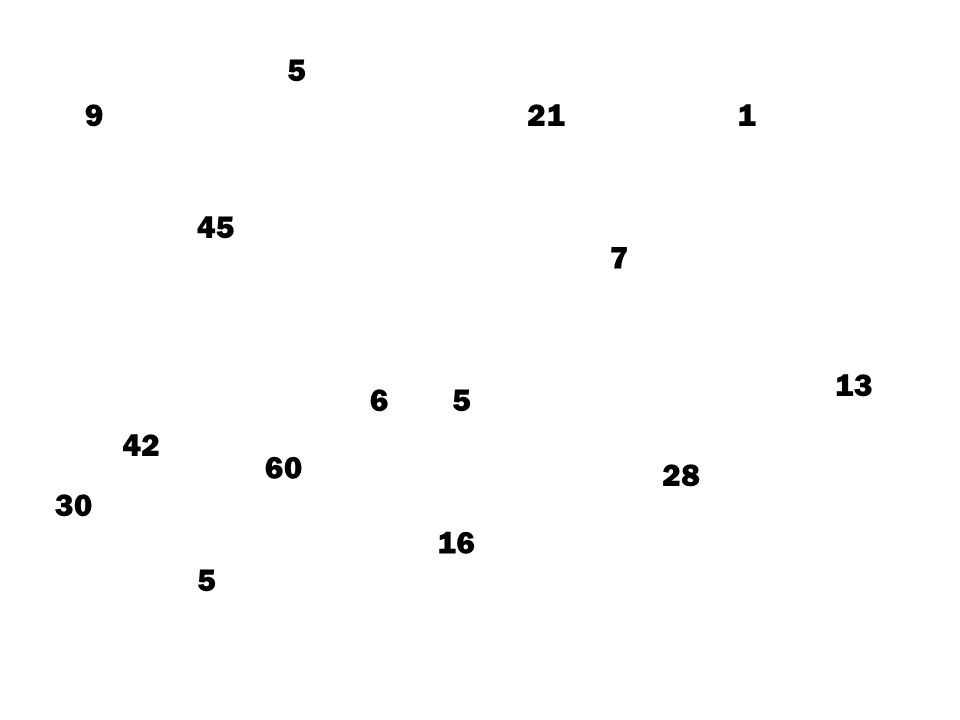
9 30 13 6 5 16 45 7 60 5 5 1 28 42 21 4/4/2010 Box and Whisker Plots Objective: Learn how to read and draw box and whisker plots Starter: Order these numbers and find the median, upper quartile and lower quartile.

2
9 30 13 6 5 16 45 7 60 5 5 1 28 42 21
3
45 1 st 2 nd 3 rd 4 th 5 th 6 th 7 th 8 th 9 th 10 th 11 th 12 th 13 th 14 th 15 th 9 30 136 5 16 760 5 5 1 2842 21 Interquartile Range = 42 – 5 =37

4
Highest value Upper Quartile Lower Quartile Median Lowest value 1 st 2 nd 3 rd 4 th 5 th 6 th 7 th 8 th 9 th 10 th 11 th 12 th 13 th 14 th 15 th 9 30 13 6 5 16 45760 5 5 1 28 42 21 1 5 10 15 20 25 30 35 40 45 50 55 60 65 70 75 80 85 90 95 100

5
Highest value Upper Quartile Lower Quartile Median Lowest value 1 st 2 nd 3 rd 4 th 5 th 6 th 7 th 8 th 9 th 10 th 11 th 12 th 13 th 14 th 15 th 9 30 13 6 5 16 45760 5 5 1 28 42 21 1 5 10 15 20 25 30 35 40 45 50 55 60 65 70 75 80 85 90 95 100

Similar presentations


