Download presentation
Presentation is loading. Please wait.

1
Collection Assessment Strategies in Context: Using Data to Inform the Shift from Print to Electronic Collections Library Assessment Conference, August 3, 2014 Anne C. Osterman, Virtual Library of Virginia Michael A. Matos, American University

2
“Collection assessment, at its best, is an art not a science, and the numbers that it generates are a means not an end.” – Jennifer Z. McClure, 2009

3
Agenda for Today General introduction Collection assessment approaches Planning for and designing an effective collection assessment project Navigating the available data Outside services and resources Tips and techniques for analyzing library data in common software packages Data Analysis Applying a visual approach to the presentation of results

4
GENERAL INTRODUCTION

5
Reasons for Collection Assessment Determine breadth and depth or strengths and weaknesses of a collection, or a specific subject in that collection, for accreditation or reporting to administration/funders Understand how users interact with and use the collection Understand relationship with other libraries, such as when planning for cooperative action Inform a weeding/move to storage/shifting project Analyze effectiveness of past budget allocations or inform new allocations

6
History Up until around the 1930s, collection assessment was largely about description. How many books does the collection have in which subjects? 1930s1950s1960s1980s 1970s2000s In the 1930s through the 1950s, list checking became an important approach. Does the collection have certain books? In the 1960s, studies about relevance to the population and usage emerged. How many of the books were actually used? Broader connections were made across collections in the 1970s, and qualitative methods became important. What books does that library have, and should mine have the same ones? The Conspectus emerged as an important tool in the 1980s and 1990s, merging quantitative with qualitative data and creating a shared vocabulary for collection strength. How strong is our philosophy collection – instructional support or research level? The growth of computing and the adoption of the Integrated Library System in the 1980s opened new possibilities for gathering data. I don’t want a sample – I want all the data. The growth of e-resources in the 1990s and 2000s changed the collections as well as the means and available data for collection assessment. Can the use of print books predict the use of e-books? 1990s2010s In the 2000s, LibQUAL+ emerged as a programmatic survey of user perception. How do our users perceive the collection, and what do they expect from it? In the 2010s, data mining has emerged as the next major step in assessment. What can the hidden patterns in our data tell us? 1990s

7
The Leading Edge of Data Analysis Data Warehousing and Marts Analytics Next-Gen ILS developments

8
Data Warehousing and Data Marts Conceptualized in the 1960s, data warehousing become popular with businesses in the 1990s A data warehouse is the holistic set of available data, both historical and current A data mart is a subsection of the data warehouse built for a particular reason or audience

9
Data Warehousing in Business Sales Data Customer Information Supply Chain Extraction Transformation and Loading Management Reports Data Mining External Data Data Warehousing

10
The Data Warehouse in the Library Context Circulation Data Acquisition Data JCR Data ILS Extraction and Data Warehousing ILS Extraction and Data Warehousing External Data Usage Stats Collections Assessment (Strength) Collection Assessment (Qualitative) Manual Data Merge Other Data Sources ERMS Use Data
 Collection Assessment (Qualitative) Manual Data Merge Other Data Sources ERMS Use Data")
11
Analytics Analytics processes and systems make extensive use of data, quantitative analysis, and explanatory and predictive models to drive and automate decisions and actions They can be connected to live sources of data as well as stored data. Data Warehouse Live Sources of Data Analytics

12
Analytics in the Field of Customer Interaction

13
Business Analytics as Applied to Higher Education

14
Next-Gen ILS Assessment Tool: Intota Assessment Available as a stand-alone product from the Intota library services platform Combines data that have traditionally been stored in separate silos, such as local usage, Books in Print, and Resources for College Libraries Focused on informing actions, such as collection evaluation and deselection From http://www.thedigitalshift.com/2013/11/ils/serials-solutions- launches-collection-analytics-tool-intota-assessment/

15
Next-Gen ILS Assessment Tool: OCLC’s Collection Evaluation Part of the WorldShare Management Services system Focused on monographic content Allows libraries to compare resources against 1 to 50 peer institutions, a variety of predefined groups, and authoritative lists from sources such as Choice, Booklist, Library Journal, and Publisher’s Weekly

16
Next-Gen ILS Assessment Tool: Alma Analytics Based on Oracle Business Intelligence Enterprise Edition Allows libraries to create reports that they can then share with other Alma libraries Includes physical format and electronic resource usage Can be integrated into a customized dashboard view that shows data trends Developing the ability to provide comparative analytics, such as from cross-institutional usage information

17
Next-Gen ILS Assessment Tool: Alma Analytics Image used with permission from Ex Libris.

18
Next-Gen ILS Assessment Tool: Alma Analytics Image used with permission from Ex Libris.

19
COLLECTION ASSESSMENT APPROACHES

20
Kinds of Collection Assessment Collection-based – “Collection-based techniques examine the size, growth, depth, breadth, variety, balance, and coverage of library materials – often against an external standard or the holdings of one or more libraries known to be comprehensive in the relevant subject area.” (Peggy Johnson, 2009) Use- and User-based – “Use- and user-based approaches look at who is using the materials, how often, and what their expectations are.” (Peggy Johnson, 2009)
 Use- and User-based – Use- and user-based approaches look at who is using the materials, how often, and what their expectations are. (Peggy Johnson, 2009)")
21
Collection-Based Assessment: Regardless of Format Collection profile Collection counts Materials budget allocations Citation analysis from external research or resources

22
Collection-Based Assessment: Focus on Print Checking against lists and bibliographies Scanning shelves Analyzing against collection standards Content overlap with peer/aspirational libraries

23
Collection-Based Assessment: Focus on Electronic Title overlap in packages Comparing content by acquisition model – subscription, DDA, perpetual access Comparison of databases/e-journal A to Z lists

24
Use- and User-Based Assessment: Regardless of Format Surveys of user opinion Focus groups Citation analysis from your population’s research and publications

25
Use- and User-Based Assessment: Focus on Print Circulation/in-house use studies Interlibrary loan/document delivery studies Anthropological studies of user behavior Gate counts

26
Use- and User-Based Assessment: Focus on Electronic Sessions, accesses/views, and downloads Percentages of collection/package used Use by acquisition model – subscription, DDA, perpetual access Turnaway reports When and where resources are used, how did the user link to the resource, how long did they stay in the resource Usability testing

27
Levels of Usage Borin and Yi (Collection Building 27:4) identify three levels of usage – access (web hits, database logins, gate counts, catalog searches) – use of collection (viewing/downloading/printing, circulation/reserves) – impact (student paper bibliographies, theses/dissertations, faculty publications)
 identify three levels of usage – access (web hits, database logins, gate counts, catalog searches) – use of collection (viewing/downloading/printing, circulation/reserves) – impact (student paper bibliographies, theses/dissertations, faculty publications)")
28
Differences between Print and Electronic Assessment Libraries are often dependent on the vendor for data for electronic resources Licensing, Digital Rights Management, platform, access, and other factors can be just as important as the digital content Much more granular tracking of use – by the chapter, by the article – is possible with electronic resources Circulation of print books vs. page views/chapter downloads/etc. of e-books are different expressions of use

29
Differences between Print and Electronic Assessment, cont. Electronic assessment can account for access denied/turnaways Access and holdings are much more complex in the electronic format – there is no central repository like WorldCat Open access is a factor There can be challenges with duplicate usage counts across databases on the same platform, particularly with broad searches enabled The content is sometimes not the same between print and electronic for the same title

30
Example: No Image in an Art Book

31
Project COUNTER Counting Online Usage of NeTworked Electronic Resources Tracks standard usage for electronic books, reference works, journals, databases, and now multimedia and articles

32
Selected Changes in COUNTER 4 The introduction of Record Views and Result Clicks as metrics for databases A requirement to define Section types for e- books A new report for multimedia resources such as audio, video, and images A set of new reports that enable usage of content on mobile devices to be reported separately

33
COUNTER’s Usage Factor New! A usage-based measure of impact, value, and status for a journal. The first registry will be published in 2016. Possible through the implementation of another new initiative, article-level COUNTER reports.

34
PLANNING FOR AND DESIGNING AN EFFECTIVE COLLECTION ASSESSMENT PROJECT

35
The Process Set Goals Identify Data Collect Data Review Data Select an Analysis Tool Analyze Data Format analysis results for distribution

36
General Principles Set clear goals from the beginning of the project – planning in the beginning saves time in the end. Although initial goals should be clear, allow for unexpected discovery. Become knowledgeable in all the available data you might use as well as the limitations of that data. Keep thinking context – trends over time, user population, budget changes. Keep the story in mind – how would you tell an administrator about your project?

37
Set Goals Carefully What would answer the question? Would the outcome be actionable? Is this a one-time report or should it be done regularly?

38
Start with Big Questions that You Care About Does the collection development approach make good use of the available budget? Is the collection meeting the user population’s needs? Does the collection make good use of the available space? Are your staffing levels correct for your collection and its formats?

39
Exercise One: Asking the Right Questions

40
Ex1: SWOT Analysis of Your Goals Strengths Weaknesses Opportunities Threats + - Internal External

41
NAVIGATING THE AVAILABLE DATA

42
Data Sources Library Systems (ILS, ERMS, Link Resolver) Vendors Library or Institution Website Institutional/User Population Statistics Lists/Bibliographies Scholarly Works
 Vendors Library or Institution Website Institutional/User Population Statistics Lists/Bibliographies Scholarly Works")
43
Item-Level Collection Data Format Serial or one-time Publication date Acquisition date Publisher Call number Price

44
Item-Level Use Data Print Last circulated date Circulation/renewal/in-house uses Electronic Section requests, page views, copies made, pages printed, PDF or HTML downloads Turnaways

45
Other User Behavior Data Database/catalog use (searches, sessions, result clicks, record views) Interlibrary loan data Entries into search boxes Systems used Origination of search OpenURL requests Gate counts
 Interlibrary loan data Entries into search boxes Systems used Origination of search OpenURL requests Gate counts")
46
User Characteristics Data Type of user On or off campus Time when using library or library resources What device they are using to access resources

47
User Preferences Data Surveys Focus Groups

48
Staffing Data Titles selected – By a person – Based on a profile – As a package Items and formats acquired Items and formats cataloged – Original – Copy Print books circulated E-resource troubleshooting questions asked

49
User Population Context Population supported Program size Degrees awarded Research dollars awarded

50
Standard-Based Comparisons Measure holdings against authoritative lists and rankings, such as Choice reviews, Publishers Weekly, Journal Citation Reports, Eigenfactor, altmetrics

51
Library-Based Comparisons With peer institutions With aspirational institutions Within or among consortia With preservation initiatives such as HathiTrust or Internet Archive

52
Summary Data Title counts Acquisition rates Annual expenditures Average circulations/uses Ratios of print to electronic or books to journals Percentage of available titles used Average age

53
Data in Context Cost – Per use – Per title – Per FTE Circulation/Use – By subject – Compared to the whole – Per user Volumes/Titles – By subject – Per user Material Expenditures – By subject

54
Data in Meaningful Groupings Groupings of numerical data – Publication date – Usage Low/Medium/High values

55
Data in Meaningful Groupings

56
Exercise Two: What Data Makes Sense?

57
Ex2: What Data Would be Helpful? Scenario One: What print volumes should you send to storage or weed?

58
Ex2: What Data Would be Helpful? Scenario Two: How can the use of your print collections inform future electronic purchases?

59
Ex2: What Data Would be Helpful? Scenario Three: Are your collections and budget allocations in line with the needs of the population they support?

60
OUTSIDE SERVICES AND RESOURCES

61
WorldCat Analysis: Holdings Analysis Compare your library’s collection with others by using volume counts per subject area Compare factors such as average date of publication among subclasses and classes Hard to overcome the great complexity of editions and formats, although FRBR helps Dependent on what libraries mark as their holdings in WorldCat Can provide a list of titles your library does not own

62
WorldCat Analysis: Title Count by Publication Year

63
WorldCat Analysis: Pre-Defined Comparisons

64
WorldCat Analysis: Comparison to WorldCat as a Whole

65
WorldCat Analysis: Title-Level Lists

66
Bowker’s Book Analysis System: Holdings Analysis Compares your library collection against Resources for College Libraries Works with data from your ILS, not WorldCat Relative percentages of subject areas can identify strengths and weaknesses Creates lists of “core” materials that your library doesn’t have

67
Library Analytics Toolkit Built through funding provided by the Harvard Library Innovation Lab Focused on better decision making through visualization Includes print and e-resource data Code for the Toolkit is freely and publicly available

68
Library Analytics Toolkit http://librarylab.law.harvard.edu/toolkit/

69
Jisc LAMP Project LAMP = Library Analytics and Metrics Project Developing a prototype, shared library analytics service for UK academic libraries Focused on combining data sets and displaying them in a meaningful way

70
Jisc LAMP Project http://jisclamp.mimas.ac.uk/

71
Sustainable Collection Services Guest speaker!

72
TIPS AND TECHNIQUES FOR ANALYZING LIBRARY DATA IN COMMON SOFTWARE PACKAGES

73
Cleaning Data with Excel Quality Control – Minimum, Maximum, Mean, Median Cleaning Data – Find and replace – Concatenate – Left, Right, Mid – Substitution – Deduplication Categorization and Matching – Vertical and Horizontal Look Ups – If Statements

74
CONCATENATE The CONCATENATE function joins up to 255 text characters into one text string. The joined items can be text, numbers, cell references, or a combination of those items. =CONCATENATE( Value to be concatenated, Item to be added, optional items [up to 255] ) =CONCATENATE(A2,“00”) Adds double zeros to the end of value in A2
 =CONCATENATE(A2, 00 ) Adds double zeros to the end of value in A2.")
75
LEFT, RIGHT, MID LEFT returns the first character or characters in a text string, based on the number of characters you specify. RIGHT returns the last character or characters in a text string, based on the number of characters you specify. MID returns a specific number of characters from a text string, starting at the position you specify, based on the number of characters you specify. =LEFT(A2,4) Returns the first four characters in A2 =RIGHT (B2,2) Returns the last two characters in B2 =MID(A2, 4, 2) Returns the two characters after the fourth character in A2 551519445 Example:
 Returns the first four characters in A2 =RIGHT (B2,2) Returns the last two characters in B2 =MID(A2, 4, 2) Returns the two characters after the fourth character in A Example:.")
76
SUBSTITUTE Substitutes new_text for old_text in a text string. Use SUBSTITUTE when you want to replace specific text in a text string; use REPLACE when you want to replace any text that occurs in a specific location in a text string. =SUBSTITUTE(A2, “H”, “R”) substitutes the letter R for the letter H in A2. NH1075.03NR1075.03
 substitutes the letter R for the letter H in A2. NH NR")
77
LOOKUPS 1.Allows you to search on one piece of data and return related data from a table 2.Can automate the search and return process 3.Can search for exact or approximate values 4.Works with text and numeric data

78
The syntax is as follows: =VLOOKUP(lookup value, table array, column index number, [range_lookup]) =VLOOKUP(“2161-5063”, B3:C9, 3, False) Table array: B3:C9 Column index number: 3 Range Lookup: False = Exact Value True = Approximate Value Answer: No, not in library holdings Lookup value: 2161-5063 VLOOKUP
![The syntax is as follows: =VLOOKUP(lookup value, table array, column index number, [range_lookup]) =VLOOKUP( , B3:C9, 3, False) Table array: B3:C9 Column index number: 3 Range Lookup: False = Exact Value True = Approximate Value Answer: No, not in library holdings Lookup value: VLOOKUP](http://images.slideplayer.com/10/2726362/slides/slide_78.jpg "The syntax is as follows: =VLOOKUP(lookup value, table array, column index number, [range_lookup]) =VLOOKUP( , B3:C9, 3, False) Table array: B3:C9 Column index number: 3 Range Lookup: False = Exact Value True = Approximate Value Answer: No, not in library holdings Lookup value: VLOOKUP")
79
The syntax is as follows: =HLOOKUP(lookup value, table array, row index number, [range_lookup]) =HLOOKUP(17, A1:E2, 2, TRUE) Table array: A1:E2 Row index number: 2 HLOOKUP Answer: Low book price level Lookup value: 17 Range Lookup: False = Exact Value True = Approximate Value
![The syntax is as follows: =HLOOKUP(lookup value, table array, row index number, [range_lookup]) =HLOOKUP(17, A1:E2, 2, TRUE) Table array: A1:E2 Row index number: 2 HLOOKUP Answer: Low book price level Lookup value: 17 Range Lookup: False = Exact Value True = Approximate Value](http://images.slideplayer.com/10/2726362/slides/slide_79.jpg "The syntax is as follows: =HLOOKUP(lookup value, table array, row index number, [range_lookup]) =HLOOKUP(17, A1:E2, 2, TRUE) Table array: A1:E2 Row index number: 2 HLOOKUP Answer: Low book price level Lookup value: 17 Range Lookup: False = Exact Value True = Approximate Value")
80
Exercise Three: Cleaning Data with Excel ISBNs LC Call Numbers Allocations

81
The Goal Use ISBN data from an ILS to give standardized publishers for the books in the report IMPRINT New York : Garland Pub., 1994. Englewood Cliffs, N.J. : Prentice Hall, c1988. Chicago : GIA Publications, c1997- New York : Random House, Inc., c2000- Thousand Oaks, Calif. : Sage Publications, c1995. Chicago : University of Chicago Press, 1987. Milwaukee, Wis. : American Chemical Society, Division of Chemical Education, Examinations Institute, c1998.

82
Brief Explanation: From the ISBN to the Publisher 0-00 through 0-19 represent particularly large publishers, because more numbers of the ISBN are left to distinguish individual books. This pattern continues through to 0-9500000 through 0-9999999, which represent much smaller publishers.

83
Brief Explanation: From the ISBN to the Publisher Using a listing of almost 116,000 publishers, the ISBN can be mapped to an individual publisher. 0195161467

84
Ex3: The goal: To clean and format the ISBN field so that it can be used to generate the publisher Open the Sample Circulation Data file. Sort the ISBN column from A to Z. Create a new column to the right of the ISBN column and call it ISBN Step One. For the ISBNs needing two leading zeroes added (rows 2 and 3), enter =CONCATENATE(“00”,A2) in the ISBN Step One column in the first relevant cell and drag the formula down to populate the other relevant cell. For the ISBNs needing one leading zero added (rows 4-24), use =CONCATENATE(“0”,A4). For the ISBNs with 13 digits (rows 25-32), remove the first three digits by using RIGHT(A25,10). For the ISBNs with 10 digits and unnecessary text after the numbers (rows 33-66), select only the ISBN using LEFT(A33,10). For the ISBN with 13 digits and unnecessary text after the numbers (row 67), select only the ISBN using MID(A67,4,10).
, enter =CONCATENATE( 00 ,A2) in the ISBN Step One column in the first relevant cell and drag the formula down to populate the other relevant cell. For the ISBNs needing one leading zero added (rows 4-24), use =CONCATENATE( 0 ,A4). For the ISBNs with 13 digits (rows 25-32), remove the first three digits by using RIGHT(A25,10). For the ISBNs with 10 digits and unnecessary text after the numbers (rows 33-66), select only the ISBN using LEFT(A33,10). For the ISBN with 13 digits and unnecessary text after the numbers (row 67), select only the ISBN using MID(A67,4,10)..")
85
Ex3: The goal: To clean and format the ISBN field so that it can be used to generate the publisher Create a new column to the right of the ISBN Step One column and call it ISBN Step Two. To put the letter O where the zeroes are, enter =SUBSTITUTE(B2,"0","O") in the ISBN Step Two column. Carry the formula down the column. Create a new column to the right of the ISBN Step Two column and call it ISBN Step Three. Copy the content from the ISBN Step Two column and paste it (values only, not formulas) into the new column.
 in the ISBN Step Two column. Carry the formula down the column. Create a new column to the right of the ISBN Step Two column and call it ISBN Step Three. Copy the content from the ISBN Step Two column and paste it (values only, not formulas) into the new column..")
86
Sidenote: Using a Macro to Tell Relevant Digits If the ISBN starts with OO or O1, this is a very large publisher, and you would use only the first three digits. In the macro, this becomes: If Left(MyCell, 1) = "O" And (Mid(MyCell, 2, 1) = "O" Or Mid(MyCell, 2, 1) = "1") Then MyCell = 3
 = O And (Mid(MyCell, 2, 1) = O Or Mid(MyCell, 2, 1) = 1 ) Then MyCell = 3.")
87
Ex3: The goal: To clean and format the ISBN field so that it can be used to generate the publisher Go to the View tab (Tools on Macs) and click on Macros. Select the ISBN2Publisher macro and click Run. Create a new column to the right of the ISBN Step Three column and call it Standardized Publisher. Enter the formula =VLOOKUP(LEFT(C2,D2),publist!$A$1:$B$116000,2,FAL SE) and carry it down the new column. This formula says to select the correct number of digits (column D) from the ISBN (column C) and look for that in the publisher worksheet. Do a quick check with the original Publisher column to see if the Standardized Publishers make sense.
,publist!$A$1:$B$116000,2,FAL SE) and carry it down the new column. This formula says to select the correct number of digits (column D) from the ISBN (column C) and look for that in the publisher worksheet. Do a quick check with the original Publisher column to see if the Standardized Publishers make sense..")
88
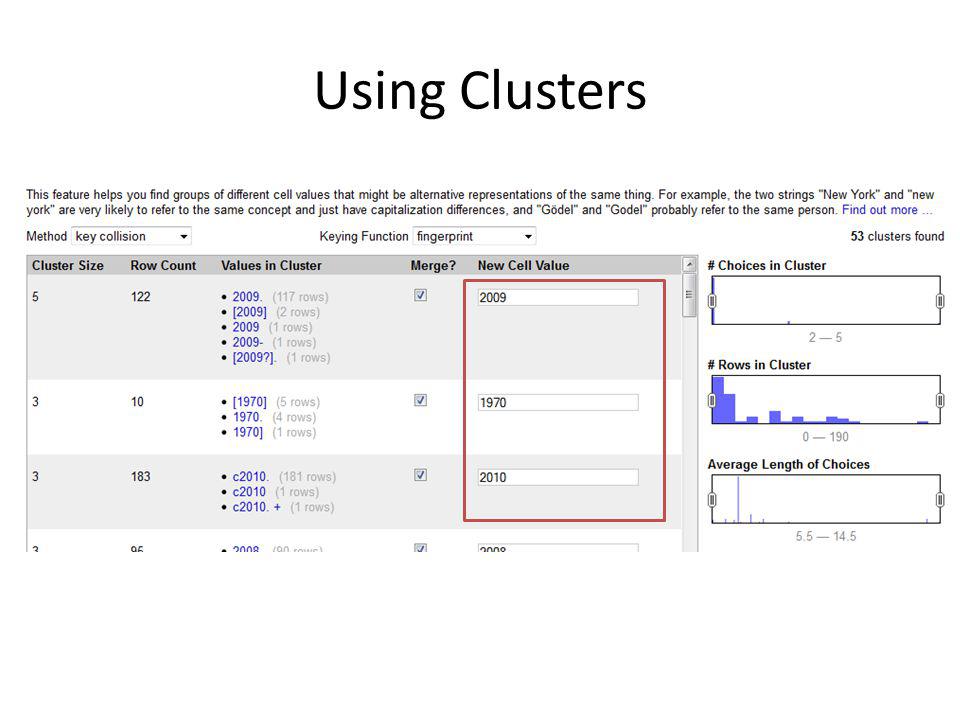
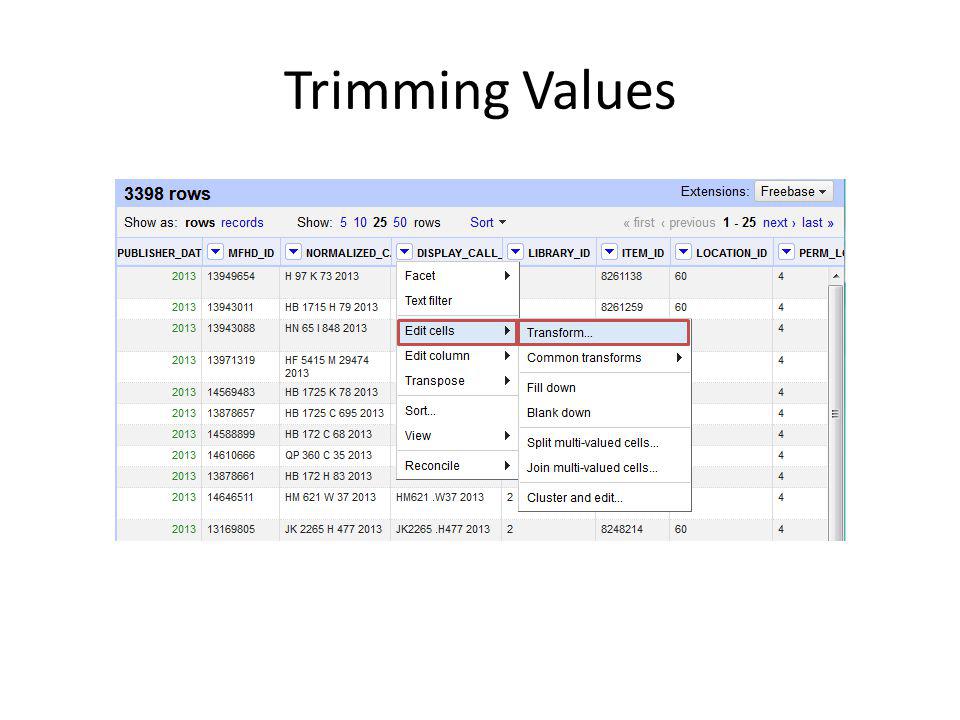
Cleaning Data with OpenRefine Formerly Google Refine Good for cleaning data – Uses facets – Easy to locate problem data – Allows complex transformations – Can cluster data for transformation Tracks all edits – can undo/redo at any point Can copy all edits and apply them to other data

89
Reserves Data in an Excel File

90
Import it into OpenRefine

91
Working with Text Facets

94
Using Clusters

100
Working with Numeric Facets

102
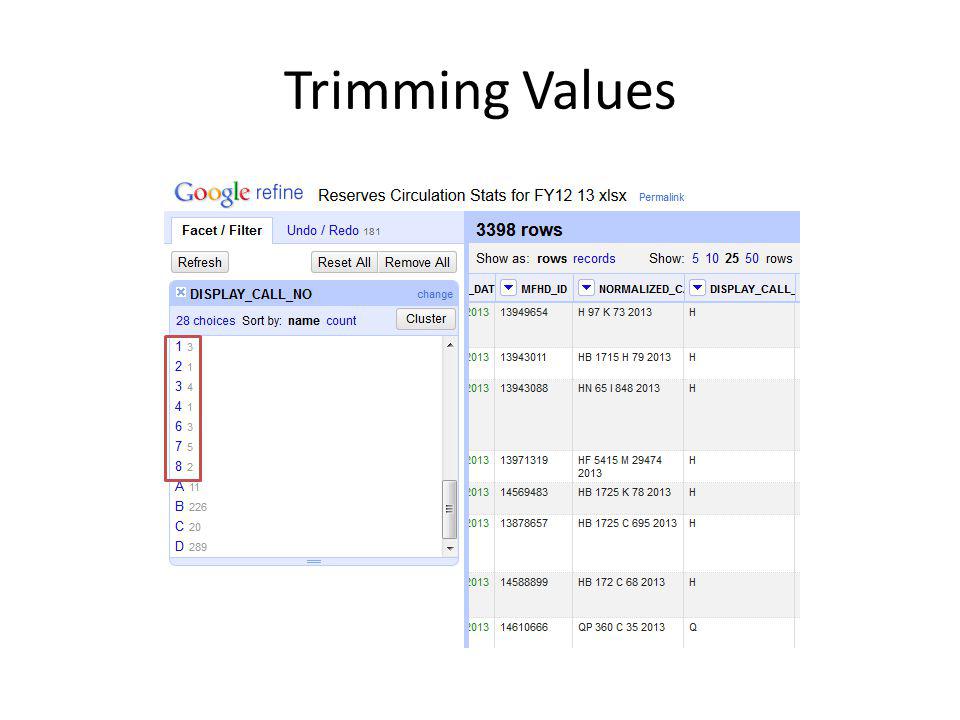
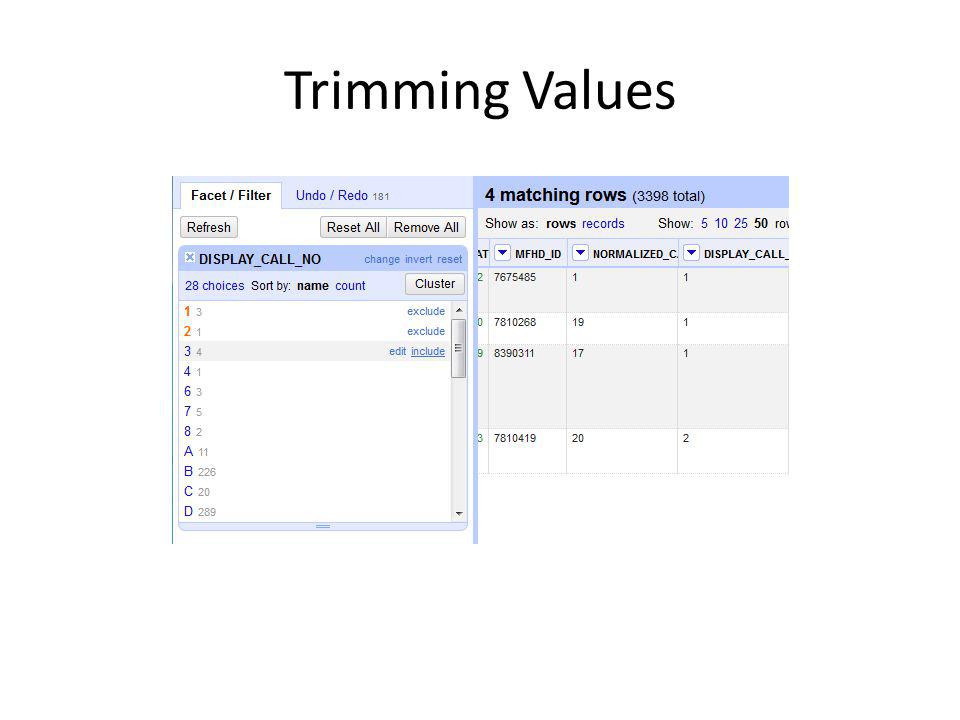
Trimming Values

111
History of Actions

113
Structuring, Summarizing, and Visualizing Data with Excel Structuring Data – Tables – Color Coding Summarizing Data – Pivot Tables Visualizing Data – Charts and Graphs

114
Conditional Formatting and Table View Conditional Formatting Increases the visibility of data based upon set parameters Format as a Table Lets one apply filters and sorting parameters to entire table Sorting Filtering

115
Takes data in a flat table and summarizes in a way that is much easier to read. Pivot Tables

116
Using Graphs for Analysis

117
Exercise Four: Structuring, Summarizing, and Visualizing Data with Excel

118
Ex4a: To look for trends of circulation by publisher Open the Sample Circulation Data_clean file. From the Home tab (Tables for Macs), click on Format as Table. Make sure it selects A1 through E619 as the data. Try out the table, selecting different filters. Return the data to all showing.
, click on Format as Table. Make sure it selects A1 through E619 as the data. Try out the table, selecting different filters. Return the data to all showing..")
119
Ex4a: To look for trends of circulation by publisher Select Column D, Total Circulation. Click on Conditional Formatting, then Highlight Cells Rules, then Greater Than.Put 100 in the cell value and click OK. Click the dropdown arrow at the top of Column D, Total Circulation, and select Sort by Color. Click on Conditional Formatting and select Clear Rules.

120
Ex4a: To look for trends of circulation by publisher Create a new worksheet in the file. Go to Insert (or Data for Macs) and select PivotTable. Click on the spreadsheet/arrow icon. Go back to the first sheet and select all the data. It will say Table1 in the box. Put Publisher in the Row Labels box and Total Circulations in the Values box. Change the circulations to Average Circulations with only two decimal points showing.
 and select PivotTable. Click on the spreadsheet/arrow icon. Go back to the first sheet and select all the data. It will say Table1 in the box. Put Publisher in the Row Labels box and Total Circulations in the Values box. Change the circulations to Average Circulations with only two decimal points showing..")
121
Ex4a: To look for trends of circulation by publisher Remove Publisher from Row Labels and replace it with Call Number Initial Letter. Click on the Insert (or Charts for Macs) tab and select a chart.
 tab and select a chart..")
122
Ex4b: Putting budget allocations in context Open the Program Analysis file. Select the data, go to Insert (or Data for Macs) and select PivotTable. The PivotTable will be created in a new sheet. Put Fiscal Year in the Row Labels box, Program in the Column Labels box, and Graduate Enrollment in the Values box. (It will say Sum – that is okay, since there is just one Program value per Fiscal Year.)
 and select PivotTable. The PivotTable will be created in a new sheet. Put Fiscal Year in the Row Labels box, Program in the Column Labels box, and Graduate Enrollment in the Values box. (It will say Sum – that is okay, since there is just one Program value per Fiscal Year.).")
123
Ex4b: Putting budget allocations in context Click on the Insert (or Charts for Macs) tab and select a line chart. Look at the data for each Enrollment and Print variable, one at a time, in the chart. How should the budget allocations be adjusted?

124
DATA ANALYSIS (STATISTICAL DEEP DIVE)
")
125
Analyzing Data with SPSS

126
Independent Samples T-Test Determines whether there is a statistically significant difference between the means in two unrelated groups. Requires one independent, nominal variable that has two categories (with no crossover between the two categories) and one dependent, interval/ratio variable.
 and one dependent, interval/ratio variable..")
127
ANOVA Generalizes the T-Test for three or more groups.

128
T-Tests and ANOVA: When Might You Use These? Determining if there is a statistically significant difference of: – Usage by patron group or subject area – Cost per use by title by subject area – What time library resources are being accessed by patron group – Cost per FTE by college using departmental information

129
T-Test and ANOVA Assumptions The observations are independent. The variances of the two groups you are measuring is approximately equal. The dependent variable is approximately normally distributed.

130
Normality: Issues with Skewed Data

131
Normality: Issues with Ordinal Data

132
Regression Examining the statistical relationship between one or more predictor variables and a single response variable, often focusing on a linear relationship

133
Regression: When Might You Use This? Assessing or creating a budget allocation formula Analyzing survey answers based on demographic responses Cross-library studies of collection size related to factors such as research dollars

134
Regression: A Few Tips Start simple and make the model more complex only if needed Have a reason for including each variable Don’t forget to test for interaction effects among your predictor variables

135
Regression: A Few Tips Look at scatter plots of each predictor variable with the response variable

136
Regression: A Few Tips Don’t forget to do diagnostics to evaluate the model – Plot the residuals, or observed errors, against the predictor variables and fitted values to make sure there are no visible patterns and to check for outliers – Look at a normal probability plot, histogram, or box plot of the residuals to check normality Remember that correlation is not causation

137
Summary, Context, and Visualization Basic arithmetic will take you far and might be all you need Simplicity in the analysis can help in simplicity in explaining the results Looking at the data in graphs and charts can be tremendously helpful

138
SPSS: Examining Shelf Life by Class HQ

140
SPSS: Examining Shelf Life by SubClass HF: Commerce HM: Sociology

141
APPLYING A VISUAL APPROACH TO THE PRESENTATION OF RESULTS

142
Edward Tufte Retired Yale Professor of Political Science and Computer Science. Has written extensively on visualizing data. Here are some of his key concepts: Data-Ink Ratio: Avoid extensive use of graphics in developing a data illustration Data density: A data graphic should be data rich Lie Factor: the relation between the size of effect shown in a graphic and the size of effect shown in the data Chartjunk: An image that has little informational value (think pie charts without percentages)
.")
143
“May well be the greatest statistical graphic ever drawn” – Edward Tufte Carte figurative des pertes successives en hommes de l'Armée Française dans la campagne de Russie 1812-1813 Charles Joseph Minard, 1869

144
Don’t be afraid to be complex Provide your audience with range of variables you looked at in making a decision Copyright: Edward Tufte, 2007

145
Draw the Eye to the Key Point Chart from “Telling Your Library’s Story: How to Make the Most of Your Data in a Presentation” by Anne C. Elguindi and Bill Mayer in Library Data: Empowering Practice and Persuasion, ed. by Darby Orcutt, ABC-CLIO, 2010.

146
Use Arrows to Show Motion Chart from “Telling Your Library’s Story.”

147
Use Shapes in Interesting Ways Chart from “Telling Your Library’s Story.”

148
Try Going Without a Graph Chart from “Telling Your Library’s Story.”

149
Data Visualization Software Rather than creating static reports, data visualization software programs, like Tableau and Socrata, allow one to create a customizable data objects.

150
QUESTIONS?

Similar presentations


 Kentaka Aruga.>")
 is a computer program used to enter, analyze, and present quantitative.>")


 and (flu or influenz*) Enter your terms to be searched. Search fields are.>")
151 231 2284 CMPDLLM002 Research Methods Lecture 9: Quantitative.>")