Download presentation
Presentation is loading. Please wait.

1
Fossil Biodiversity Distribution as a Habitat Mapping Tool Erin Arnold Antarctic CRC/IASOS

2
Introduction Quantifying and qualifying variability in the pelagic ocean, though space and time Exploring biodiversity of Recent fossil planktonic foraminifera: both global distribution and temporal patterns Advantages of foraminifera –Widely distributed, global taxonomy, well preserved in the sedimentary records

3
Diversity Indices describe how individuals in a sample are distributed among the species 3 diversity measurements –Species richness (S, simple number of species) –2 diversity indices (Shannon Index, Evenness)
 –2 diversity indices (Shannon Index, Evenness)")
4
Diversity Advantages of method: –Species independent –Describe and compare between both ancient and modern systems –Describe and compare between different taxonomic groups

5
Spatial Patterns Diversity of fossil forams from coretop records calculated for points distributed over world’s oceans Exploring the response of community structure (dominance and evenness) to habitat change
 to habitat change")
6
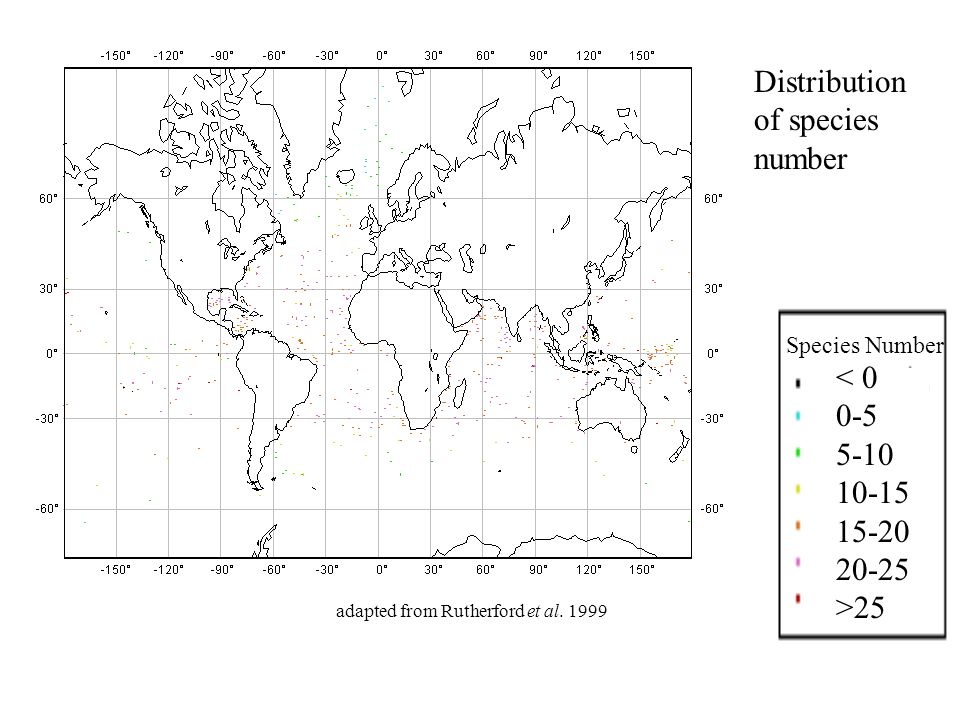
Distribution of species number Species Number < 0 0-5 5-10 10-15 15-20 20-25 >25 adapted from Rutherford et al. 1999
7
Distribution of Shannon Index <0 0-0.5 0.5-1 1-1.5 1.5-2 2-2.5 >2.5 Shannon Index Arnold 2002

8
Distribution of Equitability <0 0-0.2 0.2-0.4 0.4-0.6 0.6-0.8 0.8-1 >1 Arnold 2002

9
R=0.335 R=0.500 R=0.618 Species Number Shannon Index Equitability

10
Temporal Variability Exploring the temporal variability of the pelagic habitat over a timescale of a half million years Subantarctic Front Polar Front Subtropical Front

11
Temporal Variability Rates of change in diversity calculated to determine periods of high variability d Diversity/ d time Absolute values show total magnitude of change The relation between biodiversity and habitat change through time was explored by comparing rates of diversity and oxygen isotope ratios

12
Oxygen Isotope Ratios Species Number Shannon Index Equitability

15
Conclusions Planktonic habitat sensitive to rapid climate change Rapidly fluctuating diversity during orbitally driven transition periods Diversity is sensitive to habitat, as defined by SST Diversity as a habitat mapping tool can be applied to modern and ancient ecosystems, and to different plankton groups

Similar presentations


 c and z are fitting parameters.>")


 (distrib. of indiv. among taxa)>")


 Students know different kinds of organisms.>")
