Download presentation
Presentation is loading. Please wait.

1
www.tie.net 1 Barb Rowenhorst Janet Hensley PASS October 28, 2010

2
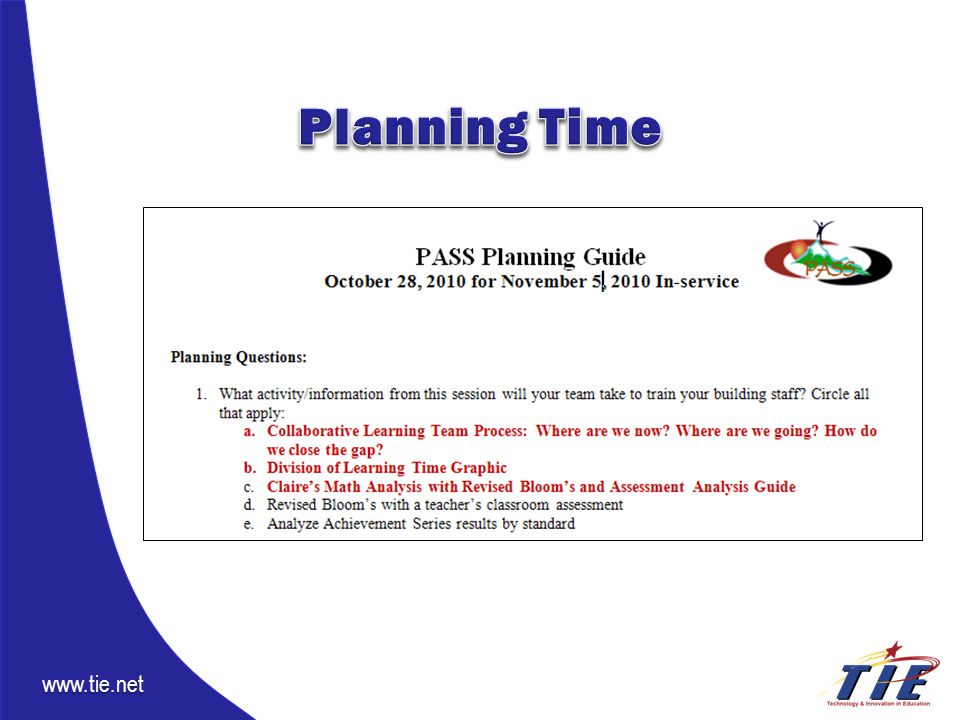
www.tie.net Assess learning teams in regard to “Where are we now? Where are we going? How do we close the gap?” Analyze assessments using the revised Bloom’s Taxonomy and the learning team process. Align the level of rigor and cognitive complexity among indicators, assessment and instruction. Utilize Achievement Series results to improve instruction and student achievement.

3
www.tie.net Review the chart “Division of Learning Time”

4
www.tie.net

5
www.tie.net

6
www.tie.net September 2006 Rating continuum on pieces of student work (sticky notes) November 2006 Protocol #1 –student work March 2006 (2 sessions) Protocol #2 – class work October 2007 Achievement Series – assessment & student work January 2009 Formative Assessment – Involving students Data Retreats - Ongoing
 November 2006 Protocol #1 –student work March 2006 (2 sessions) Protocol #2 – class work October 2007 Achievement Series – assessment & student work January 2009 Formative Assessment – Involving students Data Retreats - Ongoing")
7
www.tie.net Laminated Sheet

8
www.tie.net

9
www.tie.net

10
www.tie.net 3.G.1.1 Shapes Factual Knowledge / Remember A1 3.A.2.2 Problem-Solving Procedural / Apply C3 Factual Knowledge / Remember A1 3.N.2.1 Multiply 3.N.1.3 Fractions Conceptual / Remember B1 ?

11
www.tie.net

12
www.tie.net What strategies might the “Learning Team” suggest to Claire’s teacher to try in the classroom prior to the next learning team meeting?

13
www.tie.net Practice analyzing a student’s assessment work based on the assessment you brought with you to analyze as a team.

14
www.tie.net

15
www.tie.net What might be some obstacles to discussing Rigor and using Bloom’s in learning teams? (in our control) What might be some solutions to the obstacles? ObstaclesSolutions
 What might be some solutions to the obstacles. ObstaclesSolutions.")
16
www.tie.net Divide into teams. Stand by a chart with your team. Brainstorm all the things you might be able to do to help solve the obstacle listed. When signal is given, move to the next chart, read the solutions, write additional solutions. (Marker moves with your team) Continue until your team has written on each chart
 Continue until your team has written on each chart.")
17
www.tie.net Data: the end product of teaching Teacher collaboration Essential professional development through reflection Accountability Standards-based educational reforms Conditions in classrooms Lack of alignment to standards Work expected is not at proficient level Work produced is not at proficient level Basic work is accepted as proficient Are you teaching what you are assessing?

18
www.tie.net

19
www.tie.net

20
www.tie.net

21
www.tie.net The Reports www.achievementseries.com 21

22
www.tie.net

23
www.tie.net

24
www.tie.net Meade Rural Schools (361-770-4373) Stagebarn Elementary (290-125-9510) Sturgis Academy (289-132-2490) Sturgis Elementary (920-314-1497) Sturgis High School (322-779-7389) Whitewood Elementary (870-355-3546) Williams Middle School (347-188-0588)
 Stagebarn Elementary ( ) Sturgis Academy ( ) Sturgis Elementary ( ) Sturgis High School ( ) Whitewood Elementary ( ) Williams Middle School ( )")
25
25 1 st Click on the Classroom Tab 2 nd Click on the District Gradebook

26
26 Find a teacher from your focus grade level

27
27

29
Student

30
www.tie.net

32
www.tie.net Find the Indicator/Standard on the Achievement Series that is the lowest for your class. Review the results on the AS site. Complete the Data Discussion handout based on your AS results.

33
www.tie.net Work Time

34
www.tie.net
Similar presentations


>")


: A Focus on Formative Assessment Dr. Jennifer Lillenstein, Educational Consultant Pennsylvania.>")


