Download presentation
Presentation is loading. Please wait.

1
Reliability Modelling for Business Decisions

2
Introduction Definitions Modelling overview Modelling construction Event graph Results Business Decisions - Questions answered

3
Reliability The ability of a system or component to perform its required functions under stated conditions for a specified period of time 1. 1. Blanchard, Benjamin S. (1992), Logistics Engineering and Management (Fourth Ed.), Prentice-Hall, Inc., Englewood Cliffs, New Jersey.
, Logistics Engineering and Management (Fourth Ed.), Prentice-Hall, Inc., Englewood Cliffs, New Jersey..")
4
Maintainability The measure of the ability of an item to be retained in or restored to specified condition when maintenance is performed during the course of a specified mission profile (The mission-related system maintainability parameter.) 1 1. MIL-STD-721

5
Availability A measure of the degree of a system which is in the operable and committable state at the start of mission when the mission is called for at an unknown random point in time 1. 1. MIL-STD-721

6
Availability Inherent availability, A i Achieved availability, A a Operational availability, A o 1. MIL-STD-721

7
Modelling and Simulation AvailabilityCostMaintenanceConfiguration

8
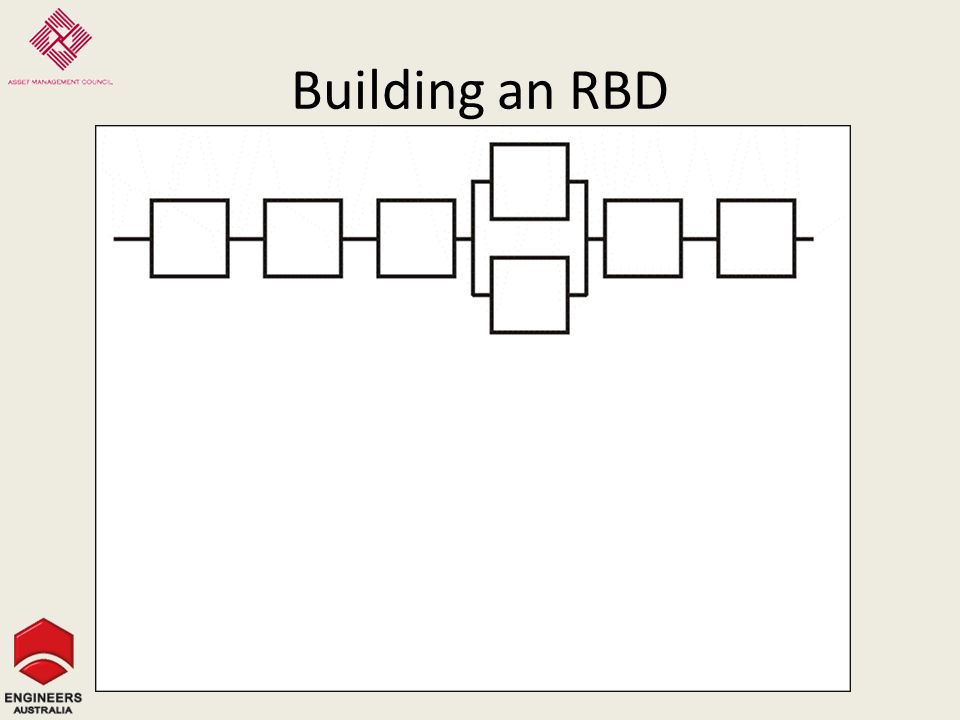
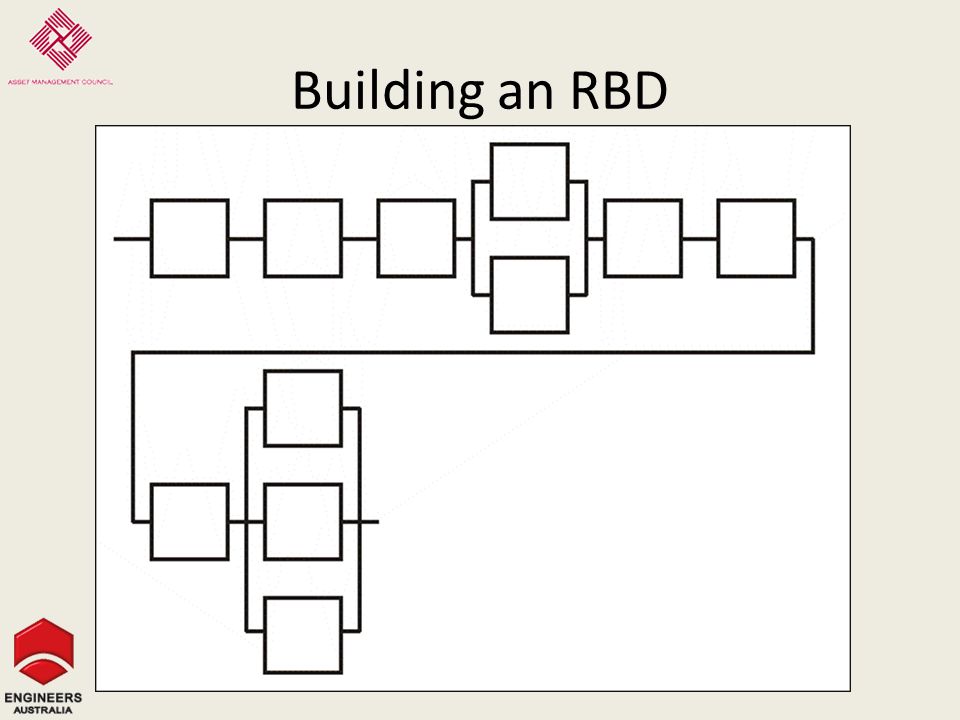
Availability Simulation How is a model built? It is built to represent the reliability and maintainability relationships between the items using RBDs Data sources are from engineering drawings and workshops with appropriate people What data is needed?

9
Building an RBD

21
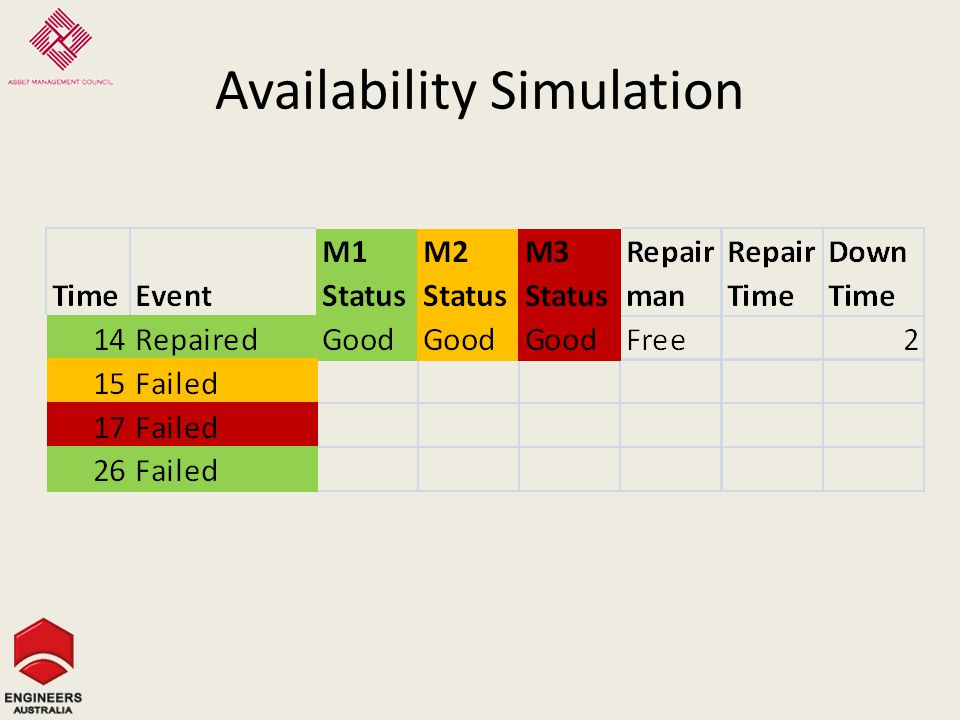
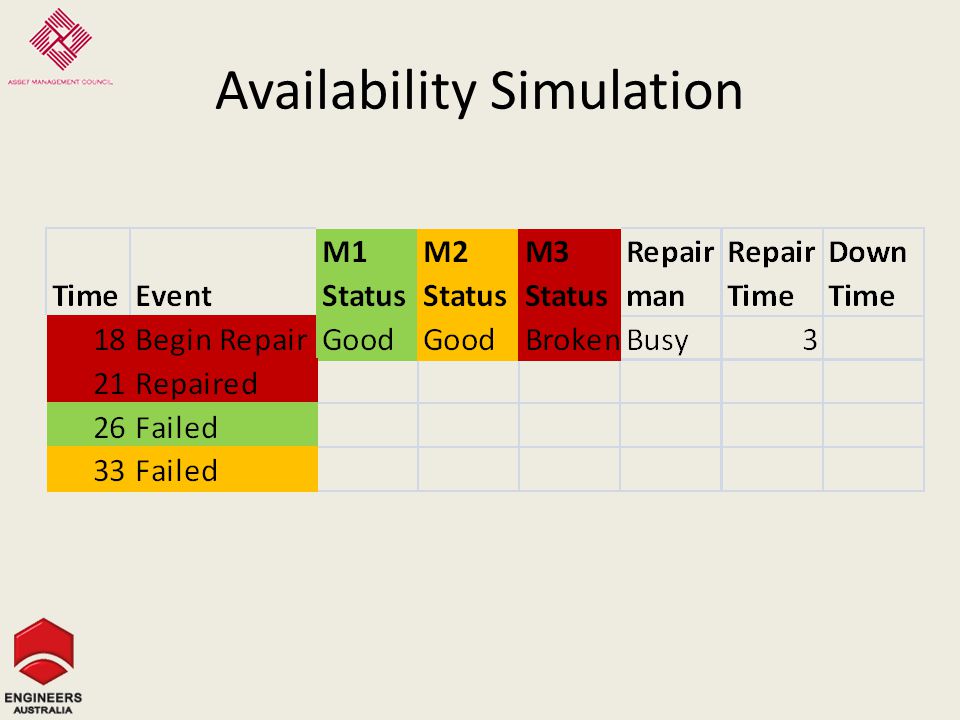
Availability Simulation M1 M2 M3

22
Availability Simulation 3 59 45 64 89 51 34 5 78 4 45 76 53 7 48 8 68 9 56 8

23
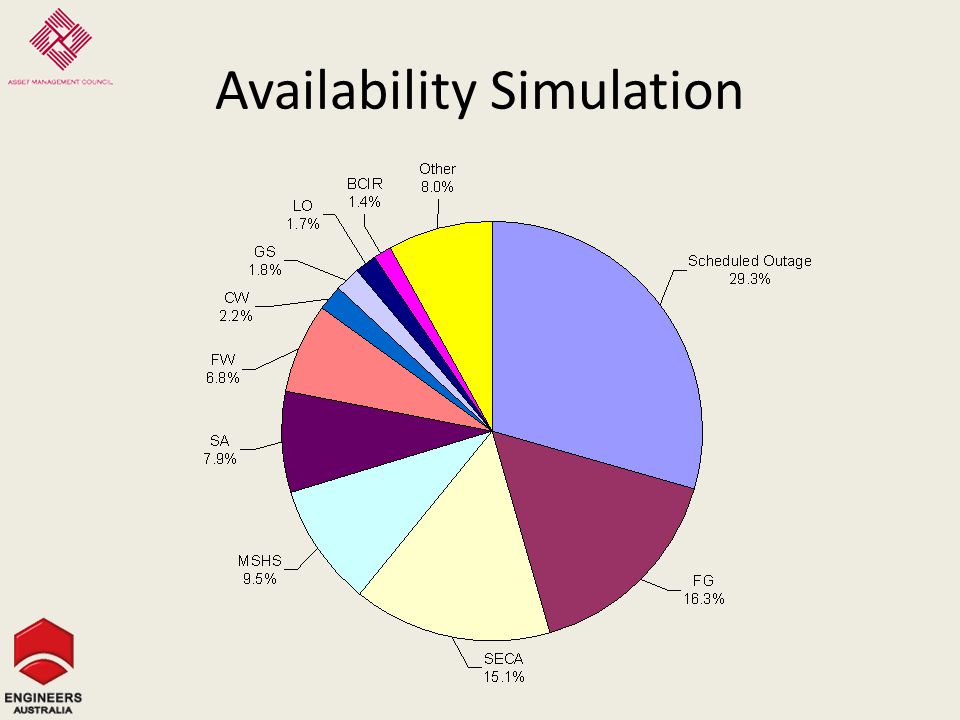
Availability Simulation

34
EG

35
Availability Simulation

38
Availability M1 – 92% Availability M2 – 88% Availability M3 – 83% Repair man Utilisation 33% Plant Availability 88%

39
Questions How many spares used? Which machine caused the most downtime? Are two repairmen required? What about levels of repair? Pro active versus reactive? How is logistic support allowed for?

40
Questions Where and when is modelling used? – During design to meet requirements and gain financial sign off – During operating phase to determine maintenance and other support tactics – During end of life to determine disposal time and strategy

Similar presentations


 Motion Controller Design for A Class of Second-order Systems Center for Self-Organizing Intelligent.>")

How the components are functional.>")


