Download presentation
Presentation is loading. Please wait.

1
Everglades West Coast Total Maximum Daily Load (TMDL) Reports (Dissolved Oxygen) 2008
 Reports (Dissolved Oxygen) 2008")
2
Dissolved Oxygen* TMDLs Completed this Year (2008) Highest Priority to 1998 303D List Hendry Creek (WBID 3258B) & Hendry Creek Marine (WBID 3258B1) DO TMDL David Tyler and Kyeongsik Rhew Imperial River (WBID 3258E) DO TMDL Kristina Laskis, Nathan Bailey, and Rob McTear Gordon River Extension DO TMDL(3278K) Nathan Bailey *Note: Dissolved Oxygen TMDLs Typically Focus on Reduction of causative pollutants TN, TP, and/or BOD
 Highest Priority to D List Hendry Creek (WBID 3258B) & Hendry Creek Marine (WBID 3258B1) DO TMDL David Tyler and Kyeongsik Rhew Imperial River (WBID 3258E) DO TMDL Kristina Laskis, Nathan Bailey, and Rob McTear Gordon River Extension DO TMDL(3278K) Nathan Bailey *Note: Dissolved Oxygen TMDLs Typically Focus on Reduction of causative pollutants TN, TP, and/or BOD")
3
Hendry Creek Marine: 6,920 acre WBID Hendry Creek: 533 acre WBID Imperial River: 5,873 acre WBID Gordon River Extension: 5,154 acre WBID Lee County Collier County Approx. 6 miles long

4
Land Use Overview Landuse Description Hendry 3258B Hendry M 3258B1 Imperial 3258E Gordon 3278K Acres% % % % Urban and Built up 336 63 1,730 25 1,884 32 3,602 70 Agriculture * * 267 4 187 3 57 1 Rangeland 17 3 267 4 511 9 193 4 Upland Forests 83 16 1,056 15 393 7 453 9 Water 12 2 531 8 232 4 194 4 Wetland 39 7 2,949 43 2,452 42 48 9 Barren Land * * 19 0 54 1 22 0 Transportation, Communication, & Utilities 45 9 98 1 158 3 147 3 Total 533 100 6,920 100 5,873 100 5,154 100

5
WBID: Hendry Creek Imperial River Gordon River Extension Hendry Creek Marine Class. 3F3M DO Dissolved Oxygen shall not be less than 5 mg/L; this includes normal daily and seasonal fluctuations. Shall not average less than 5.0 mg/L in a 24-hour period and shall never be less than 4.0 mg/L. Normal daily and seasonal fluctuations above these levels shall be maintained. BOD Shall not be increased to exceed values which would cause dissolved oxygen to be depressed below the limit established for each class and, in no case, shall it be great enough to produce nuisance conditions. Nutrients In no case shall nutrient concentrations of a body of water be altered so as to cause an imbalance in natural populations of aquatic flora or fauna [Note: For Class III waters in the Everglades Protection Area, this criterion has been numerically interpreted for phosphorus in Section 62-302.540, F.A.C.].

6
Assessment of TMDL Streams for DO Waterbody Total # of Samples IWR Required Exceedances for impairment Total Number of Exceedances (and %) Conclusion Hendry Creek Marine 39734 (87%) Impaired Hendry Creek 591031 (53%) Impaired Gordon River Extension 721270 (97%) Impaired Imperial River 991577 (78%) Impaired
 Conclusion Hendry Creek Marine (87%) Impaired Hendry Creek (53%) Impaired Gordon River Extension (97%) Impaired Imperial River (78%) Impaired")
7
Developing Nutrient Criteria for Rivers and Streams (EPA’s Technical Guidance Manual) Two ways of Establishing a Reference Condition Method 1 Choose the upper 25th percentile (75th percentile) of a reference population of streams. This is the preferred method to establish a reference condition. The 75th percentile was chosen by EPA since it is likely associated with minimally impacted conditions, will be protective of designated uses, and provides management flexibility.

8
Developing Nutrient Criteria for Rivers and Streams (EPA’s Technical Guidance Manual) Two ways of Establishing a Reference Condition Method 2 When reference streams are not identified, the second method is to determine the lower 25th percentile of the population of all streams within a region. The 25th percentile of the entire population was chosen by EPA to represent a surrogate for an actual reference population. (Data analyses to date indicate that the lower 25th percentile from an entire population roughly approximates the 75th percentile for a reference population) References: NYSDEC (New York State Department of Environment and Conservation). 2000. Memorandum from Scott Kishbaugh to Jay Bloomfield, September 26, 2000, regarding reference lakes for nutrient criteria. TNDEC (Tennessee Department of Environment and Conservation). 2000. Letter to Geoff Grubbs, October 5, 2000, containing comments on draft nutrient criteria recommendations. U.S. EPA. 2000a. Nutrient Criteria Technical Guidance Manual: Lakes and Reservoirs, U.S. Environmental Protection Agency, Washington, DC. EPA-822-B00-001. U.S. EPA. 2000b. Nutrient Criteria Technical Guidance Manual: Rivers and Streams, U.S. Environmental Protection Agency, Washington, DC. EPA-822-B00-002.
 References: NYSDEC (New York State Department of Environment and Conservation) Memorandum from Scott Kishbaugh to Jay Bloomfield, September 26, 2000, regarding reference lakes for nutrient criteria. TNDEC (Tennessee Department of Environment and Conservation) Letter to Geoff Grubbs, October 5, 2000, containing comments on draft nutrient criteria recommendations. U.S. EPA. 2000a. Nutrient Criteria Technical Guidance Manual: Lakes and Reservoirs, U.S. Environmental Protection Agency, Washington, DC. EPA-822-B U.S. EPA. 2000b. Nutrient Criteria Technical Guidance Manual: Rivers and Streams, U.S. Environmental Protection Agency, Washington, DC. EPA-822-B")
9
Criteria for “Reference” Waterbodies Waterbody in Everglades West Coast in Region of Impaired Waterbody of Same Class as Impaired Waterbody has “Not Impaired” status for DO If there are no bodies meeting No. 3, Waterbody, has “Not Impaired” status for Chl_a Whether using 3 or 4, waterbody cannot have annual average Chl_a above 6.0 ug/L

10
FDEP’s Reference Approach in Everglades West Coast FOR ‘SWIMMABLE-FISHABLE’ FRESH WATER WBIDS (3F) Utilize Method 1 for the Fresh Water Streams where there are more WBIDs which satisfy all pre-determined high criteria for Reference Stream (Consistent with Method 1, we use the 75 Percentile level as the reference condition.) FOR ‘SWIMMABLE-FISHABLE’ MARINE WBID (3M) Utilize a More Conservative Modification of Method 1 because there are no WBIDs completely meeting Reference Criteria, but there is a nearby area (WBID 3258A) that satisfies most pre-determined criteria for Reference. The main divergence is that 3258A has urban-built-up above 10%. (Thus for MARINE WBID (3M) we will use the Median of the Reference waterbody as the reference condition).
 we will use the Median of the Reference waterbody as the reference condition)..")
11
Hendry Creek Marine & Estero Bay Wetland (Reference WBID)
")
12
Imperial River, Gordon River Extension & Reference WBIDs

13
WBID Parameter of Concern Number of Samples Median Concentration (mg/L) During Verified Period Local Reference Concentration (mg/L) 75 th Percentile (3F) Median (3M) Imperial River BOD5 881.2 1.85 TN 980.940.76 TP 780.039 0.04 Gordon River Exten- sion BOD5 172 1.85 TN 600.890.76 TP 660.070.04 Hendry Creek BOD5 291.5 1.85 TN 300.780.76 TP 290.03 0.04 Hendry Creek Marine BOD5 671.3 TN 670.890.6 TP 480.0535 0.057
 During Verified Period Local Reference Concentration (mg/L) 75 th Percentile (3F) Median (3M) Imperial River BOD TN TP Gordon River Exten- sion BOD TN TP Hendry Creek BOD TN TP Hendry Creek Marine BOD TN TP")
14
Subsequent Efforts to identify Causative Pollutants involve looking at relationships between DO and Potential Causative

15
Freshwater Stations > 20 Observations

16
Marine Stations with more than 24 Observations

17
Fresh Water Stream Sample Station in Estero Bay Median TN Concentrations during Verified Period

18
Hendry Creek & Hendry Creek Marine Sample Stations

19
Imperial River Sample Stations

20
Gordon River Extension Sample Stations

21
Percent Reduction = [Measured Exceedance – TN Target] * 100 Measured Exceedance Percent Reduction for Total Nitrogen Sample DateStation Observed TN Value (mg/L) Target Concentration (mg/L) % Reduction 1/13/2000 21FLEECOHENDG R11 0.980.6434.69 2/15/2000 21FLEECOHENDG R20 0.730.6412.33 3/21/2000 21FLEECOHENDG R11 1.020.6437.25 3/21/2000 21FLEECOHENDG R20 0.850.6424.71 4/20/2000 21FLEECOHENDG R11 1.350.6452.59 4/20/2000 21FLEECOHENDG R20 0.740.6413.51 7/27/2000 21FLEECOHENDG R11 1.40.6454.29 8/22/2000 21FLEECOHENDG R11 1.110.6442.34 9/7/2000 21FLEECOHENDG R11 1.060.6439.62 9/7/2000 21FLEECOHENDG R20 0.830.6422.89 Final Percent Reduction is Median of Percent Reductions for all samples collected during Verified Period etc.
![Percent Reduction = [Measured Exceedance – TN Target] * 100 Measured Exceedance Percent Reduction for Total Nitrogen Sample DateStation Observed TN Value (mg/L) Target Concentration (mg/L) % Reduction 1/13/ FLEECOHENDG R /15/ FLEECOHENDG R /21/ FLEECOHENDG R /21/ FLEECOHENDG R /20/ FLEECOHENDG R /20/ FLEECOHENDG R /27/ FLEECOHENDG R /22/ FLEECOHENDG R /7/ FLEECOHENDG R /7/ FLEECOHENDG R Final Percent Reduction is Median of Percent Reductions for all samples collected during Verified Period etc.](http://images.slideplayer.com/9/2551091/slides/slide_21.jpg "Percent Reduction = [Measured Exceedance – TN Target] * 100 Measured Exceedance Percent Reduction for Total Nitrogen Sample DateStation Observed TN Value (mg/L) Target Concentration (mg/L) % Reduction 1/13/ FLEECOHENDG R /15/ FLEECOHENDG R /21/ FLEECOHENDG R /21/ FLEECOHENDG R /20/ FLEECOHENDG R /20/ FLEECOHENDG R /27/ FLEECOHENDG R /22/ FLEECOHENDG R /7/ FLEECOHENDG R /7/ FLEECOHENDG R Final Percent Reduction is Median of Percent Reductions for all samples collected during Verified Period etc.")
22
TMDL WLAs Wastewater + WLAs NPDES Stormwater + LAs + MOS WBID TMDL Total Nitrogen (mg/L) WLALA Reduction MOS Wastewater (lbs/year) NPDES Stormwater (Percent Reduction) Imperial River 0.76 N/A22 % Implicit Gordon River Extension 0.76 N/A29 % Implicit Hendry Creek *0.6 N/A* 44% Implicit Hendry Creek Marine 0.6 N/A44 % Implicit Maximum Daily Loads for Total Nitrogen for the DO Impaired WBIDs (based on Reference 75th Percentile) * Required to protect downstream marine segment
 WLALA Reduction MOS Wastewater (lbs/year) NPDES Stormwater (Percent Reduction) Imperial River 0.76 N/A22 % Implicit Gordon River Extension 0.76 N/A29 % Implicit Hendry Creek *0.6 N/A* 44% Implicit Hendry Creek Marine 0.6 N/A44 % Implicit Maximum Daily Loads for Total Nitrogen for the DO Impaired WBIDs (based on Reference 75th Percentile) * Required to protect downstream marine segment")
23
Recommendations Commence collection of stream flow data on Hendry Creek Marine, Imperial River, and the Gordon River Extension throughout the dry and wet seasons. Increase water quality sampling in those stations where there are higher concentrations. Utilize water quality computer models to simulate the watershed hydrology to increase understanding of the factors contributing to impairment conditions. Sample ground water quality and monitor ground water contribution to stream flow. It is recommended that the following activities occur to advance the goals of the TMDLs described;

24
Pat Fricano Nathan Bailey Bureau of Watershed Management Bureau of Watershed Management Watershed Planning and Coordination Watershed Assessment Section (850) 245 - 8559 (850) 245 - 8465 Pat.Fricano@dep.state.fl.us Nathaniel.Bailey@dep.state.fl.us MORE INFORMATION FDEP Websites: TMDL Program Website: http://www.dep.state.fl.us/water/tmdl/index.htm Basins 411 Website: http://www.floridadep.org/water/basin411/default.htm Florida Department of Environmental Protection David Tyler Kyeongsik Rhew Bureau of Watershed Management Bureau of Watershed Management Watershed Assessment Section Watershed Assessment Section (850) 245 - 8559 (850) 245 - 8465 David.Tyler@dep.state.fl.us Kyeongsik.Rhew@dep.state.fl.us Kristina Laskis Jan Mandrup-Poulsen Bureau of Watershed Management Bureau of Watershed Management Watershed Assessment Section Watershed Assessment Section (850) 245 - 8559 (850) 245 - 8465 Kristina.Laskis@dep.state.fl.us Jan.Mandrup-Poulsen@dep.state.fl.us
 (850) MORE INFORMATION FDEP Websites: TMDL Program Website: Basins 411 Website: Florida Department of Environmental Protection David Tyler Kyeongsik Rhew Bureau of Watershed Management Bureau of Watershed Management Watershed Assessment Section Watershed Assessment Section (850) (850) Kristina Laskis Jan Mandrup-Poulsen Bureau of Watershed Management Bureau of Watershed Management Watershed Assessment Section Watershed Assessment Section (850) (850)")
25
PUBLIC COMMENTS

26
The Everglades West Coast Basin Extends North from Everglades National Park to southern edge of the Caloosahatchee River Basin. Extends East from the Gulf of Mexico to the western edge of Dade and Broward Counties. Includes southern Lee and Hendry Counties, all of Collier County, and very small portions of western Dade, Broward, and northern Monroe Counties. EWC Basin is Subdivided into 3 Planning Units Estero Bay (20 WBIDs) Southwest Coast (49 WBIDs) Interdrainage Area (11 WBIDs) TOTAL OF 80 WBIDs (Including Coastal WBIDs)
 Southwest Coast (49 WBIDs) Interdrainage Area (11 WBIDs) TOTAL OF 80 WBIDs (Including Coastal WBIDs).")
27
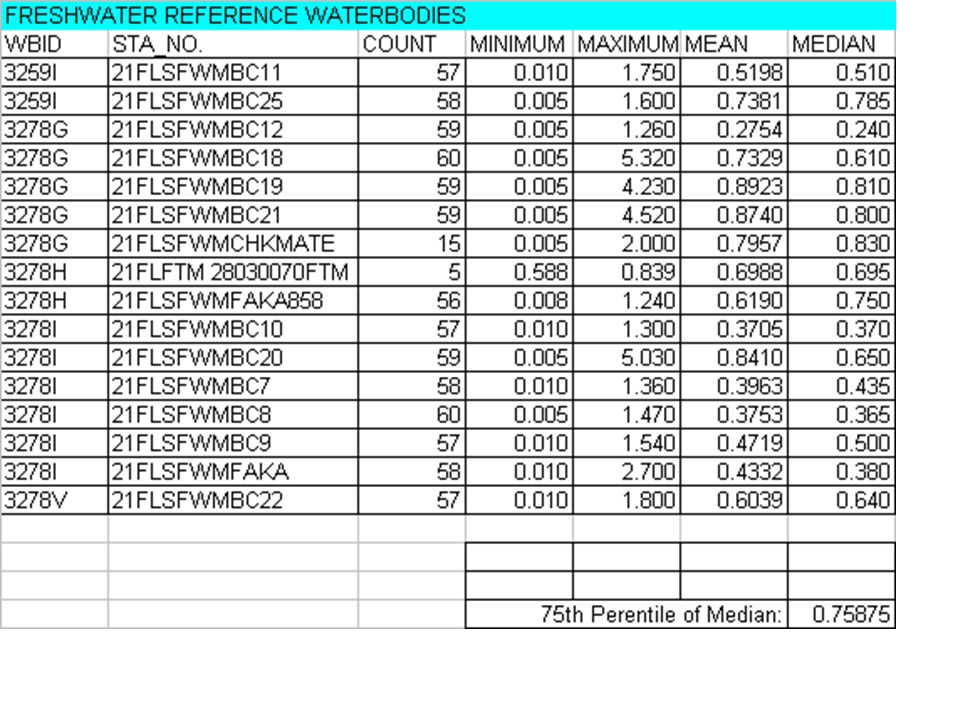
Fresh Water Reference Locations

28
Marine Reference Waterbody: Estero Bay Wetland

30
Therefore Target Concentrations were determined to be… For TP, the consistently low concentrations throughout the waterbodies was argument against setting TP target For TN, based on reference waterbodies and regression analysis, a TN Target Concentration of 0.76 mg/L for Fresh Water and 0.6 mg/L for Marine Segments was set The median BOD5 of Reference Waterbodies was 1.85 mg/L (fresh water) and 1.7 mg/L (Marine Water), generally higher than the median BODs for the Impaired WBIDs.
 and 1.7 mg/L (Marine Water), generally higher than the median BODs for the Impaired WBIDs.")
Similar presentations


 patients Policy.>")


 Grants Chapter 6.>")