Download presentation
Presentation is loading. Please wait.

1
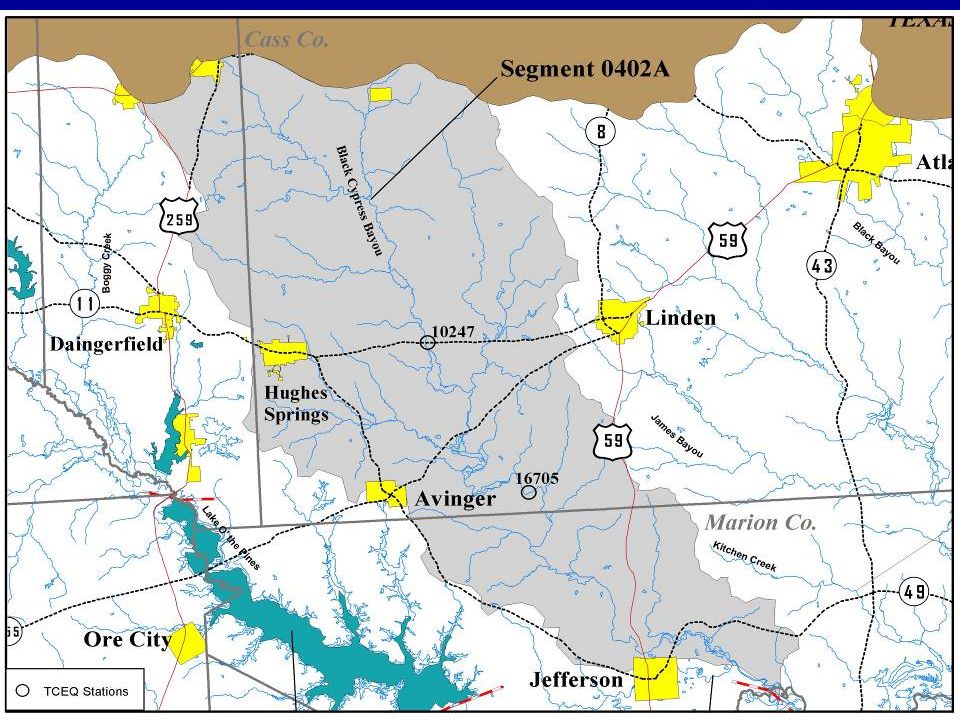
Water Quality in the Caddo Lake Watershed Caddo Lake Water Quality Cypress Creek Clean Rivers Program

3
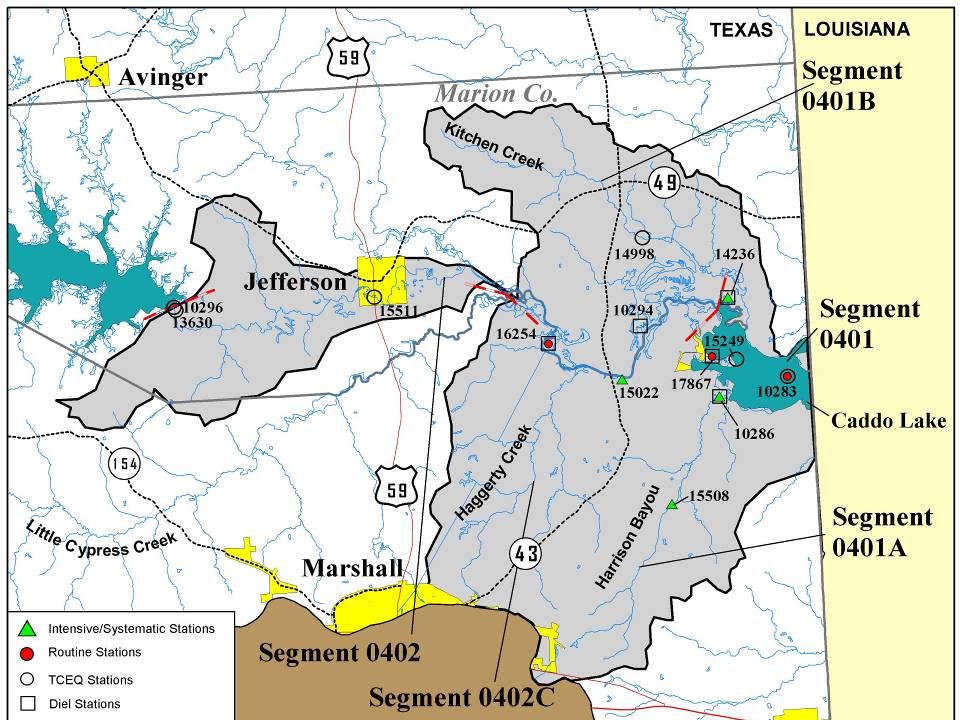
Monitoring Station Types Routine monitoring is used to follow trends and to identify water quality changes in the major watersheds. Systematic monitoring is a screening tool used to detect potential concerns. Typically placed on the smaller streams. Biological monitoring is a key factor. Special study monitoring projects are located and designed to address a specific concern.

5
Water Quality Parameter Sets Field –Temperature –Dissolved Oxygen –Conductivity –pH –Secchi Depth Diel Sampling Conventional –Suspended Solids –Dissolved Solids Chloride Sulfate Hardness Alkalinity –Nutrients –Ammonia, Nitrate & Organic Nitrogen, Phosphorus –Chlorophyll –Bacteria

6
Other Sample Sets Metals in Water and in Sediment –aluminum, arsenic, chromium, copper, nickel, silver, zinc, barium, molybdenum, selenium, iron, and manganese Habitat & Biological –Fish & Macroinvertebrates (Benthics)
")
10
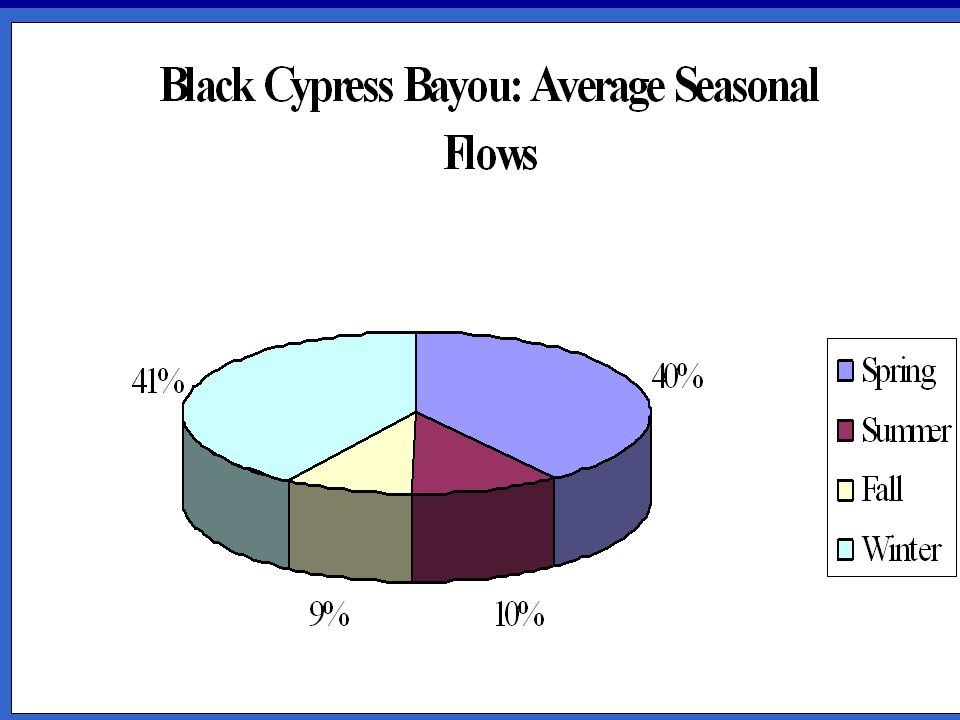
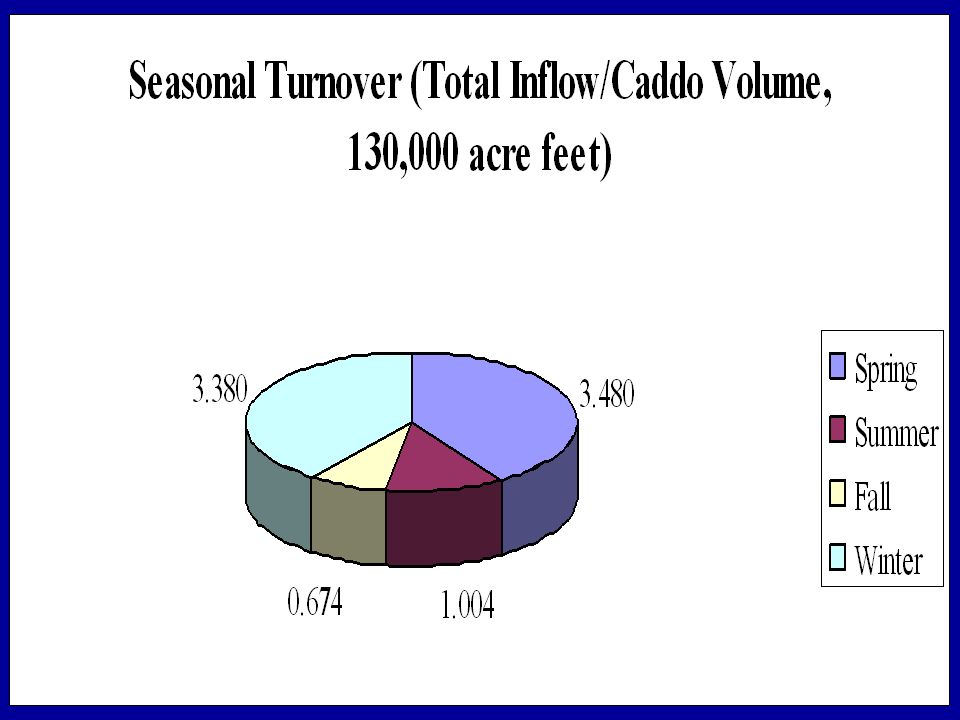
Average Annual Inflow to Caddo Lake During 1979 – 2004

13
Black Cypress Bayou Station 10245 pH Dissolved Oxygen (mg/l) Average 6.4 Average 7.0 Median 6.4 Median 6.6 Range 5.3-8.6 (71) Range 2.3-11.8 (72) Chlorophyll a g/l) Average 7.65Median 5.00 Range 0.20-58.00 (65)
 Average 6.4 Average 7.0 Median 6.4 Median 6.6 Range (71) Range (72) Chlorophyll a g/l) Average 7.65Median 5.00 Range (65)")
15
DO 24HR Min DO 24HR MaxDO Range DO 24HR Average Station 10245 07/18/20003.33.70.43.5 08/24/20000.42.21.81.1 11/21/200010.210.50.310.3 04/06/20017.16.2-0.96.7 05/04/20016.35.9-0.46 06/08/20015.45.50.15 07/03/20015.65.80.25.7 08/08/20012.13.41.33.1 09/11/20015.75.80.15.7 10/19/20017.77.90.27.8 04/13/20056.56.70.26.6 05/06/20057.47.80.47.6 Average0.35.8

16
Nitrogen (mg/l) Station 10245 Nitrate + Nitrite Nitrate Average 0.110.13 Median 0.100.08 Range 0.04-0.28 (26)0.02-0.79 (38) Ammonia TKN Average 0.080.58 Median 0.050.54 Range 0.0-0.277 (65) 0.03-1.27 (34)
 Station Nitrate + Nitrite Nitrate Average Median Range (26) (38) Ammonia TKN Average Median Range (65) (34)")
17
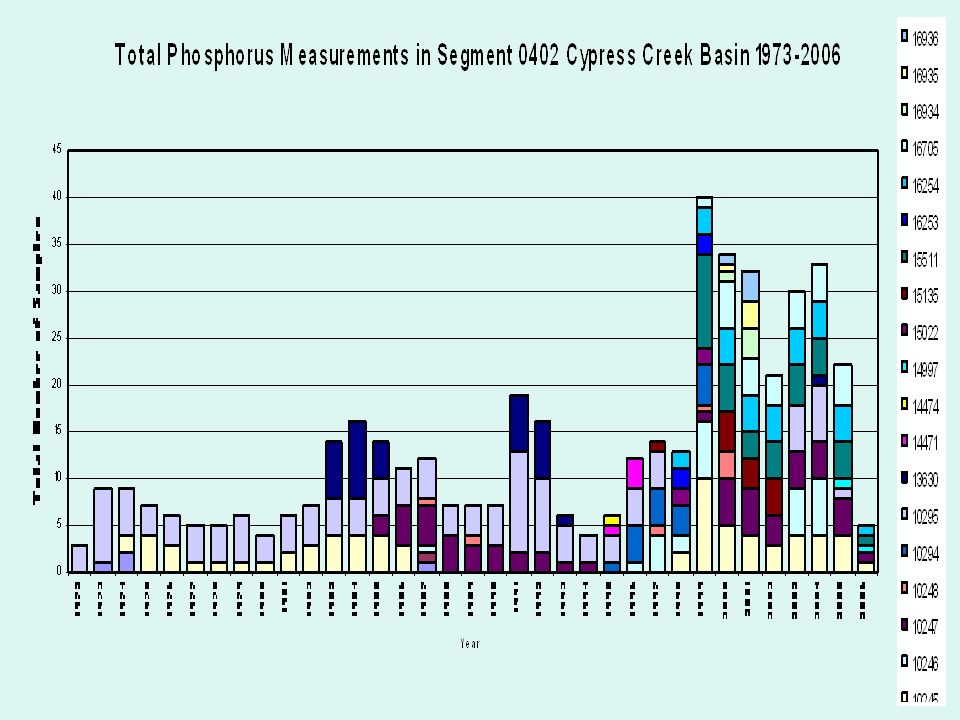
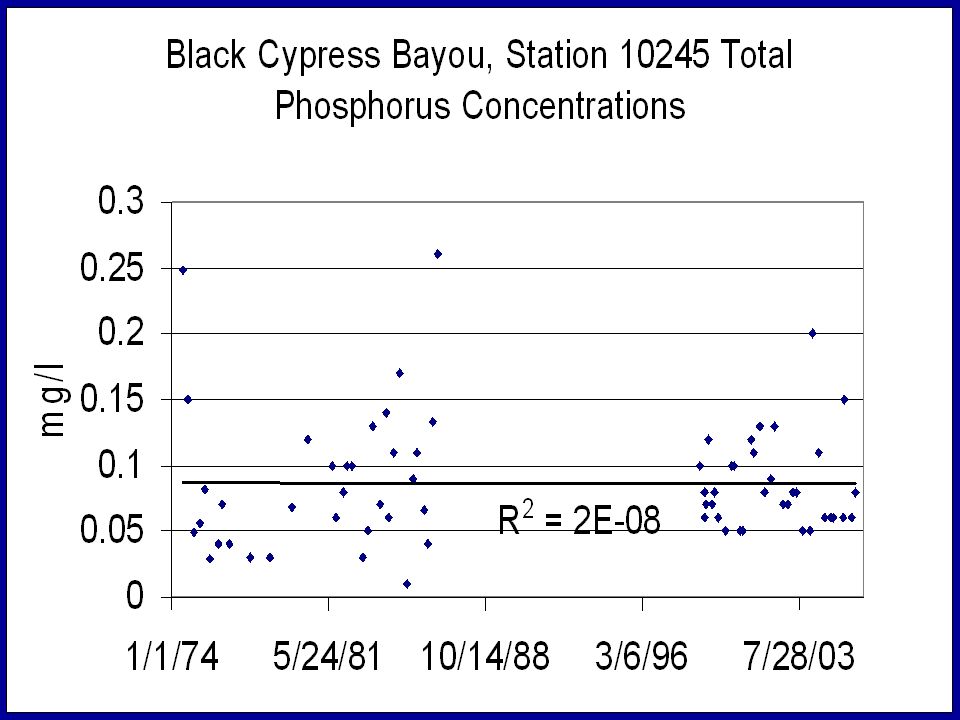
Total Phosphorus (mg/l) Station 1024510246 Average 0.08 0.10 Median 0.08 0.08 Range 0.01-0.26 (66) 0.03-0.20 (25)
 Station Average Median Range (66) (25)")
25
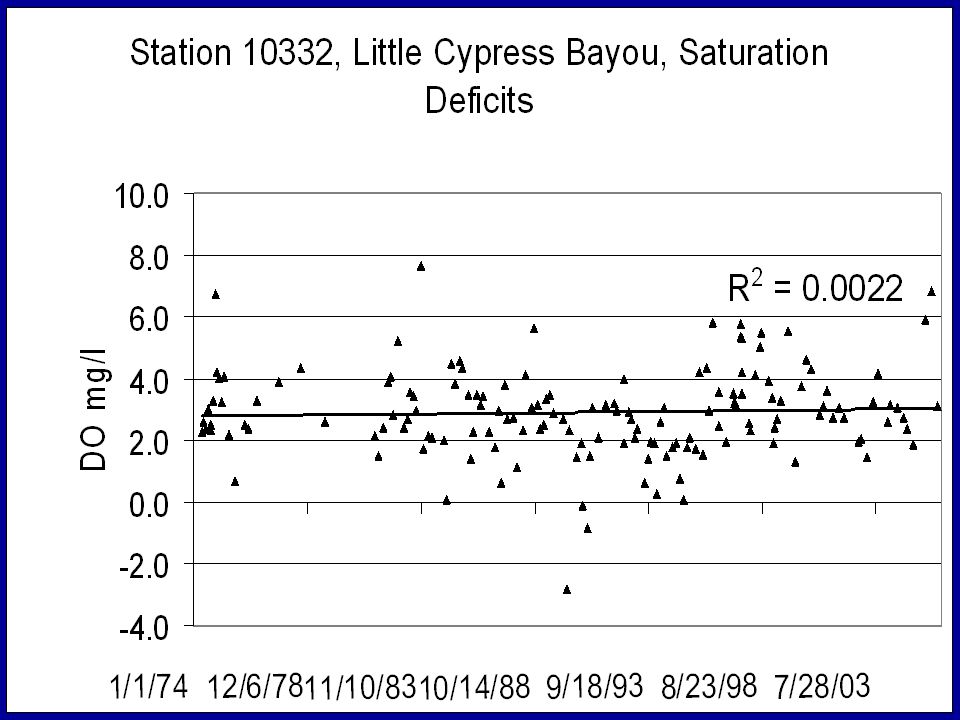
Little Cypress Bayou Station 10332 pH Dissolved Oxygen (mg/l) Average 6.6 7.0 Median 6.6 6.9 Range 5.2-8.6 (157) 2.3-13.7 (154) Chlorophyll a g/l) Average 6.66Median 5.00 Range 0.20-58.00 (65)
 Average Median Range (157) (154) Chlorophyll a g/l) Average 6.66Median 5.00 Range (65)")
27
DO 24HR Min DO 24HR MaxDO Range DO 24HR Average Station 10332 4/2/026.87.30.57 5/3/024.44.70.34.5 6/4/0255.40.45.2 7/2/024.44.80.44.6 8/1/023.94.50.64.2 9/4/024.85.40.65 6/3/034.34.50.24.4 6/24/034.95.20.35 7/25/032.83.50.73.1 8/13/034.65.71.15 Average0.54.8

28
Nitrogen (mg/l) Station 10332 Nitrate + Nitrite Nitrate Average 0.140.09 Median 0.100.07 Range 0.05-0.40 (68)0.02-0.26 (22) Ammonia TKN Average 0.080.76 Median 0.050.70 Range 0.01-0.90 (122) 0.20-2.90 (109)
 Station Nitrate + Nitrite Nitrate Average Median Range (68) (22) Ammonia TKN Average Median Range (122) (109)")
29
Total Phosphorus (mg/l) Station 1033215773 Average 0.11 0.21 Median 0.09 0.14 Range 0.01-1.10 (122) 0.01-1.34 (20)
 Station Average Median Range (122) (20)")
Similar presentations