Download presentation
Presentation is loading. Please wait.

1
PROGRESS REPORT TWG I: Energy Policy Analysis ENERGY PROFILE CENTRAL JAVA PROVINCE YEAR 2006-2008 GRAND CANDI HOTEL SEMARANG, 13 JULY 2011

2
GENERAL INFORMATION OF CENTRAL JAVA PROVINCE

3
Progress of TWG I Complete draft report profile 2006,2007,2008 has been done and will be sent to Pak Koen after today meeting Analysis and simulation by LEAP software is under processing

4
Geographics and Politics Land Area of Central Java Province: 32.500 Km 2 Population Gross Domestic Regional Products (GDRP) Economy
 Economy")
5
Population

7
GDRP Composition by industrial origin (% of Total GDRP ) Source : BPS
 Source : BPS")
8
2005 2007 2006 2008

9
Energy Resources Data for Central Java (All data will be checked with Dinas) Crude Oil
 Crude Oil")
10
Potency of Geothermal at Central Java Source : Direktorat Inventarisasi dan Sumberdaya Mineral, Subdit Panas Bumi

11
Biofuel and Biomass Another resources

12
Biogas Calculation: 1 cow 6 kg manure 10 kg 0.3 m3 biogas For central Java, it has potential: 306,508 m3 CV=4600-6500 kcal/kg

13
Final energy consumption by sector

14
Type of consumption 2007 (SBM) 2008 (SBM) 2008 – 2007 (SBM) Kerosene6.256.2944.251.125- 2.003.169 LPG815.634871.888+56.254 Electricity3.306.9203.620.885+ 313.965 Wood1.403.5141.368.943 - 34.571 Coal Briket29.74428.341-1.403 TOTAL11.810.10610.141.182- 1.668.924 COMPARITION CONSUMPTION ENERGY FOR HOUSEHOLD 2007 – 2008
 2008 (SBM) 2008 – 2007 (SBM) Kerosene LPG Electricity Wood Coal Briket TOTAL COMPARITION CONSUMPTION ENERGY FOR HOUSEHOLD 2007 – 2008")
15
Type of consumption 2007 (SBM) 2008 (SBM) 2008 – 2007 (SBM) Kerosene18.1853.396- 14.789 LPG239.723247.909+8.186 Electricity2.587.2782.809.899+ 222.621 ADO489.406516.838+ 27.432 ID048.08824.941- 23.147 FO29.74428.341-1.403 COAL729.825318.422 - 411.403 TOTAL4.142.2493.405.119- 177.728 COMPARITION CONSUMPTION ENERGY FOR INDUSTRY 2007 – 2008
 2008 (SBM) 2008 – 2007 (SBM) Kerosene LPG Electricity ADO ID FO COAL TOTAL COMPARITION CONSUMPTION ENERGY FOR INDUSTRY 2007 – 2008")
16
Type of consumption 2007 (SBM) 2008 (SBM) 2008 – 2007 (SBM)Kerosene539.739373.649 - 166.090 Premium799.452753.226- 46.226 ADO86.79493.904+ 7.110 IDO3.8222.025- 1.797 FO33.56814.992- 18.576 TOTAL1.463.3751.237.796- 225.580 COMPARITION CONSUMPTION ENERGY FOR OTHERS SECTOR 2007 – 2008
 2008 (SBM) 2008 – 2007 (SBM)Kerosene Premium ADO IDO FO TOTAL COMPARITION CONSUMPTION ENERGY FOR OTHERS SECTOR 2007 – 2008")
17
Final energy consumption per energy

18
Energy transformation Electricity production PLTU & PLTGU PLTP

19
Hydro Power

20
Refinery

21
Energy supply Solid fuels liquid fuels

22
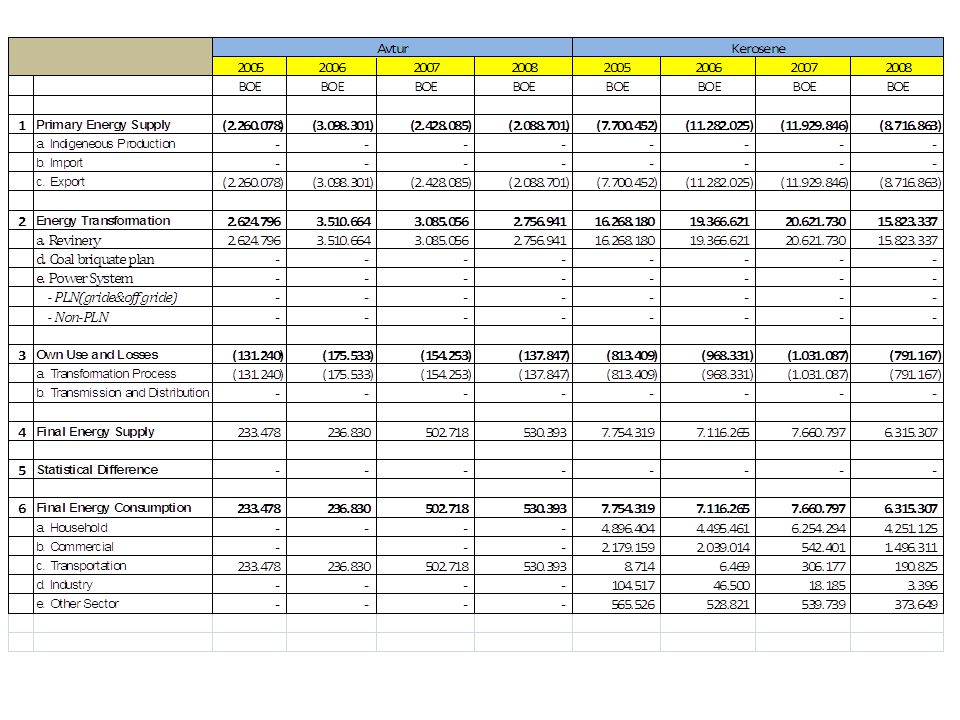
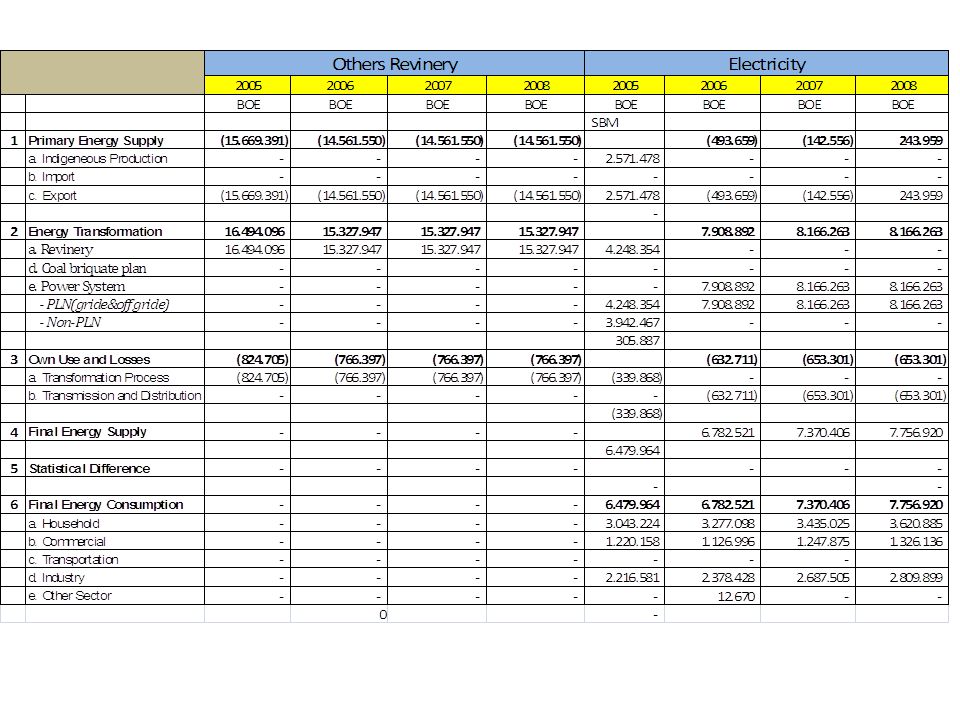
ENERGY BALANCE

30
THANK YOU Energy for Better Future…

Similar presentations


 Introduction: Presentation of the problem #) Statement of the global situation: - Energy and environment - French.>")


 José>")


