Download presentation
Presentation is loading. Please wait.

1
Quality of Protein Crystal Structures in the PDB Eric. N Brown, Lokesh Gakhar and S. Ramaswamy.

2
Between objectivity and subjectivity Carl-Ivar Bränd´en & T. Alwyn Jones Department of Molecular Biology, Uppsala Biomedical Center, PO Box 590, S-751 24 Uppsala, Sweden. Protein crystallography is an exacting trade, and the results may contain errors that are difficult to identify. It is the crystallographer's responsibility to make sure that incorrect protein structures do not reach the literature. Nature 343, 687 - 689 (22 February 1990 )
.")
3
Amplitudes and Phases - Bias. Animal stories - by Kevin Cowtan

4
Amplitudes and Phases - Bias. More animal stories.

5
Stolen from Bernhard Rupp website without permission

6
How much of what we think? Stolen from --- James Holton, Berkeley, without permission.

7
VALIDATION Based on Geometry WHATIF PROCHECK MOLPROBITY RAMACHANDRAN PLOT. STRUCTURE VALIDATION Validation based on fit to DATA R-factor/R-free Real space fit, Etc. Problem: Data to parameter ratio. ADD Geometric Restraints - or Chemical Knowledge COMPOSITE VALIDATION: ASTRAL - SPACI http://astral.Berkeley.edu/spaci.html

8
WHY MORE? DON’T WE HAVE ENOUGH VALIDATION TOOLS? WHAT IS COMMON BETWEEN ALL EXISTING VALIDATION TECHNIQUES? THERE IS AN ABSOLUTE CORRECT ANSWER WE KNOW THERE IS NO CORRECT ANSWER

9
THINK DIFFERENTLY All crystallographers want to deposit the correct structure. There is subjectivity and bias - all of which are random AVERAGE IS BEST !!

10
QUALITY & AVERAGE How different are you from the average is a measure of quality HOW DO YOU DESCRIBE THE AVERAGE?

11
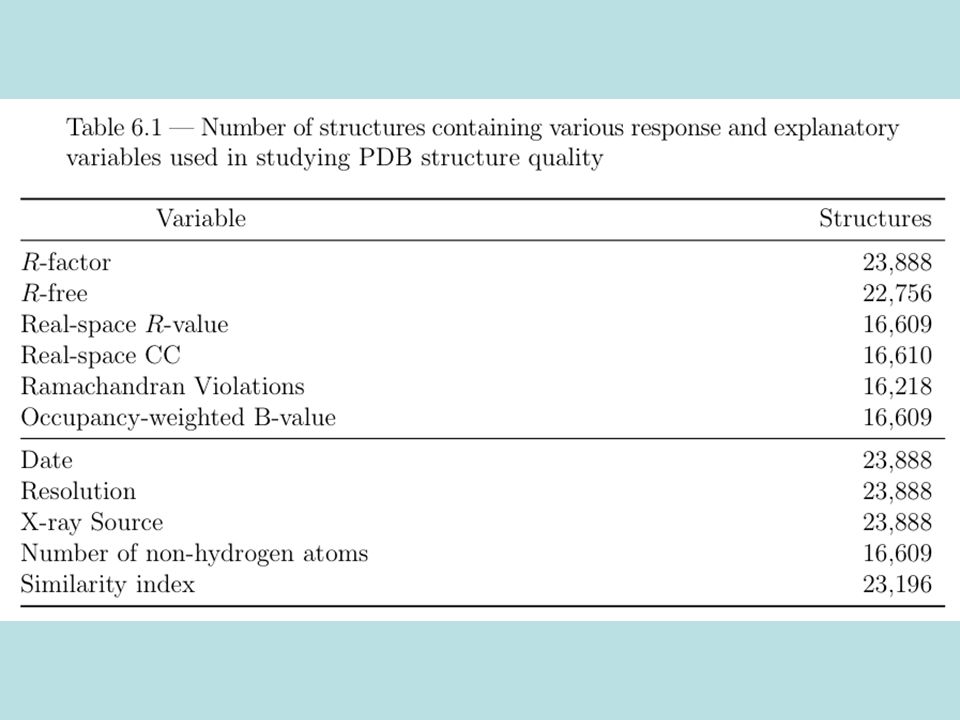
Quality of Model Independent Variables Date submitted to PDB Maximum resolution X-Ray Source Number of atoms Similarity Index Cross Terms Dependent Variables R-factor R-free Real-space R-value Real-space CC Outliers Ramachandran Violations

12
Predictive Models Example: How To determine weight for 5’7” male...... make up an equation...... choose a group of males...... fit the equation to their weight...... evaluate equation.

13
Open problems What independent variables? Quality = f(resolution) Quality = f(resolution, date, x-ray source) What equation? Quality = a x resolution + b x date + c Quality = a x res + log b2 (date) + c How to fit it to observations? - Least squares vs. Maximum likelihood - Outliers
 Quality = f(resolution, date, x-ray source) What equation. Quality = a x resolution + b x date + c Quality = a x res + log b2 (date) + c How to fit it to observations. - Least squares vs. Maximum likelihood - Outliers.")
14
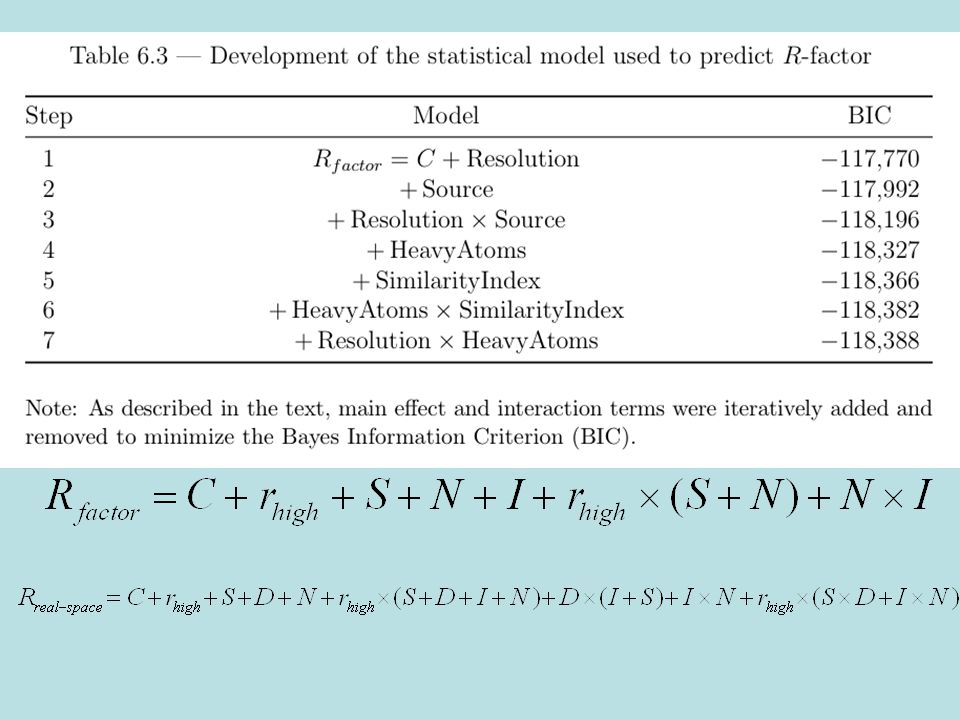
Choose model based on LL Start with Metric = a x resolution + C Add or remove terms iteratively to decrease LL Use BIC to decide if a new parameter contributes to significant decrease in LL or not RESULT: An equation that predicts a given metric… Data is all structures in the PDB that have all independent and dependent variables (16,609) PICK ALL AVAILABLE METRICS (R-factor/R-free etc.. ) and FOR EACH METRIC
 and FOR EACH METRIC.")
17
EQUATIONS FOR METRICS!

18
INFORMATION INHERENT IN THE MODEL Model can tell us immediately What independent variables affect what metrics (dependent variables) and by how much? Example: R-factor Vs time R-factor Vs source & resolution

21
UNEXPLORED QUESTIONS IN THE MODEL? Unexplored Independent Variables : R-sym and Redundancy Space group and volume of unit cell? Refinement protocol Solvent modeling and B-factor modeling. Temperature of data collection. Complexity - as a function of number of chains of macromolecules.

22
Nine - metrics to ONE Principal component analysis We took the nine metrics and combined them to form one metric accounting for co-relations and redundancy. Now we have one metric which is what we can call Quality-values. CONSTRUCTION of the Q-value of the average is zero. Negative numbers mean better than average - positive numbers worse than the average. Standard deviation is one.

24
USE OF THE MODEL COMPARE STRUCTURES WITH THE AVERAGE - INDIVIDUALLY AND AS A GROUP. Q- value is now independent of all the independent variables used to make the model. (Resolution, number of atoms, date of data collection, novelty of structure etc..) Better indicator of quality than any one of the dependent variables.
 Better indicator of quality than any one of the dependent variables..")
25
STRUCTURAL GENOMICS (updated - Jan 2008)
")
26
MCSG over Time!

27
MORE-SG groups!

28
Quality Vs. Journals

30
WHAT CAN WE DO? Beam lines. Best practices. Protocols and methodologies. Countries. Institutions. Funding mechanisms. Investigators.

31
Is this the best we can do?

32
WE CAN DO BETTER We improve quality of structures by better design of experiments and refinement protocols if we know what independent variables affect what dependent variables and how? BEFORE WE DO THIS - FIX PROBLEMS THAT WE FOUND. Too much dependence of external databases! Problems with unknown atoms. Develop methods for missing data correction.

33
OTHER DATABASES - NMR Some thoughts on independent variables. Spectrometers Samples - size, tags, buffers etc.. Completeness of Assignments - percentage of backbone assigned etc.. Actual Data Used in Structural Calculations - NOE distance restraints, Hydrogen bond distance restraints (experimental vs. inferred), Torsion angle restraints, Dipolar coupling restraint, Paramagnetic restraint. Structural Statistics Date of structure determination. Relaxation measurements?
, Torsion angle restraints, Dipolar coupling restraint, Paramagnetic restraint. Structural Statistics Date of structure determination. Relaxation measurements .")
34
OTHER DATABASES - NMR DEPENDENT VARIABLES. RMS deviation of Ensemble Packing (Molprobity score?) Ramachandran violations Recall, Precision, F-measure ( Huang, Powers and Montelione ). Agreement with high resolution X-ray structures Other??
 Ramachandran violations Recall, Precision, F-measure ( Huang, Powers and Montelione ). Agreement with high resolution X-ray structures Other .")
35
AFTER Today's LECTURES HOW ABOUT THE MODEL DATABASE? I am sure out modeling experts can think of the dependent and independent variables….

36
THANK YOU ACKNOWLEDGEMENT X-ray work - Eric N Brown and Lokesh Gakhar The R-statistical package! NMR work - Liping Yu and Andrew Fowler Thanks to Brian Fox for inviting me - though I am not a member of any SG initiative.

37
Questions and Accusations.

Similar presentations


EVER WANTED TO KNOW Julia M. Goodfellow Dynamic Processes: Lecture 1 Lecture Notes.>")


>")


 of experiments James M. Curran Department of Statistics, University of Auckland>")

