Download presentation
Presentation is loading. Please wait.

1
Jack Snoeyink & Matt O’Meara Dept. Computer Science UNC Chapel Hill

2
Collaborators Brian Kuhlman, UNC Biochem Many other members of the RosettaCommons Richardson lab, Duke Biochem Funding NIH NSF

3
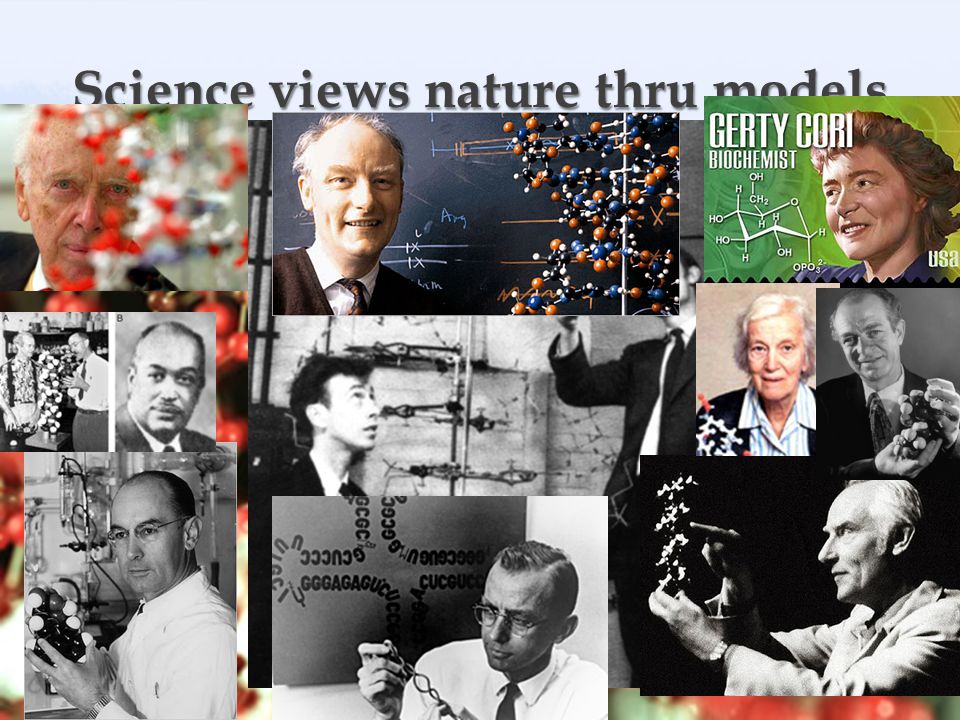
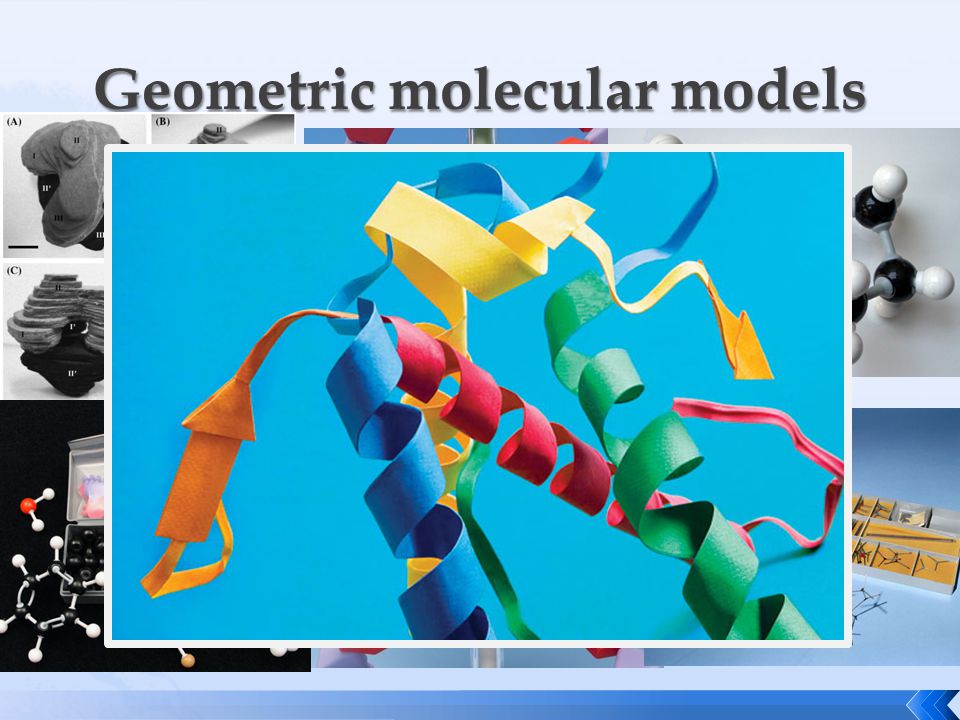
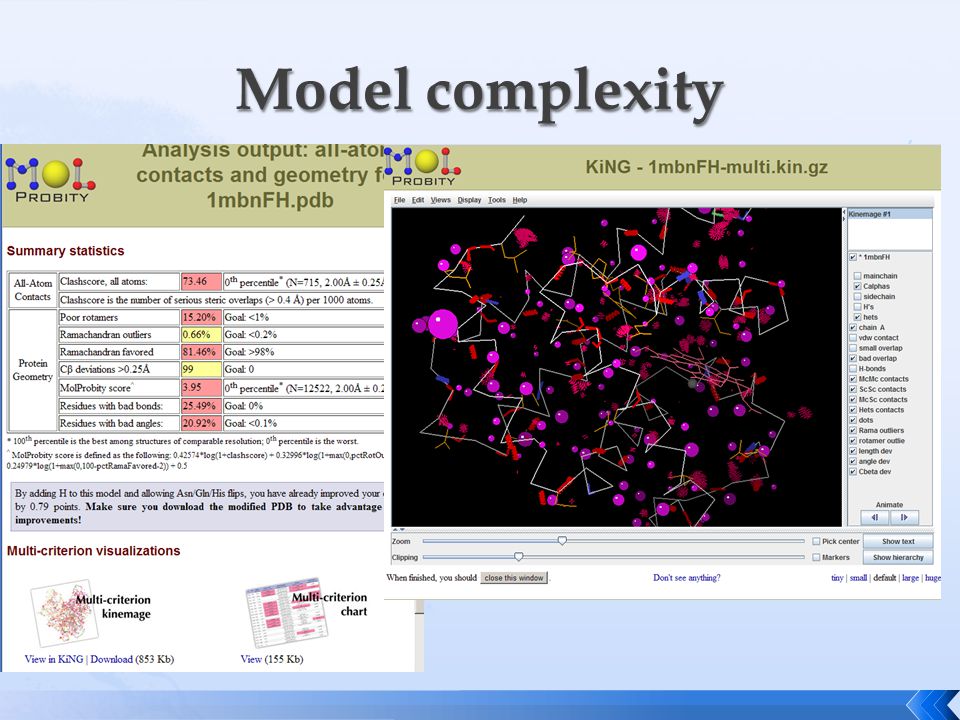
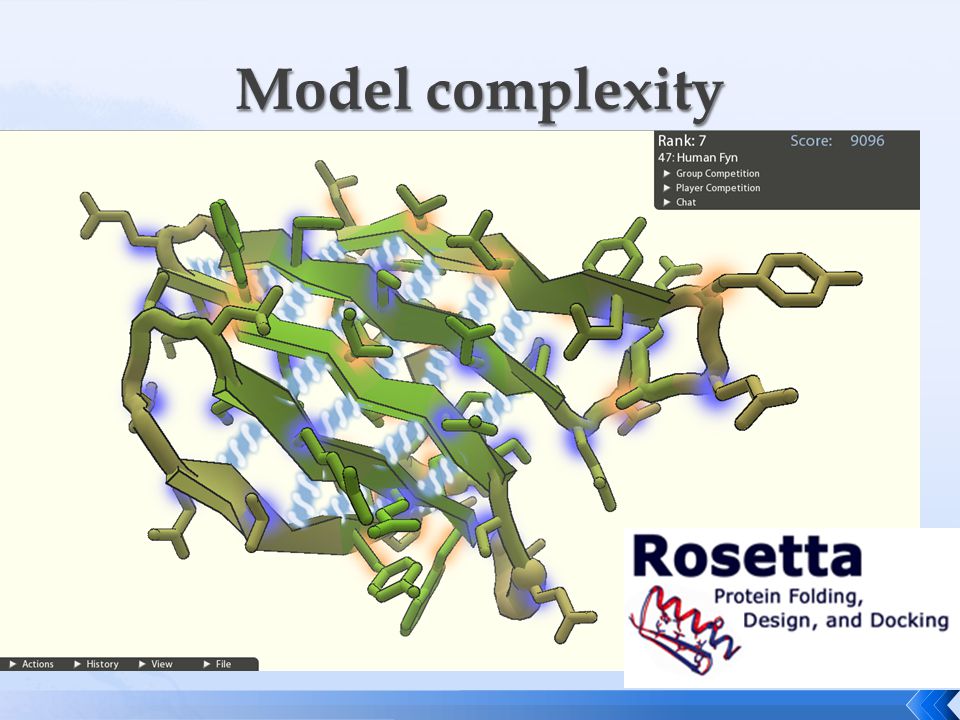
Scientific Models, esp. for Structural Molecular Biology Models are the lens through which we view data Models are predominantly geometric Computational models are complex Models evolve, so testing becomes crucial Focus on statistical/computational models with a sample source, observable local features, chosen functional form, fit parameters, & visualization/testing methods Capture assumptions and date used to build models to: Visualize for making design decisions while building Fit parameters to ensure best performance Record as scientific benchmarks Case Study: Rosetta protein structure prediction software [B]

4
Scientific Models, esp. for Struct. Molec. Bio. Why: Model as Lens Who: Scientists as model builders What: Geometric models Which: Conceptual vs. Computational Where: Evaluative vs. Predictive When: Model evolution How: Roles of models

9
Physical and Conceptual models Kept simple to aid understanding Statistical and Computational models Evolve by combining simple models Even when complex can still be effective at Validation (Molprobity) or Prediction (Rosetta)
 or Prediction (Rosetta)")
13
Spiral development, much like software Discover problematic features in some data Create an energy function to adjust them Fit parameters to improve results Check into the software as a new option Make default option if everyone likes it Occasionally refactor and rewrite, removing outdated or unused models But less support for testing…

14
Our goal: Capture data and assumptions from model building for use in model visualization and testing.

15
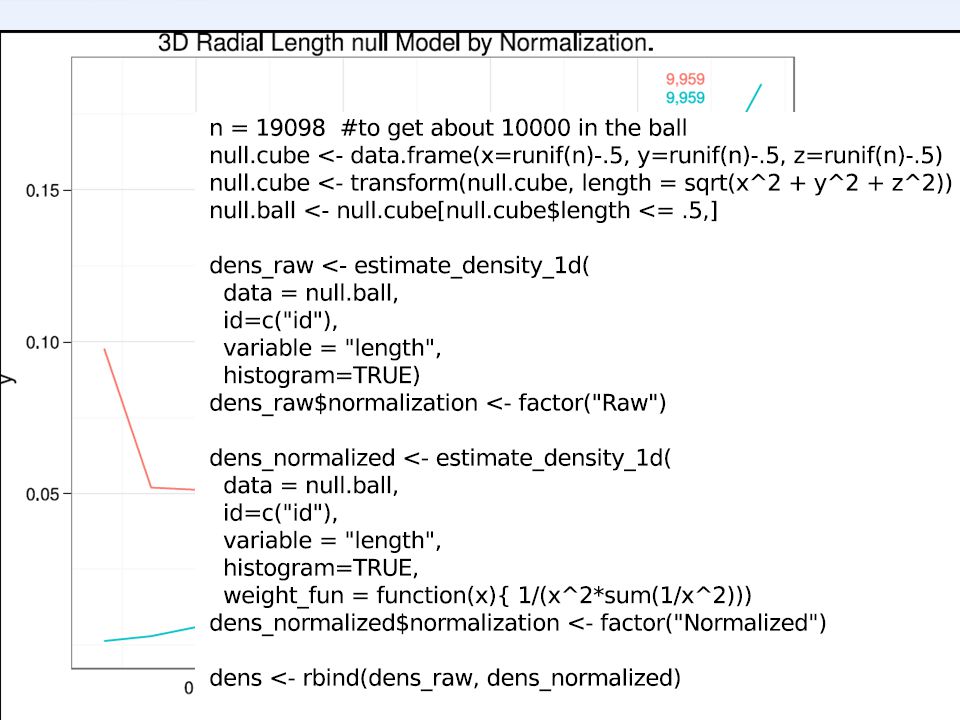
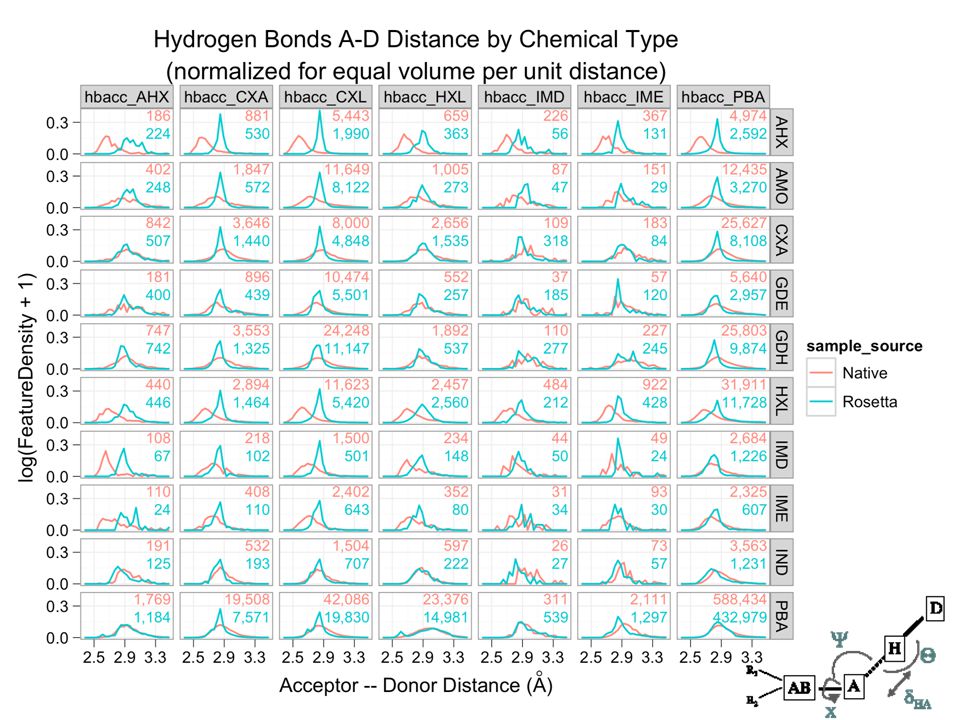
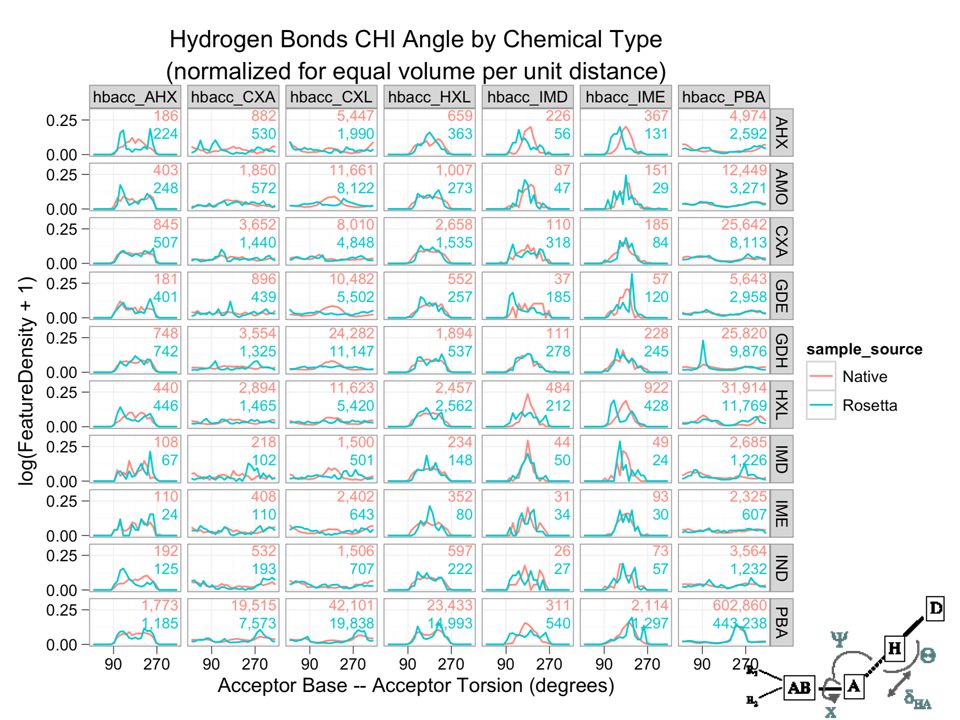
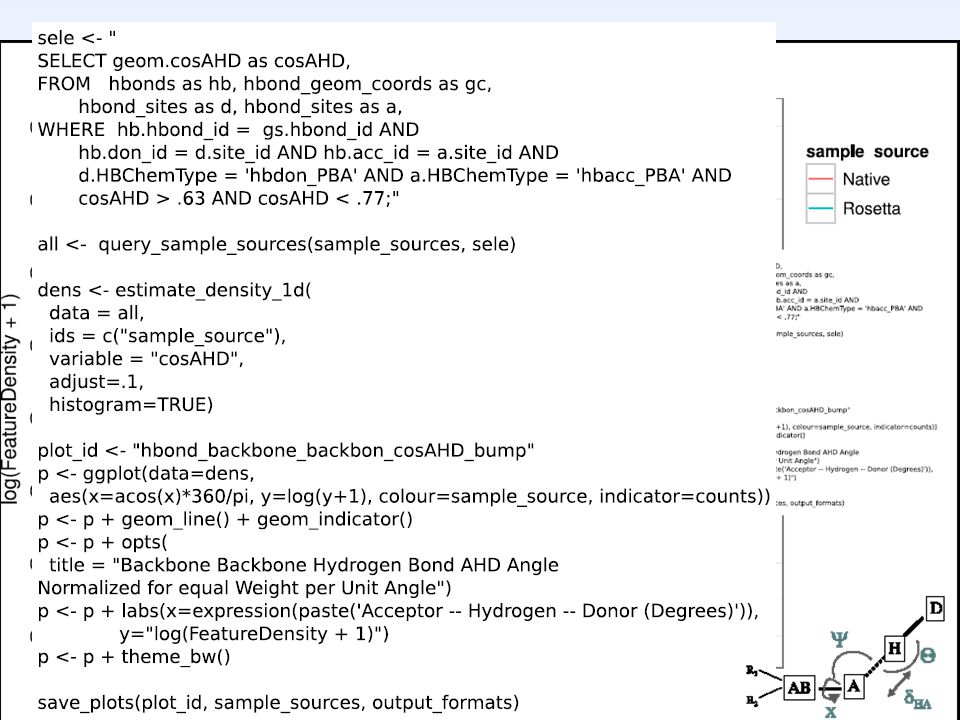
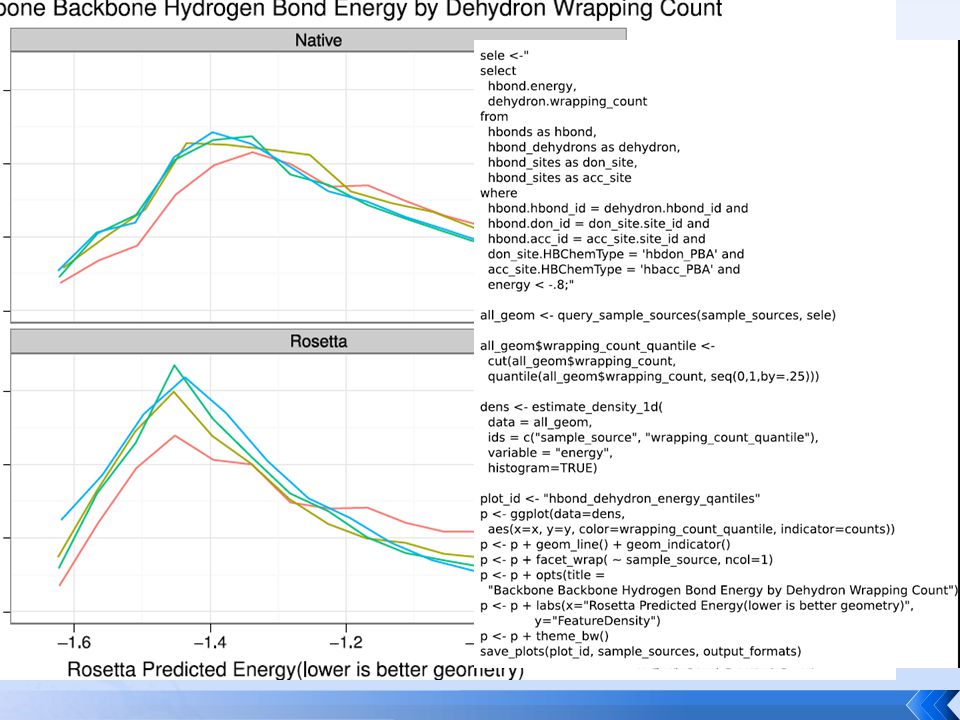
Abstraction: A simple component of a complex computational model consists of: One or more sample sources giving Pdb files from native or decoys Observable local features having a Hydrogen bond distances and angles Chosen functional form that Energy from distances and angles Depends on fitting parameters Weights for combining terms KMB’03

16
data set A data set B data set Z... SQL query ggplot2 spec plots statistics gather features filtertransform Tool schematic

18
Implemented tools Compare distributions from sample sources Tufte’s small multiples via ggplot Kernel density estimation Normalization Opportunities for Statistical analysis Dimension reduction …

19
[KMB’03] Histogram of Hbond A-H distances in natives
![[KMB’03] Histogram of Hbond A-H distances in natives](http://images.slideplayer.com/15/4536520/slides/slide_19.jpg "[KMB’03] Histogram of Hbond A-H distances in natives")
24
Scientific unit tests native, HEAD, ^HEAD run on continuously testing server Knowledge-base score term creation native, release, experimental turn exploration into living benchmarks Test design hypotheses native, protocol, designs how strange is the this geometry?

26
Rotamer recovery

28
Scientific Models, esp. for Structural Molecular Biology Models are the lens through which we view data Models are predominantly geometric Computational models are complex Models evolve, so testing becomes crucial Focus on statistical/computational models with a sample source, observable local features, chosen functional form, fit parameters, & visualization/testing methods Capture assumptions and date used to build models to: Visualize for making design decisions while building Fit parameters to ensure best performance Record as scientific benchmarks Case Study: Rosetta protein structure prediction software [B]

29
Visualization plays important roles in all stages of the life cycle of computational models

Similar presentations


YOUR PROJECT URL HERE.>")


