Download presentation
Presentation is loading. Please wait.

1
Nonrenewable Energy

2
1. Energy Resources 2. Oil 3. Natural Gas 4. Coal 5. Nuclear Energy

3
Energy Sources Modern society requires large quantities of energy that are generated from the earth’s natural resources. Primary Energy Resources: The fossil fuels(oil, gas, and coal), nuclear energy, falling water, geothermal, and solar energy. Secondary Energy Resources: Those sources which are derived from primary resources such as electricity, fuels from coal, (synthetic natural gas and synthetic gasoline), as well as alcohol fuels. _12.ppt
, nuclear energy, falling water, geothermal, and solar energy. Secondary Energy Resources: Those sources which are derived from primary resources such as electricity, fuels from coal, (synthetic natural gas and synthetic gasoline), as well as alcohol fuels. _12.ppt.")
4
Thermodynamics The laws of thermodynamics tell us two things about converting heat energy from steam to work: 1) The conversion of heat to work cannot be 100 % efficient because a portion of the heat is wasted. 2) The efficiency of converting heat to work increases as the heat temperature increases. _12.ppt
 The conversion of heat to work cannot be 100 % efficient because a portion of the heat is wasted. 2) The efficiency of converting heat to work increases as the heat temperature increases. _12.ppt.")
5
Energy Units and Use Btu (British thermal unit) - amount of energy required to raise the temperature of 1 lb of water by 1 ºF. cal (calorie) - the amount of energy required to raise the temperature of 1 g of water by 1 ºC. Commonly, kilocalorie (kcal) is used. 1 Btu = 252 cal = kcal 1 Btu = 1055 J (joule) = kJ 1 cal = J _12.ppt
 - the amount of energy required to raise the temperature of 1 g of water by 1 ºC. Commonly, kilocalorie (kcal) is used. 1 Btu = 252 cal = kcal. 1 Btu = 1055 J (joule) = kJ. 1 cal = J. _12.ppt.")
6
Energy Units and Use Two other units that are often seen are the horsepower and the watt. These are not units of energy, but are units of power. 1 watt (W) = Btu / hour 1 horsepower (hp) = 746 W Watt-hour - Another unit of energy used only to describe electrical energy. Usually we use kilowatt-hour (kW-h) since it is larger. quad (Q) - used for describing very large quantities of energy. 1 Q = 1015 Btu _12.ppt
 = Btu / hour. 1 horsepower (hp) = 746 W. Watt-hour - Another unit of energy used only to describe electrical energy. Usually we use kilowatt-hour (kW-h) since it is larger. quad (Q) - used for describing very large quantities of energy. 1 Q = 1015 Btu. _12.ppt.")
7
Evaluating Energy Resources
U.S. has 4.6% of world population; uses 24% of the world’s energy; 84% from nonrenewable fossil fuels (oil, coal, & natural gas); 7% from nuclear power; 9% from renewable sources (hydropower, geothermal, solar, biomass).
; 7% from nuclear power; 9% from renewable sources (hydropower, geothermal, solar, biomass).")
8
Changes in U.S. Energy Use
&15.ppt

9
Energy resources removed from the earth’s crust include: oil, natural gas, coal, and uranium
&15.ppt

10
Fossil Fuels Fossil fuels originated from the decay of living organisms millions of years ago, and account for about 80% of the energy generated in the U.S. The fossil fuels used in energy generation are: Natural gas, which is % methane (CH4) Liquid hydrocarbons obtained from the distillation of petroleum Coal - a solid mixture of large molecules with a H/C ratio of about 1
 Liquid hydrocarbons obtained from the distillation of petroleum. Coal - a solid mixture of large molecules with a H/C ratio of about 1.")
11
Problems with Fossil Fuels
Fossil fuels are nonrenewable resources At projected consumption rates, natural gas and petroleum will be depleted before the end of the 21st century Impurities in fossil fuels are a major source of pollution Burning fossil fuels produce large amounts of CO2, which contributes to global warming _12.ppt

12
2. Oil 1. Energy Resources 3. Natural Gas 4. Coal 5. Nuclear Energy

13
Oil Deposits of crude oil often are trapped within the earth's crust and can be extracted by drilling a well Fossil fuel, produced by the decomposition of deeply buried organic matter from plants & animals Crude oil: complex liquid mixture of hydrocarbons, with small amounts of S, O, N impurities How Oil Drilling Works by Craig C. Freudenrich, Ph.D.

14
Sources of Oil Organization of Petroleum Exporting Countries (OPEC) countries have 67% world reserves: Algeria, Ecuador, Gabon, Indonesia, Iran, Iraq, Kuwait, Libya, Nigeria, Qatar, Saudi Arabia, United Arab Emirates, & Venezuela Other important producers: Alaska, Siberia, & Mexico. &15.ppt

16
Oil in U.S. 2.3% of world reserves uses nearly 30% of world reserves;
65% for transportation; increasing dependence on imports. &15.ppt

18
Low oil prices have stimulated economic growth, they have discouraged / prevented improvements in energy efficiency and alternative technologies favoring renewable resources. mi.edu/beck /esc101/Cha pter14&15.p pt

19
Comparison of CO2 emitted by fossil fuels and nuclear power.
Burning any fossil fuel releases carbon dioxide into the atmosphere and thus promotes global warming. Comparison of CO2 emitted by fossil fuels and nuclear power. &15.ppt

20
www.bio.miami.edu/beck/esc101/Chapter14 &15.ppt

21
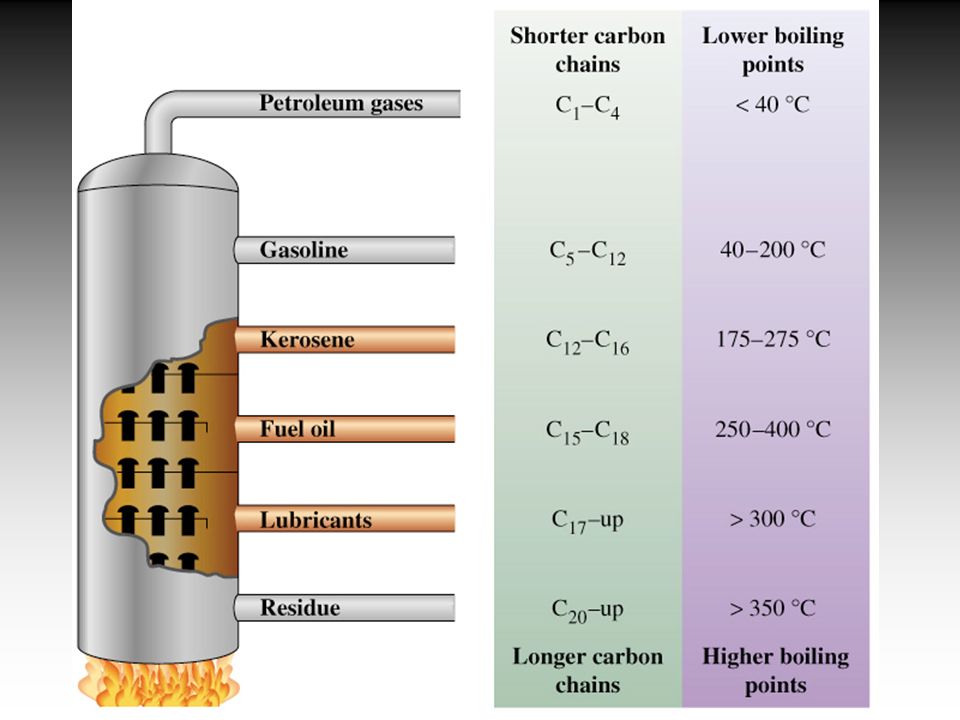
Oil Crude oil is transported to a refinery where distillation produces petrochemicals

25
3. Natural Gas 1. Energy Resources 2. Oil 4. Coal 5. Nuclear Energy

26
Natural Gas - Fossil Fuel
Mixture 50–90% Methane (CH4) Ethane (C2H6) Propane (C3H8) Butane (C4H10) Hydrogen sulfide (H2S) &15.ppt
 Ethane (C2H6) Propane (C3H8) Butane (C4H10) Hydrogen sulfide (H2S) &15.ppt.")
27
Sources of Natural Gas Russia & Kazakhstan - almost 40% of world's supply. Iran (15%), Qatar (5%), Saudi Arabia (4%), Algeria (4%), United States (3%), Nigeria (3%), Venezuela (3%); 90–95% of natural gas in U.S. domestic (~411,000 km = 255,000 miles of pipeline). &15.ppt
, Qatar (5%), Saudi Arabia (4%), Algeria (4%), United States (3%), Nigeria (3%), Venezuela (3%); 90–95% of natural gas in U.S. domestic (~411,000 km = 255,000 miles of pipeline). &15.ppt.")
28
billion cubic metres

29
www.bio.miami.edu/beck/esc101/Chapter14 &15.ppt

30
Natural Gas Experts predict increased use of natural gas during this century

32
Natural Gas When a natural gas field is tapped, propane and butane are liquefied and removed as liquefied petroleum gas (LPG) The rest of the gas (mostly methane) is dried, cleaned, and pumped into pressurized pipelines for distribution Liquefied natural gas (LNG) can be shipped in refrigerated tanker ships
 is dried, cleaned, and pumped into pressurized pipelines for distribution. Liquefied natural gas (LNG) can be shipped in refrigerated tanker ships.")
34
4. Coal 1. Energy Resources 2. Oil 3. Natural Gas 5. Nuclear Energy

35
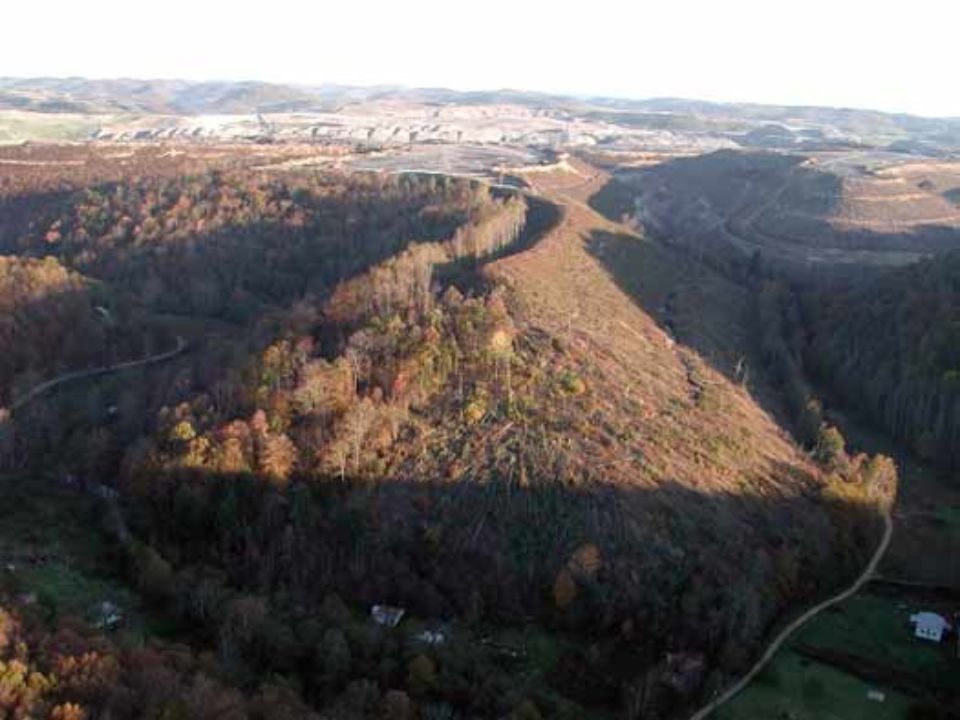
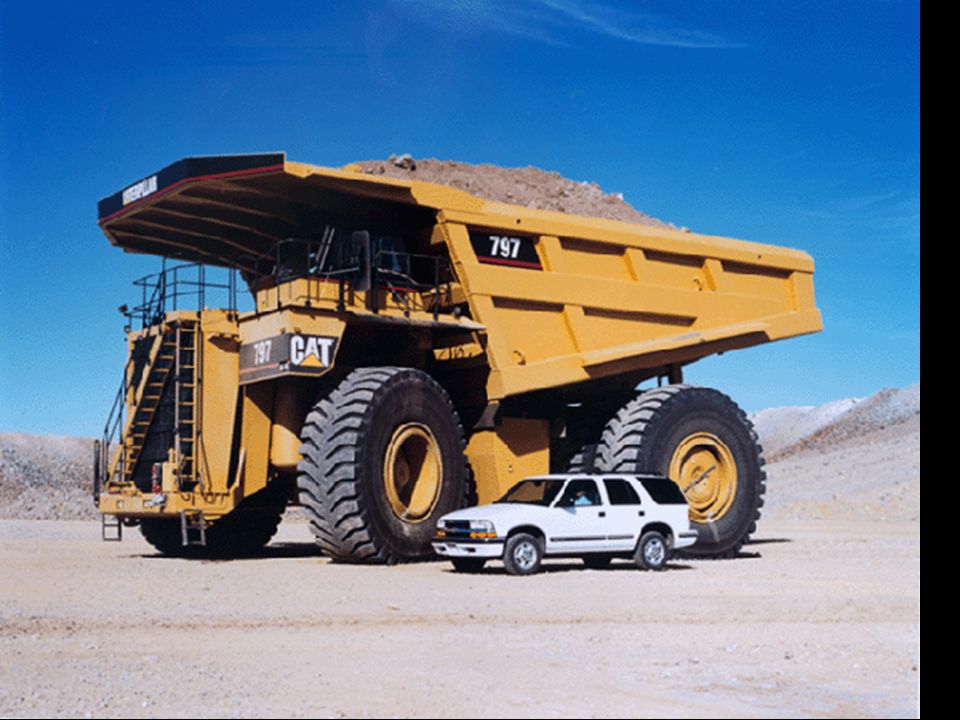
Coal: Supply and Demand
Coal exists in many forms therefore a chemical formula cannot be written for it. Coalification: After plants died they underwent chemical decay to form a product known as peat Over many years, thick peat layers formed. Peat is converted to coal by geological events such as land subsidence which subject the peat to great pressures and temperatures. _12.ppt

36
garnero101.asu.edu/glg101/Lectures/L 37.ppt

38
Ranks of Coal Lignite: A brownish-black coal of low quality (i.e., low heat content per unit) with high inherent moisture and volatile matter. Energy content is lower 4000 BTU/lb. Subbituminous: Black lignite, is dull black and generally contains 20 to 30 percent moisture Energy content is 8,300 BTU/lb. Powerpoint%5CCoal.ppt
 with high inherent moisture and volatile matter. Energy content is lower 4000 BTU/lb. Subbituminous: Black lignite, is dull black and generally contains 20 to 30 percent moisture Energy content is 8,300 BTU/lb. Powerpoint%5CCoal.ppt.")
39
Ranks of Coal Bituminous: most common coal is dense and black (often with well-defined bands of bright and dull material). Its moisture content usually is less than 20 percent. Energy content about 10,500 Btu / lb. Anthracite :A hard, black lustrous coal, often referred to as hard coal, containing a high percentage of fixed carbon and a low percentage of volatile matter. Energy content of about 14,000 Btu/lb. Powerpoint%5CCoal.ppt
. Its moisture content usually is less than 20 percent. Energy content about 10,500 Btu / lb. Anthracite :A hard, black lustrous coal, often referred to as hard coal, containing a high percentage of fixed carbon and a low percentage of volatile matter. Energy content of about 14,000 Btu/lb. Powerpoint%5CCoal.ppt.")
40
PEAT LIGNITE garnero101.asu.edu/glg101/Lectu res/L37.ppt

41
BITUMINOUS ANTHRACITE garnero101.asu.edu/glg101/Lectu res/L37.ppt

42
Main Coal Deposits Bituminous Subbituminous Lignite Anthracite
_12.ppt

43
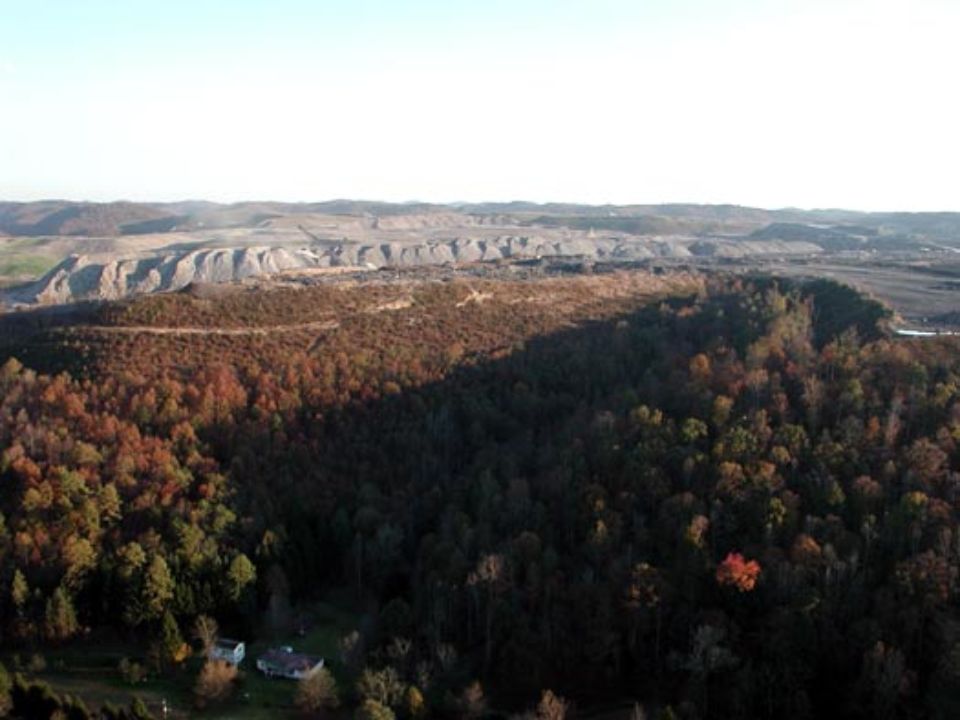
Advantages and Disadvantages
Pros Most abundant fossil fuel Major U.S. reserves 300 yrs. at current consumption rates High net energy yield Cons Dirtiest fuel, highest carbon dioxide Major environmental degradation Major threat to health © Brooks/Cole Publishing Company / ITP &15.ppt

44
Coal Coal gasification ® Synthetic natural gas (SNG)
Coal liquefaction ® Liquid fuels Disadvantage Costly High environmental impact

45
garnero101.asu.edu/glg101/Lectures/L 37.ppt

63
Sulfur in Coal When coal is burned, sulfur is released primarily as sulfur dioxide (SO2 - serious pollutant) Coal Cleaning - Methods of removing sulfur from coal include cleaning, solvent refining, gasification, and liquefaction Scrubbers are used to trap SO2 when coal is burned Two chief forms of sulfur is inorganic (FeS2 or CaSO4) and organic (Sulfur bound to Carbon) _12.ppt
 and organic (Sulfur bound to Carbon) _12.ppt.")
64
Acid Mine Drainage The impact of mine drainage on a lake after receiving effluent from an abandoned tailings impoundment for over 50 years

65
Relatively fresh tailings in an impoundment.
The same tailings impoundment after 7 years of sulfide oxidation. The white spots in Figures A and B are gulls.

66
Mine effluent discharging from the bottom of a waste rock pile

67
Shoreline of a pond receiving AMD showing massive accumulation of iron hydroxides on the pond bottom

68
Groundwater flow through a tailings impoundment and discharging into lakes or streams.

69
5. Nuclear Energy 1. Energy Resources 2. Oil 3. Natural Gas 4. Coal
70
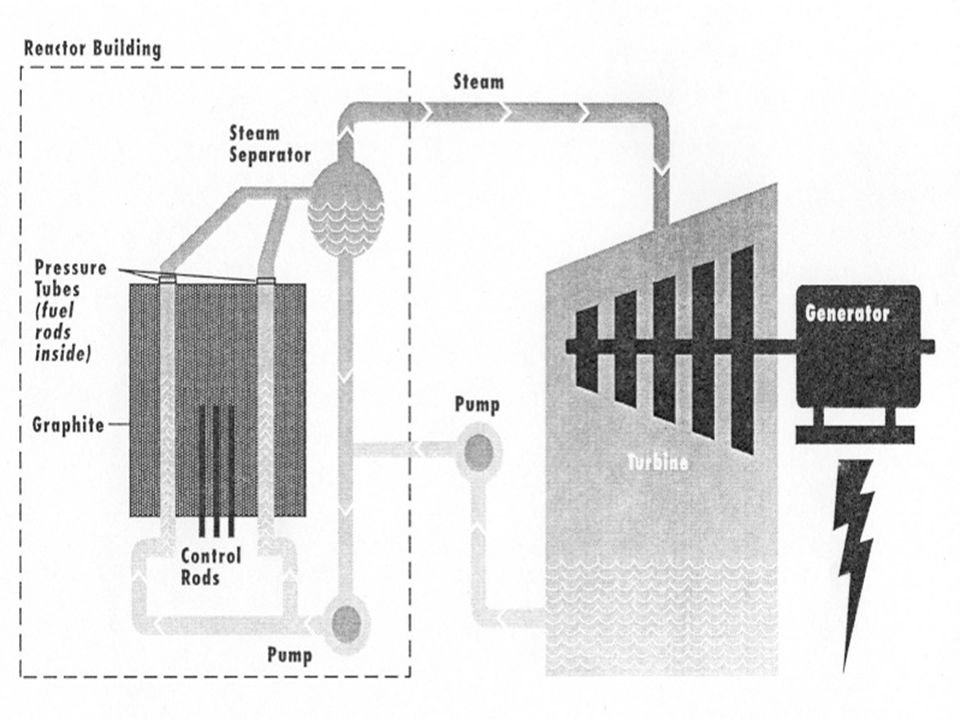
Nuclear Energy In a conventional nuclear power plant
a controlled nuclear fission chain reaction heats water produce high-pressure steam that turns turbines generates electricity.

71
Nuclear Energy Controlled Fission Chain Reaction
neutrons split the nuclei of atoms such as of Uranium or Plutonium release energy (heat) &15.ppt
 &15.ppt.")
72
Controlled Nuclear Fission Reaction
cstl-cst.semo.edu/bornstein/BS105/ Energy%20Use%20-%203.ppt

73
www.bio.miami.edu/beck/esc101/Chapter14 &15.ppt

74
Radioactivity Radioactive decay continues until the the original isotope is changed into a stable isotope that is not radioactive Radioactivity: Nuclear changes in which unstable (radioactive) isotopes emit particles & energy &15.ppt
 isotopes emit particles & energy. &15.ppt.")
75
Radioactivity Types Alpha particles consist of 2 protons and 2 neutrons, and therefore are positively charged Beta particles are negatively charged (electrons) Gamma rays have no mass or charge, but are a form of electromagnetic radiation (similar to X-rays) Sources of natural radiation Soil Rocks Air Water Cosmic rays &15.ppt
 Gamma rays have no mass or charge, but are a form of electromagnetic radiation (similar to X-rays) Sources of natural radiation. Soil. Rocks. Air. Water. Cosmic rays. &15.ppt.")
76
Relative Doses from Radiation Sources
cstl-cst.semo.edu/bornstein/BS105/ Energy%20Use%20-%203.ppt

77
Half-Life The time needed for one-half of the nuclei in a radioisotope to decay and emit their radiation to form a different isotope Half-time emitted Uranium million yrs alpha, gamma Plutonium yrs alpha, gamma During operation, nuclear power plants produce radioactive wastes, including some that remain dangerous for tens of thousands of years

78
Diagram of Radioactive Decay
cstl-cst.semo.edu/bornstein/BS105/ Energy%20Use%20-%203.ppt

79
Effects of Radiation Genetic damages: from mutations that alter genes
Genetic defects can become apparent in the next generation Somatic damages: to tissue, such as burns, miscarriages & cancers &15.ppt

80
www.geology.fau.edu/course_info/fall02/ EVR3019/Nuclear_Waste.ppt

81
Radioactive Waste 1. Low-level radiation (Gives of low amount of radiation) Sources: nuclear power plants, hospitals & universities 1940 – 1970 most was dumped into the ocean Today deposit into landfills 2. High-level radiation (Gives of large amount of radiation) Fuel rods from nuclear power plants Half-time of Plutonium 239 is years No agreement about a safe method of storage &15.ppt
 Fuel rods from nuclear power plants. Half-time of Plutonium 239 is years. No agreement about a safe method of storage. &15.ppt.")
82
Radioactive Waste 1. Bury it deep underground.
Problems: i.e. earthquake, groundwater… 2. Shoot it into space or into the sun. Problems: costs, accident would affect large area. 3. Bury it under the Antarctic ice sheet. Problems: long-term stability of ice is not known, global warming &15.ppt

83
Radioactive Waste 4. Most likely plan for the US
Bury it into Yucca Mountain in desert of Nevada Cost of over $ 50 billion 160 miles from Las Vegas Transportation across the country via train & truck &15.ppt

84
Yucca Mountain EVR3019/Nuclear_Waste.ppt

85
Plutonium Breeding 238U is the most plentiful isotope of Uranium
Non-fissionable - useless as fuel Reactors can be designed to convert 238U into a fissionable isotope of plutonium, 239Pu EVR3019/Nuclear_Waste.ppt

86
Conversion of 238U to 239Pu Under appropriate operating conditions, the neutrons given off by fission reactions can "breed" more fuel, from otherwise non-fissionable isotopes, than they consume Source: EVR3019/Nuclear_Waste.ppt

87
Reprocess Nuclear Fuel
During the operation of a nuclear reactor the uranium runs out Accumulating fission products hinder the proper function of a nuclear reactor Fuel needs to be (partly) renewed every year Source: EVR3019/Nuclear_Waste.ppt
 renewed every year. Source: EVR3019/Nuclear_Waste.ppt.")
88
Plutonium in Spent Fuel
Spent nuclear fuel contains many newly formed plutonium atoms Miss out on the opportunity to split Plutonium in nuclear waste can be separated from fission products and uranium Cleaned Plutonium can be used in a different Nuclear Reactor Source: EVR3019/Nuclear_Waste.ppt

89
www.bio.miami.edu/beck/esc101/Chapter14 &15.ppt

90
Nuclear Energy Concerns about the safety, cost, and liability have slowed the growth of the nuclear power industry Accidents at Chernobyl and Three Mile Island showed that a partial or complete meltdown is possible

91
Nuclear Power Plants in U.S.
cstl-cst.semo.edu/bornstein/BS105/ Energy%20Use%20-%203.ppt

92
Three Mile Island March 29, 1979, a reactor near Harrisburg, PA lost coolant water because of mechanical and human errors and suffered a partial meltdown 50,000 people evacuated & another 50,000 fled area Unknown amounts of radioactive materials released Partial cleanup & damages cost $1.2 billion Released radiation increased cancer rates. &15.ppt

94
Chernobyl April 26, 1986, reactor explosion (Ukraine) flung radioactive debris into atmosphere Health ministry reported 3,576 deaths Green Peace estimates32,000 deaths; About 400,000 people were forced to leave their homes ~160,000 sq km (62,00 sq mi) contaminated > Half million people exposed to dangerous levels of radioactivity Cost of incident > $358 billion &15.ppt
 contaminated. > Half million people exposed to dangerous levels of radioactivity. Cost of incident > $358 billion. &15.ppt.")
97
Nuclear Energy Nuclear plants must be decommissioned after 15-40 years
New reactor designs are still proposed Experimental breeder nuclear fission reactors have proven too costly to build and operate Attempts to produce electricity by nuclear fusion have been unsuccessful

98
Use of Nuclear Energy U.S. phasing out
Some countries (France, Japan) investing increasingly U.S. currently ~7% of energy nuclear No new U.S. power plants ordered since 1978 40% of 105 commercial nuclear power expected to be retired by 2015 and all by 2030 North Korea is getting new plants from the US France 78% energy nuclear &15.ppt
 investing increasingly. U.S. currently ~7% of energy nuclear. No new U.S. power plants ordered since % of 105 commercial nuclear power expected to be retired by 2015 and all by North Korea is getting new plants from the US. France 78% energy nuclear. &15.ppt.")
99
Phasing Out Nuclear Power
Multi-billion-$$ construction costs High operation costs Frequent malfunctions False assurances and cover–ups Overproduction of energy in some areas Poor management Lack of public acceptance &15.ppt

100
Energy & Mineral resources 2) Energy A quad is BTU
 Energy A quad is 1015 BTU")
Similar presentations


 Neutron – have.>")


 –Wind (turbines) –Water (hydropower)>")


 Ethane (C 2 H 6 ) Propane (C 3 H 8 ) Butane (C 4 H 10 ) Hydrogen.>")


