Download presentation
Presentation is loading. Please wait.

1
Radiation Dosimetry and Safety Thomas H. Hauser MD, MMSc, MPH, FACC Director of Nuclear Cardiology Beth Israel Deaconess Medical Center Assistant Professor of Medicine Harvard Medical School Boston, MA

5
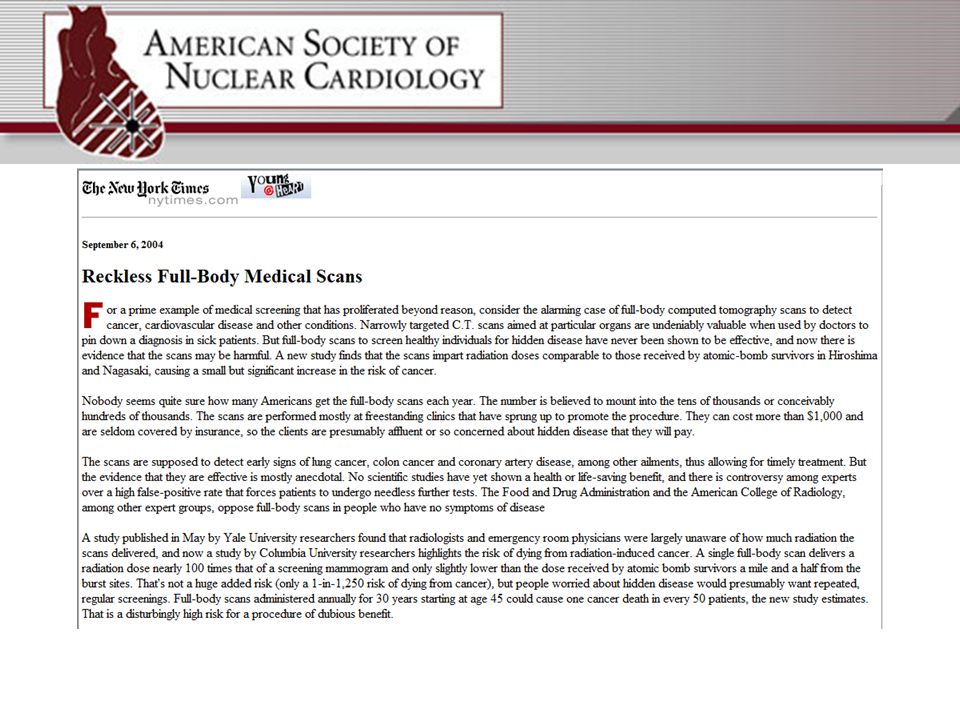
A study published in May by Yale University researchers found that radiologists and emergency room physicians were largely unaware of how much radiation the scans delivered, and now a study by Columbia University researchers highlights the risk of dying from radiation- induced cancer. A single full-body scan delivers a radiation dose nearly 100 times that of a screening mammogram and only slightly lower than the dose received by atomic bomb survivors a mile and a half from the burst sites. That's not a huge added risk (only a 1-in-1,250 risk of dying from cancer), but people worried about hidden disease would presumably want repeated, regular screenings. Full-body scans administered annually for 30 years starting at age 45 could cause one cancer death in every 50 patients, the new study estimates. That is a disturbingly high risk for a procedure of dubious benefit.
, but people worried about hidden disease would presumably want repeated, regular screenings. Full-body scans administered annually for 30 years starting at age 45 could cause one cancer death in every 50 patients, the new study estimates. That is a disturbingly high risk for a procedure of dubious benefit..")
6
Annual Number of CTs in USA Brenner and Hall, NEJM 357 (22): 2277
: 2277")
7
Outline Radiation dosimetry Radiation safety

8
Outline Radiation dosimetry Radiation safety

9
Measures of Radiation Activity: Becquerel (= 2.7*10 -11 Curie) Absorbed dose: Gray (= 100 rad) –1 joule of energy deposited per kg of absorber Biologically effective dose: Sievert (= 100 rem) –Sievert = Gray * Q * N Q, quality factor –Photons, electrons, = 1 –Alpha particles, = 20 N, depends on type of body tissue –For most tissues, = 0.05 –For gonads, = 0.2 –For bone marrow, colon, lung, stomach, = 0.12
 Absorbed dose: Gray (= 100 rad) –1 joule of energy deposited per kg of absorber Biologically effective dose: Sievert (= 100 rem) –Sievert = Gray * Q * N Q, quality factor –Photons, electrons, = 1 –Alpha particles, = 20 N, depends on type of body tissue –For most tissues, = 0.05 –For gonads, = 0.2 –For bone marrow, colon, lung, stomach, = 0.12")
10
Example Radiation Exposures http://hyperphysics.phy-astr.gsu.edu/Hbase/nucene/radexp.html

11
Your Exposure Increases by 0.01 mSv from… Three days of living in Atlanta Two days of living in Denver About seven hours in some spots in the Espirito Santo State of Brazil. An average year of TV watching (CRT) A year of wearing a luminous dial watch A coast-to-coast airline flight http://hyperphysics.phy-astr.gsu.edu/Hbase/nucene/radexp.html
 A year of wearing a luminous dial watch A coast-to-coast airline flight")
12
Radiation Biology (Radiobiology)
")
15
Radiation Dose Ranges for Medical Imaging

16
Stochastic Processes A stochastic process is one whose behavior is non- deterministic in that a state does not fully determine its next state. Stochastic crafts are complex systems whose practitioners, even if complete experts, cannot guarantee success. Classical examples of this are medicine: a doctor can administer the same treatment to multiple patients suffering from the same symptoms, however, the patients may not all react to the treatment the same way. This makes medicine a stochastic process. www.wikipedia.org

17
Health Effects of Radiation Stochastic health effects –Long term, low level radiation exposure –Increased exposure increases likelihood of the effect Increased exposure does not affect severity Effects typically occur late after exposure –Cancer, teratogenic effects, genetic (germ line) effects Non-stochastic health effects –Short term, high level radiation exposure –Increased exposure increases both the likelihood and severity of the effect Effects typically occur shortly after exposure –Burns, radiation sickness, organ failure www.epa.gov
 effects Non-stochastic health effects –Short term, high level radiation exposure –Increased exposure increases both the likelihood and severity of the effect Effects typically occur shortly after exposure –Burns, radiation sickness, organ failure")
18
Health Effects of Radiation The health effects of radiation from medical imaging are stochastic –Low level radiation exposure –Typically multiple discrete exposures –Cancer is the main health effect of concern

19
Models to Determine Radiation Risk Linear no threshold –Risk from stochastic health effects decreases linearly with biologically effective absorbed dose –Implies that there is risk to even low levels of radiation –Most widely accepted model Linear with threshold –Risk from stochastic health effects decreases linearly with dose until the radiation level crosses a threshold beyond which there is no risk Hormesis –The hypothesis that low doses of radiation are beneficial while high doses are harmful –Widely rejected

20
Cancer Risk Estimates Atomic weapon survivors –25,000 survivors with exposures of <50 mSv –Significantly increased risk of cancer Nuclear power plant employees –400,000 studied with mean dose of 20 m Sv –Significantly increased risk of cancer Information from both cohorts quantitatively similar Brenner and Hall, NEJM 357 (22): 2277
: 2277")
21
Cancer Risk Estimates Brenner and Hall, NEJM 357 (22): 2277
: 2277")
22
CT Radiation Doses

23
Nuclear Radiation Doses Toohey et al, Radiographics. 2000;20:533-546

24
Coronary CT Radiation Dose Einstein et al, JAMA. 2007;298:317-323.

25
Radiation Exposure Einstein et al, JAMA. 2007;298:317-323.

26
Radiation Exposure Einstein et al, JAMA. 2007;298:317-323. LAR for 80 yo man with heart only ~1/5000

27
Outline Radiation dosimetry Radiation safety

28
Radiation Safety Time Distance Shielding

29
Time Spend as little time as possible near radiation –Delivered dose is a function of time

30
Distance The dose of radiation decreases as the square of the distance between you and the source –Increases as the square of the distance as you get closer

31
Shielding If you must spend a significant amount of time near a radiation source, use as much shielding as possible –Lead –Plastic

32
Lead Shielding

33
Plastic Shielding Best for β emitters –Prevents bremsstrahlung

34
Why is the Dose So High for Coronary CTA? Pitch –Typical pitch for helical/spiral acquisitions is 0.2 Each part of body is irradiated 5 times –Increases time of exposure kV, mA –Relatively high values to obtain high quality images with high spatial resolution –Increases intensity of exposure

35
Retrospective Gating: Helical/Spiral Data acquired throughout the cardiac cycle –Reconstruction of entire dataset for evaluation of LV function –Radiation dose of 15 to 21 mSv

36
Prospective Gating: Dose Modulation Tube current is varied over the cardiac cycle to produce high quality images during ventricular diastole (coronary quiescent period). Optimal image quality only during diastole –Evaluation of LV function still possible, but not optimal Radiation dose 7 to 12 mSv (40% reduction)
.")
37
Prospective Gating: Step and Shoot Tube voltage turned on prospectively only during ventricular diastole Data not acquired during systole –Limited range of reconstruction –No assessment of LV function Radiation dose of 3 to 5 mSv (70% reduction)
")
38
Dual Source CT McCollough, C. H. et al. Radiology 2007;243:775-784

39
Radiation Exposure Hausleiter et al. Circulation, 113 (10): 1305. (2006)
: (2006)")
40
Summary Radiation dosimetry –The sievert is the preferred measure of radiation exposure –Medical imaging results in low dose exposure with stochastic health effects –The principle adverse outcome for low dose exposure is cancer –Coronary CTA delivers a relatively high dose of 15 to 21 mSv that results in a non-trivial risk of cancer Radiation safety –Time, distance, shielding –For coronary CTA, pitch and exposure intensity are the primary determinants of radiation dose –Employing dose modulation, prospective gating, dual source CT and lower kV may reduce the radiation dose

Similar presentations


 effects –Severity increases with dose.>")


