Download presentation
Presentation is loading. Please wait.

1
Organic Structure Analysis
Professor Marcel Jaspars

2
Aim This course aims to extend student’s knowledge and experience with nuclear magnetic resonance (NMR) and mass spectroscopy (MS), by building on the material taught in the 3rd Year Organic Spectroscopy course, and also to develop problem solving skills in this area.
 and mass spectroscopy (MS), by building on the material taught in the 3rd Year Organic Spectroscopy course, and also to develop problem solving skills in this area.")
3
Learning Outcomes By the end of this course you should be able to:
Assign 1H and 13C NMR spectra of organic molecules. Analyse complex first order multiplets. Elucidate the structure of organic molecules using NMR and MS data. Use data from coupling constants and NOE experiments to determine relative stereochemistry. Understand and use data from 2D NMR experiments.

4
Synopsis A general strategy for solving structural problems using spectroscopic methods, including dereplication methods. Determination of molecular formulae using NMR & MS Analysis of multiplet patterns to determine coupling constants. Single irradiation experiments. Spectral simulation. The Karplus equation and its use in the determination of relative stereochemistry in conformationally rigid molecules. Determination of relative stereochemistry using the nuclear Overhauser effect (nOe). Rules to determine whether a nucleus can be studied by NMR & What other factors must be taken into consideration. Multinuclear NMR-commonly studied heteronuclei. Basic 2D NMR experiments and their uses in structure determination.
. Rules to determine whether a nucleus can be studied by NMR & What other factors must be taken into consideration. Multinuclear NMR-commonly studied heteronuclei. Basic 2D NMR experiments and their uses in structure determination.")
5
Books Organic Structure Analysis, Crews, Rodriguez and Jaspars, OUP, 2009 Spectroscopic Methods in Organic Chemistry, Williams and Fleming, McGraw-Hill, 2007 Organic Structures from Spectra, Field, Sternhell and Kalman, Wiley, 2008 Spectrometric Identification of Organic Compounds, Silverstein, Webster and Kiemle, Wiley, 2007 Introduction to Spectroscopy, Pavia, Lampman, Kriz and Vyvyan, Brooks/Cole 2009

6
Four Types of Information from NMR

9
1H NMR Chemical Shifts in Organic Compounds

10
13C NMR Chemical Shifts in Organic Compounds

11
5 Minute Problem #1 MF = C6H12O Unsaturated acyclic ether

12
Six Simple Steps for Successful Structure Solution
Get molecular formula. Use combustion analysis, mass spectrum and/or 13C NMR spectrum. Calculate double bond equivalents (DBE). Determine functional groups from IR, 1H and 13C NMR Compare 1H integrals to number of H’s in the MF. Determine coupling constants (J’s) for all multiplets. Use information from 3. and 4. to construct spin systems (substructures) Assemble substructures in all possible ways, taking account of DBE and functional groups. Make sure the integrals and coupling patterns agree with the proposed structure.
. Determine functional groups from IR, 1H and 13C NMR. Compare 1H integrals to number of H’s in the MF. Determine coupling constants (J’s) for all multiplets. Use information from 3. and 4. to construct spin systems (substructures) Assemble substructures in all possible ways, taking account of DBE and functional groups. Make sure the integrals and coupling patterns agree with the proposed structure.")
13
Double Bond Equivalents
CaHbOcNdXe [(2a+2) – (b-d+e)] DBE = 2 C2H3O2Cl =
 – (b-d+e)] DBE = 2. C2H3O2Cl =")
14
Tabulate Data Shift (ppm) Int. Mult (J/Hz) Inference 6.48 1H dd, 14, 7
4.17 d, 14 3.97 d, 7 3.69 2H t, 7 1.65 quint, 7 1.42 sext, 7 0.95 3H

15
Solution

16
Shift Prediction Prediction

17
THE PROCESS OF STRUCTURE ELUCIDATION
Organic Structure Analysis, Crews, Rodriguez and Jaspars

18
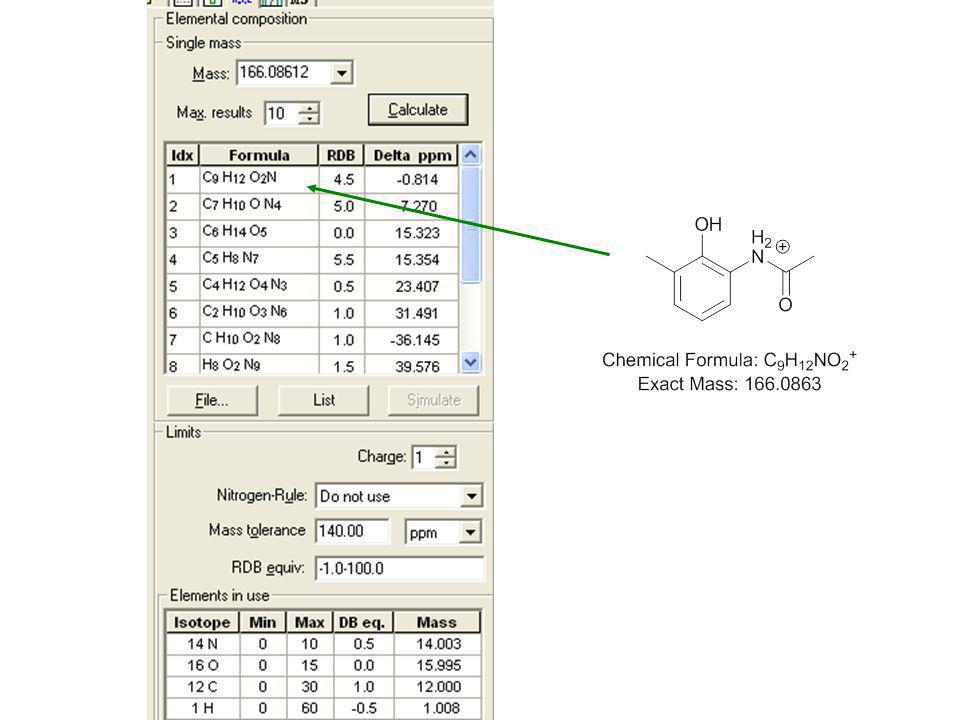
Dereplication Dediscovery

19
Dereplication

20
Dereplication

21
Determining the Molecular Formula Using NMR and MS Data
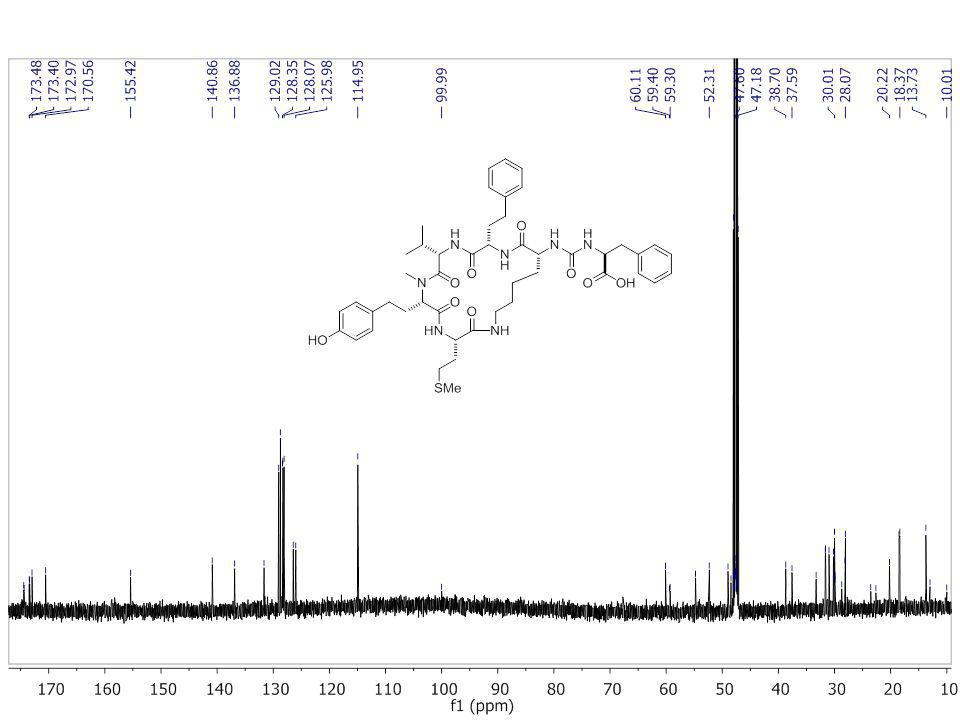
DEPT-135 Organic Structure Analysis, Crews, Rodriguez and Jaspars

22
Determining the Molecular Formula Using NMR and MS Data

23
Determining the Molecular Formula Using NMR and MS Data

24
MS Errors Experimental accurate mass measurement (from MS) was suggesting C10H16 is the correct formula. The error between calculated and experimental mass is: = = 0.8 mmu Formula dbe Accurate mass C10H16 3 C9H12O 4 C8H8O2 5 C7H4O3 6 C9H14N 3.5 C8H12N2

25
Molecular Formula Calculators
James Deline MFCalc

26
Isotope Ratio Patterns: C100H200
For 12Cm13Cn 1403.6 1404.6

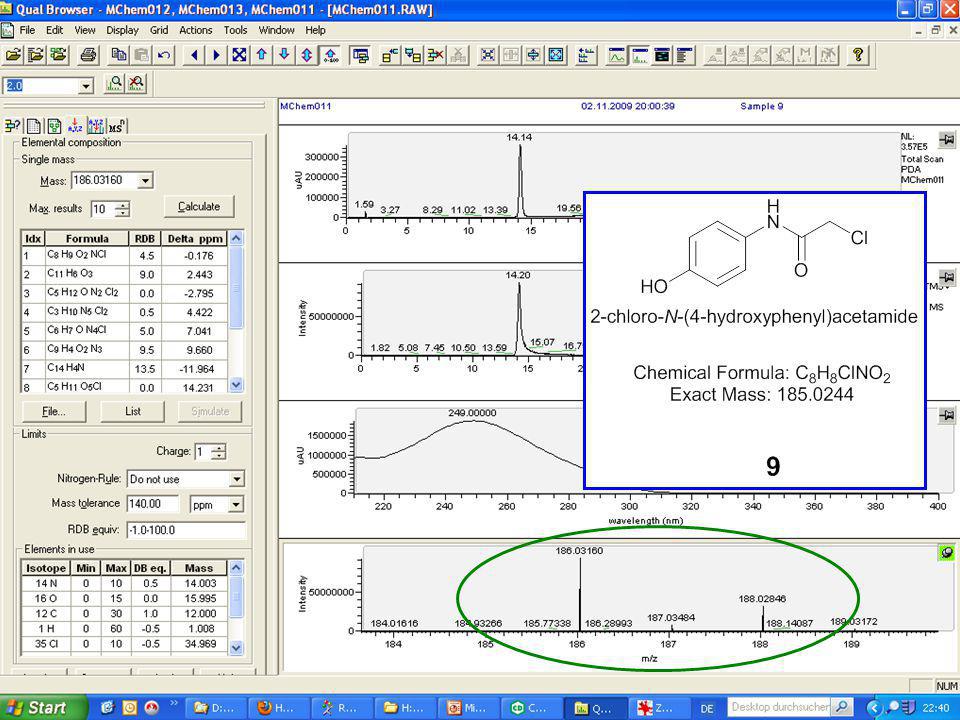
27
ThermoFinnigan LTQ Orbitrap,
Determining molecular formulae by HR-ESI/MS ThermoFinnigan LTQ Orbitrap, Xcalibur software examples from MChem group practicals 2009 (Rainer Ebel)
")
29
[M+H]+
![[M+H]+](http://slideplayer.com/slide/2486882/9/images/29/%5BM%2BH%5D%2B.jpg "[M+H]+")
33
[M+Na]+
![[M+Na]+](http://slideplayer.com/slide/2486882/9/images/33/%5BM%2BNa%5D%2B.jpg "[M+Na]+")
36
Analysis of isotope patterns
experimental calculated “monoisotopic peak” (mainly 12C713C1H935Cl14N16O2)
")
37
5 Minute Problem #2 Al Kaloid, an Honours Chemistry Student at Slug State University has synthesised either A or B below. He is uncertain which one it is but he’s tabulated the 13C NMR shifts and their multiplicities. Can you help Al by determining which one it is? A B

38
Answer Base Values:

39
ChemDraw

40
The NMR effect

41
Spin-spin coupling (splitting)
No coupling Coupling

42
Spin-spin coupling (splitting)
")
43
Origin of spin-spin coupling

44
Coupling in ethanol

45
Coupling is mutual

46
Coupling in ethanol To see why the methyl peak is split into a triplet, let’s look at the methylene protons (CH2). There are two of them, and each can have one of two possible orientations- aligned with, or against the applied field This gives rise to a total of four possible states: Hence the methyl peak is split into three, with the ratio of areas 1 : 2 : 1

47
Coupling in ethanol Similarly, the effect of the methyl protons on the methylene protons is such that there are 8 possible spin combinations for the three methyl protons: The methylene peak is split into a quartet. The areas of the peaks have the ratio of 1:3:3:1.

48
Pascal’s triangle n relative intensity multiplet 0 1 singlet
doublet triplet quartet quintet sextet septet

49
Coupling patterns

50
First Order In CH3CH2OH we could explain coupling by the n + 1 rule, this is called 1st order coupling

51
Second Order Like CH3CH2OH expect 7 lines but get many more. Dn/J < 6

52
Common Coupled Spin Systems

53
Common Coupled Spin Systems

54
Complex 1st Order Spin Systems

55
Iterative application of the n + 1 rule

56
5 Minute Problem #3. Given the 1H NMR chemical shifts and coupling constants for allyl alcohol, explain the observed spectrum (OH peak omitted)
.")
57
A doubled quartet (dq)
")
58
What about this?

59
ddt

61
Spin Simulation Real Spectrum

62
Pro-R and Pro-S 1

63
Homotopic, Enantiotopic, Diastereotopic

64
Methyl groups

65
Chemical Equivalence/Magnetic Non Equivalence

66
What is going on?

67
Result Expect:

68
Using Coupling Constants

70
Glucose

72
Glucose

73
5 Minute Problem #4 Work out which of d 2.1 and d 2.5 is equatorial and which is axial. Also work out the 3 dihedral angles for d 2.1, d 2.5, d 2.8, d 6.8. There are also peaks at: 6.80, 1H, d, J = 0.5 Hz; 1.95, 3H, s; 0.93, 9H, s. 30 Hz

75
Solution

76
Removing Couplings Changing Solvents
da ≠ db Each coupled to Hc Jab ≠ Jac CDCl3 Ha, dd Jab ≠ Jac C6D6 da = db Coupled to Hc Jab = Jac Ha, t Jab = Jac

77
Removing Couplings Spin decoupling
Coupling due to Ha is removed See Hb, Hc at db, dc With mutual Jbc CDCl3 irradiated Signal due to Ha disappears CDCl3 Irradiate at 4.11 ppm

78
Spin Decoupling OFF A↓ X ↓ A↓ X↑ A↑ X↓ A↑ X↑

79
Spin Decoupling Two spins, A (nA), X (nX) with JAX
Irradiate nX with RF power, A loses coupling due to X ON A↓ X ↑ ↓ A↑ X↑ ↓ Average of X ↑ and X ↓

80
Nuclear Overhauser Effect

81
Size of NOE

82
Effect of NOE on 13C NMR 10/5/9 3 8 2 6 4 1 7

83
13C – 1H NOE at equilibrium (small molecule)
● C↑H ↓ ●●●● C↓H ↑ ●●●●● C↑H ↑

84
13C – 1H NOE irradiation on H
●● C↓H↓ C ●●● C↑H ↓ Hsat Hsat ●● C↓H ↑ C ●●● C↑H ↑

85
13C – 1H NOE irradiation on H left ON
●● C↓H↓ C ●●● C↑H ↓ Hsat Hsat ●● C↓H ↑ C ●●● C↑H ↑

86
13C – 1H NOE result ● C↓H↓ C ●●●● C↑H ↓ Hsat Hsat ● C ●●●● C↑H ↑

87
1H-1H NOE example H1 H2O H4 H3

88
1H – 1H NOE at equilibrium (small molecule)
S↓I↓ ●● ●● S↑I ↓ S↓I ↑ ●●●● S↑I ↑ nI nS

89
1H – 1H NOE irradiation on S
● S↓I↓ W1S (sat) W1I ●●● ● S↑I ↓ S↓I ↑ W1I W1S (sat) ●●● S↑I ↑ nI nS
 W1I. ●●● ● S↑I ↓ S↓I ↑ W1I. W1S (sat) ●●● S↑I ↑ nI nS.")
90
1H – 1H NOE irradiation on S left ON
● S↓I↓ W1S (sat) W1I ●●● ● S↑I ↓ W1I W1S (sat) ●●● S↑I ↑
 W1I. ●●● ● S↑I ↓ W1I. W1S (sat) ●●● S↑I ↑")
91
1H – 1H NOE result ½ S↓I↓ W1S (sat) W1I ●●●½ ½ S↑I ↓ W1I W1S (sat)
nI nS

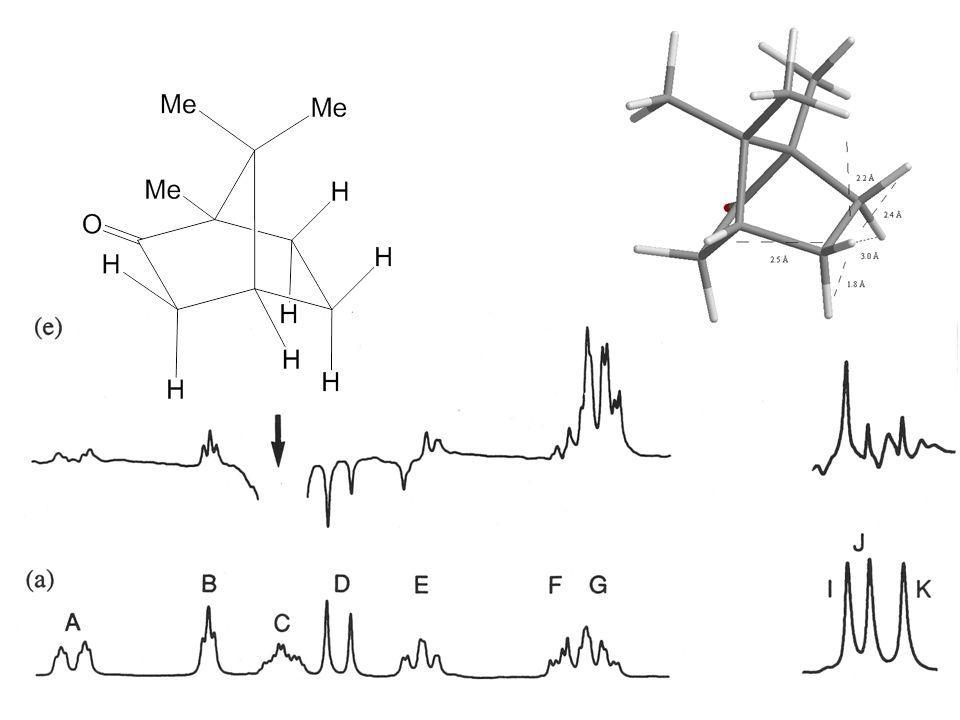
92
NOE 3D example

93
NOE 3D example

98
Events Accompanying Resonance
Organic Structure Analysis, Crews, Rodriguez and Jaspars

99
ONE-PULSE SEQUENCE Organic Structure Analysis, Crews, Rodriguez and Jaspars

100
ONE-PULSE SEQUENCE (90o)x 1H Preparation Detection
Organic Structure Analysis, Crews, Rodriguez and Jaspars

101
Fourier Transformation
FT

102
Relaxation and Peak Shape

103
Rotational Correlation Time tc
wo = 2pno

104
Nuclear spin Example Atomic mass Atomic number Spin, I
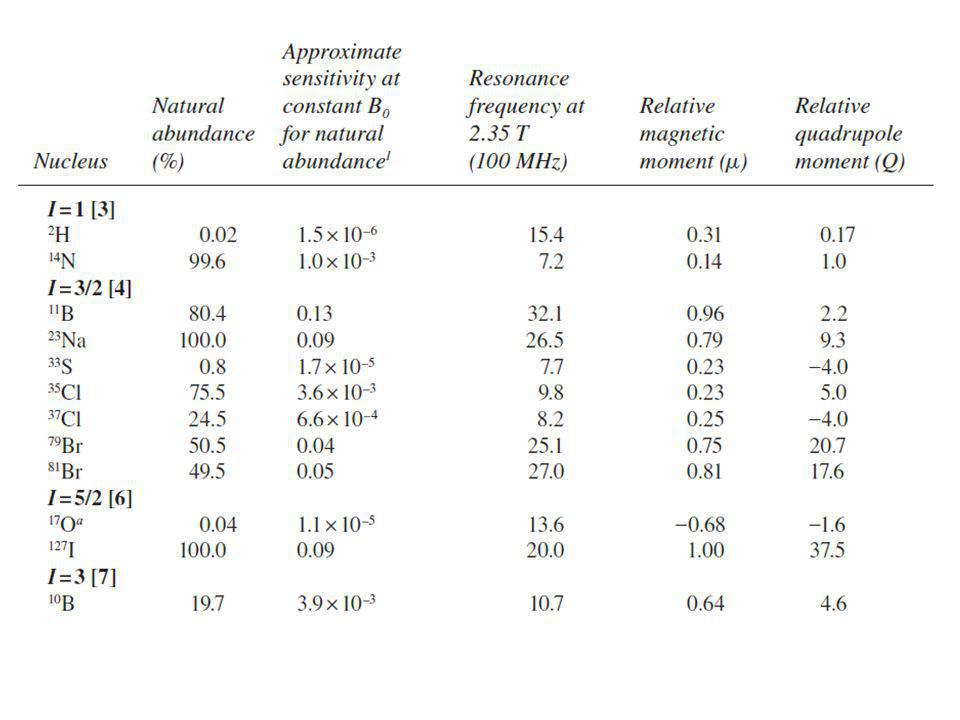
13C, 1H, 17O, 15N, 3H Odd Odd or Even 1/2, 3/2, 5/2 etc 12C, 16O Even 2H, 14N 1, 2, 3 etc 6 1 8 7 1 6 8 1 7

107
Receptivity 29Si 4.7% -5.32 13C 1.1% 6.73 1H 100% 26.75 Nucleus C
Relative g Receptivity Relative receptivity 29Si 4.7% -5.32 13C 1.1% 6.73 1H 100% 26.75

109
Multinuclear NMR

110
15N NMR Shifts

111
31P NMR Shifts

112
Coupling

113
Effect of 31P on 1H NMR

114
Effect of 31P on 1H NMR

115
Effect of 31P on 13C NMR 5 4 3 1

116
The 2nd Dimension

117
BASIC LAYOUT OF A 2D NMR EXPERIMENT
Organic Structure Analysis, Crews, Rodriguez and Jaspars

118
How a 2D NMR experiment works
Contour plot n is the number of increments Organic Structure Analysis, Crews, Rodriguez and Jaspars

119
TYPES OF 2D NMR EXPERIMENTS
AUTOCORRELATED Homonuclear J resolved 1H-1H COSY TOCSY NOESY ROESY INADEQUATE CROSS-CORRELATED Heteronuclear J resolved 1H-13C COSY HMQC HSQC HMBC HSQC-TOCSY Organic Structure Analysis, Crews, Rodriguez and Jaspars

120
STRATEGY BASED ON C-H CONNECTIVITY
& & Organic Structure Analysis, Crews, Rodriguez and Jaspars

121
STRATEGY BASED ON C-H CONNECTIVITY
Organic Structure Analysis, Crews, Rodriguez and Jaspars

122
STRATEGY BASED ON C-H CONNECTIVITY – DEPT DATA
Organic Structure Analysis, Crews, Rodriguez and Jaspars

123
STRATEGY BASED ON C-H CONNECTIVITY – HSQC DATA
A B C D E F dC f e d’ d c b a Organic Structure Analysis, Crews, Rodriguez and Jaspars

124
STRATEGY BASED ON C-H CONNECTIVITY – HSQC DATA
ATOM dC (ppm) DEPT dH (ppm) A 131 CH 5.5 B 124 5.2 C 68 4.0 D 42 CH2 3.0 2.5 E 23 CH3 1.5 F 17 1.2 Organic Structure Analysis, Crews, Rodriguez and Jaspars
 DEPT. dH (ppm) A CH B C D. 42. CH E. 23. CH F Organic Structure Analysis, Crews, Rodriguez and Jaspars.")
125
STRATEGY BASED ON C-H CONNECTIVITY – HSQC DATA
Organic Structure Analysis, Crews, Rodriguez and Jaspars

126
STRATEGY BASED ON C-H CONNECTIVITY – HSQC DATA
Organic Structure Analysis, Crews, Rodriguez and Jaspars

127
STRATEGY BASED ON C-H CONNECTIVITY – HSQC DATA
Organic Structure Analysis, Crews, Rodriguez and Jaspars

128
STRATEGY BASED ON C-H CONNECTIVITY – HSQC DATA
diastereotopic protons Organic Structure Analysis, Crews, Rodriguez and Jaspars

129
STRATEGY BASED ON C-H CONNECTIVITY – COSY DATA
Organic Structure Analysis, Crews, Rodriguez and Jaspars

130
STRATEGY BASED ON C-H CONNECTIVITY – COSY DATA
ATOM dC (ppm) DEPT dH (ppm) COSY (HH) A 131 CH 5.5 b, c, d/d’, f B 124 5.2 a, d/d’, f C 68 4.0 a, d/d’, e D 42 CH2 3.0 2.5 a, b, c, d, e E 23 CH3 1.5 c, d/d’ F 17 1.2 a, b Organic Structure Analysis, Crews, Rodriguez and Jaspars
 DEPT. dH (ppm) COSY (HH) A CH b, c, d/d’, f. B a, d/d’, f. C a, d/d’, e. D. 42. CH a, b, c, d, e. E. 23. CH c, d/d’ F a, b. Organic Structure Analysis, Crews, Rodriguez and Jaspars.")
131
STRATEGY BASED ON C-H CONNECTIVITY – COSY DATA
Organic Structure Analysis, Crews, Rodriguez and Jaspars

132
STRATEGY BASED ON C-H CONNECTIVITY – COSY DATA
Organic Structure Analysis, Crews, Rodriguez and Jaspars

133
STRATEGY BASED ON C-H CONNECTIVITY – COSY DATA
HSQC suggests diastereotopic protons: 3.08/2.44 ppm 1.86/2.07 ppm Organic Structure Analysis, Crews, Rodriguez and Jaspars

134
STRATEGY BASED ON C-H CONNECTIVITY – HMBC DATA
And many more… Organic Structure Analysis, Crews, Rodriguez and Jaspars

135
STRATEGY BASED ON C-H CONNECTIVITY – HMBC DATA
ATOM dC (ppm) DEPT dH (ppm) COSY (HH) HMBC (CH) A 131 CH 5.5 b, c, d/d’, f b, c, d, f B 124 5.2 a, d/d’, f a, d, f C 68 4.0 a, d/d’, e a, d, e D 42 CH2 3.0 2.5 a, b, c, d, e a, b, c, e E 23 CH3 1.5 c, d/d’ c, d F 17 1.2 a, b Organic Structure Analysis, Crews, Rodriguez and Jaspars
 DEPT. dH (ppm) COSY (HH) HMBC (CH) A CH b, c, d/d’, f. b, c, d, f. B a, d/d’, f. a, d, f. C a, d/d’, e. a, d, e. D. 42. CH a, b, c, d, e. a, b, c, e. E. 23. CH c, d/d’ c, d. F a, b. Organic Structure Analysis, Crews, Rodriguez and Jaspars.")
136
STRATEGY BASED ON C-H CONNECTIVITY – HMBC DATA
Organic Structure Analysis, Crews, Rodriguez and Jaspars

137
STRATEGY BASED ON C-H CONNECTIVITY – HMBC DATA
Organic Structure Analysis, Crews, Rodriguez and Jaspars

138
STRATEGY BASED ON C-H CONNECTIVITY – HMBC DATA
Organic Structure Analysis, Crews, Rodriguez and Jaspars

139
Combinatorial explosion
STRATEGY BASED ON C-H CONNECTIVITY RETROSPECTIVE CHECKING Combinatorial explosion Pieces: Possibilities: Organic Structure Analysis, Crews, Rodriguez and Jaspars

140
STRATEGY BASED ON C-H CONNECTIVITY RETROSPECTIVE CHECKING
And similarly for COSY data Organic Structure Analysis, Crews, Rodriguez and Jaspars

141
PROSPECTIVE CHECKING Pieces:
Organic Structure Analysis, Crews, Rodriguez and Jaspars

142
2D EXERCISE 1. For a simple organic compound the mass spectrum shows a
molecular ion at m/z 98. The following data has been obtained from various 1D and 2D NMR experiments. Using this information determine the structure of the molecule in question and rationalise the 2D NMR data given. Atom dC (ppm) dH (ppm) 1H - 1H COSY (3 bond only) 1H 13C Long range (2 - 3 bonds) A 218 s - A-b, A-c, A-d, A-e B 47 t 1.8 dd b-d B-c, B-d, B-e, B-f C 38 t 2.3 m c-e C-b, C-d, C-e D 32 d 1.5 m d-b, d-e, d-f D-b, D-c, D-e, D-f E 31 t 2.2 m e-c, e-d E-b, E-c, E-d, E-f F 20 q 1.1 d f-d F-b, F-d, F-e Organic Structure Analysis, Crews, Rodriguez and Jaspars
 dH (ppm) 1H - 1H COSY. (3 bond only) 1H 13C Long range. (2 - 3 bonds) A. 218 s. - A-b, A-c, A-d, A-e. B. 47 t. 1.8 dd. b-d. B-c, B-d, B-e, B-f. C. 38 t. 2.3 m. c-e. C-b, C-d, C-e. D. 32 d. 1.5 m. d-b, d-e, d-f. D-b, D-c, D-e, D-f. E. 31 t. 2.2 m. e-c, e-d. E-b, E-c, E-d, E-f. F. 20 q. 1.1 d. f-d. F-b, F-d, F-e. Organic Structure Analysis, Crews, Rodriguez and Jaspars.")
143
An additional peak is present in the 1H NMR at 11.6 ppm (bs). Atom
2D EXERCISE 2. For a simple organic compound the mass spectrum shows a molecular ion at m/z 114. The following data has been obtained from various 1D and 2D NMR experiments. Using this information determine the structure of the molecule in question and rationalise the 2D NMR data given. An additional peak is present in the 1H NMR at 11.6 ppm (bs). Atom dC (ppm) dH (ppm) 1H - 1H COSY (3 bond only) 1H 13C Long range (2 - 3 bonds) A 178 s - A-d, A-b B 136 d 5.7 m b-c, b-d B-d, B-c, B-e C 118 d 5.5 m c-b, c-e C-b, C-d, C-e, C-f D t 3.0 d d-b D-b, D-c E t 2.1 m e-c, e-f E-b, E-c, E-f F 13 q 1.0 t f-e F-c, F-e Organic Structure Analysis, Crews, Rodriguez and Jaspars
. Atom. dC (ppm) dH (ppm) 1H - 1H COSY. (3 bond only) 1H 13C Long range. (2 - 3 bonds) A. 178 s. - A-d, A-b. B. 136 d. 5.7 m. b-c, b-d. B-d, B-c, B-e. C. 118 d. 5.5 m. c-b, c-e. C-b, C-d, C-e, C-f. D. 38 t. 3.0 d. d-b. D-b, D-c. E. 25 t. 2.1 m. e-c, e-f. E-b, E-c, E-f. F. 13 q. 1.0 t. f-e. F-c, F-e. Organic Structure Analysis, Crews, Rodriguez and Jaspars.")
Similar presentations


>")

 NMR Spectroscopy>")
 depends on molecular structure and solvent>")


