Download presentation
Presentation is loading. Please wait.

1
Emerging Growth: Mid- Decade Economic Trends University of North Texas Center for Economic Development and Research http://cedr.unt.edu July 2014

2
Source: Bureau of Economic Analysis U. S. Real GDP Growth Annual Percentage Change 2013: 1.9%

3
Source: Bureau of Economic Analysis Real Economic Growth Gross domestic product 2010 2011 2012 2013 ’14 1Q 2014: -2.9%

4
Source: U.S. Bureau of Labor Statistics 2012 2013 2014 Nonfarm Payrolls Monthly change, in thousands June 2014: 288,000

5
Nonfarm Payrolls 2008-Present Monthly change, in thousands Source: U.S. Bureau of Labor Statistics

6
2012 2013 2014 Source: Challenger, Gray and Christmas Human Sacrifice Number of layoff announcements in the U. S. (in thousands) Jun ’14: 31,434
 Jun ’14: 31,434.")
7
Source: Challenger, Gray and Christmas Human Sacrifice 2008-Present Number of layoff announcements in the U. S. (in thousands)
.")
8
U. S. Jobless Rate Seasonally adjusted June ’14: 6.1% Source: U.S. Bureau of Labor Statistics 2013 2014

9
Source: U.S. Department of Commerce; Bureau of Economic Analysis May ’14: $14.6 trillion 2013 2014 Personal Income Total personal income in trillions of dollars, before taxes, at seasonally adjusted annual rates

10
Source: U.S. Department of Commerce; Bureau of Economic Analysis Personal Income 2000-13 Total personal income in trillions of dollars, before taxes, at seasonally adjusted annual rates

11
Source: U.S. Department of Commerce; Bureau of Economic Analysis 2013 2014 Personal Consumption In trillions May ’14: $11.8 trillion

12
Source: U.S. Department of Commerce; Bureau of Economic Analysis Personal Consumption 2000-13 In trillions

14
Source: U.S. Commerce Department June 2014: $439.9 billion 2013 2014 Retail Sales Total retail sales in billions of dollars, seasonally adjusted

15
Source: U.S. Commerce Department Retail Sales 2007-Present Total retail sales in billions of dollars, seasonally adjusted

16
Source: Federal Reserve Board June 2014: 103.9 Industrial Production Index, 2007=100, seasonally adjusted

17
Source: U.S. Department of Commerce Construction Spending In billions of dollars, seasonally adjusted 2013 2014 May 2014: $956.1 billion

18
Source: Commerce Department Construction Spending 2007-Present In billions of dollars, seasonally adjusted

19
Sources: U.S. Department of Commerce; U.S. Department of H.U.D.; U.S. Census Bureau Housing Starts New private housing starts during the month, in thousands, at seasonally adjusted annual rates. 2013 2014 June ’14: 893,000

20
Housing Starts 2000-13 New private housing starts during the month, in thousands, at seasonally adjusted annual rates. Sources: U.S. Department of Commerce; U.S. Department of H.U.D.; U.S. Census Bureau

21
Sources: Dallas Morning News; Residential Strategies Dallas-Fort Worth Home Starts (in thousands) 43.8 20.8
")
22
Sources: Dallas Morning News; National Association of Home Builders Dallas-Ft. Worth Home Permits Issued (in thousands) 36.2 20.8 49.6
")
23
New-Home Sales Single-family homes (in thousands) May 2014: 504,000 2012 2013 2014 Sources: U.S. Department of Commerce; U.S. Department of H.U.D.; U.S. Census Bureau

24
Source: The National Association of Realtors Existing-Home Sales Annual rate, in millions of dwelling units. May 2014: 4.89 million

25
2000:Q12013:Q22013:Q3Low PointDate of Low Point United States62.869.364.540.42006 : Q3 Los Angeles40.228.321.11.82006 : Q3 New York42.129.8235.12006 : Q3/Q4 Miami58.857.854.5102007 : Q1 Austin57.564.262.949.92000 : Q4 Dallas65.363.460.453.72007 : Q3 Houston66.26461.547.42007 : Q3 San Antonio63.368.765.746.52006 : Q3 Source: NAHB - Wells Fargo Housing Opportunity Index Lower Prices and Interest Rates Helping Housing Affordability (Percent of homes sold for which the median family income could qualify) Original Slide provided by K. Phillips, FRB-Dallas; Updated by CEDR

26
Productivity Nonfarm business productivity, percent change from previous quarter at annual rate, seasonally adjusted 1Q 2014: -3.2% 2010 2011 2012 2013 ’14 Source: U.S. Bureau of Labor Statistics

27
Producer Prices Percentage change from previous month for final demand goods, seasonally adjusted. 2013 2014 Source: U.S. Bureau of Labor Statistics June 2014: 0.4% 00

28
Consumer Prices Percentage change, month to month (seasonally adjusted) 2013 2014 Source: U.S. Bureau of Labor Statistics June 2014: 0.3% 0

29
Source: The Conference Board Consumer Confidence Index From a monthly survey of 5,000 U. S. households, 1985 = 100 2013 2014 June 2014: 85.2

30
Consumer Confidence: 2007-Present From a monthly survey of 5,000 U. S. households, 1985 = 100 Source: The Conference Board

31
Leading Indicators Index of 10 indicators designed to “lead,” or predict overall economic activity; 2004 = 100. June 2014: 102.2 2011 2012 2013 2014

33
Things to Worry About Pace of job growth Unfunded pension liabilities European sovereign default Corporate and consumer debt Federal Deficits/Debt Social Security / Medicare / Healthcare impact on taxes Political gridlock Environmental regulations Market volatility

34
Source: Congressional Budget Office Budget Deficit In billions of dollars 2012: -$1.09 trillion 2013: -$679.5 billion 2014 Projected: -$492 billion 2015 Projected: -$469 billion 2016 Projected: -$536 billion

35
Source: U.S. Department of Commerce International Goods & Services Trade Deficit Billions of dollars, seasonally adjusted. Import figures exclude shipping and insurance. 2013 2014 May 2014: $44.4 billion

36
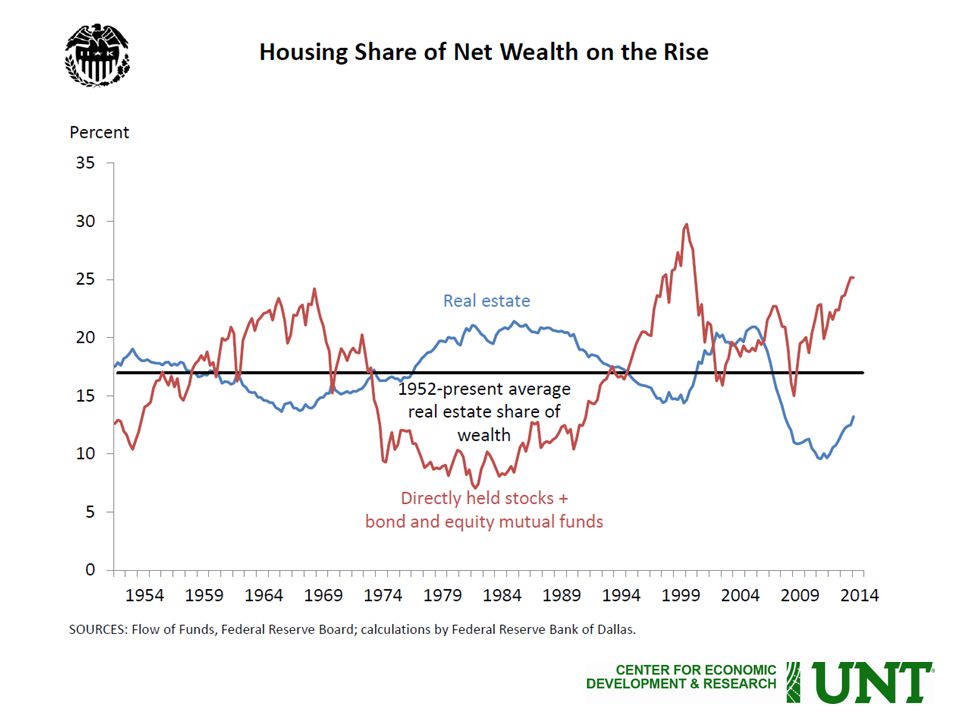
Source: Federal Reserve Board Household Net Worth In trillions 2010 2011 2012 2013 ’14 1Q 2014: $81.8 trillion

38
Sources: Administrative Office of the U.S. Courts Personal Bankruptcy Filings Fiscal Years ending Sept. 30 (in millions)
.")
39
Business Bankruptcies 199937,884200728,322 200035,472200843,546 200140,099200960,837 200238,540201056,282 200335,037201147,806 200434,317201240,075 200539,201201333,212 200619,695--- Sources: Administrative Office of the U.S. Courts

40
Source: U.S. Department of Commerce; Bureau of Economic Analysis May ’14: 4.8% 2012 2013 2014 Savings Rate As Percentage of Disposable Personal Income

41
Source: U.S. Department of Commerce; Bureau of Economic Analysis Savings Rate 2000-2013 As Percentage of Disposable Personal Income

42
Longest Recession Since 1933 Ended June 2009 Federal Reserve Bank Dallas

48
TXLI Components Changes Mar-Apr-May Source: Federal Reserve Bank Dallas

49
Last Data Entry: May 2014 Source: Federal Reserve Bank of Dallas Texas Leading Index 1981-Present Monthly, Seasonally Adjusted, 1987=100

54
Source: Texas Workforce Commission Unemployment Rates: U.S., Texas, and D/FW Metro U. S. & Texas Seasonally Adjusted *D/FW not Seasonally Adjusted U. S. June 2014 = 6.1% Texas June 2014 = 5.1% D/FW June 2014 = 5.4%

55
Source: Texas Workforce Commission Ft. Worth-Arlington MSA Nonagricultural Employment

56
Dallas-Plano-Irving MD Nonagricultural Employment Source: Texas Workforce Commission

57
Sales and Use Tax Allocations 2010201120122013 % Chg 12-13 Allen24,606,22827,499,53429,874,63431,856,0916.63% Arlington83,143,84886,127,96788,941,22994,043,8105.74% Dallas204,732,898215,394,908232,445,766242,456,2904.31% Fort Worth100,569,555105,424,832112,745,846118,919,4495.48% Frisco40,303,10644,280,59049,889,48858,676,77217.61% Plano58,888,94866,325,56368,410,25169,804,5092.04% Source: Texas Comptroller of Public Accounts

58
Conclusions The US recession is technically over. Employment recovery may not strengthen before mid- 2013 Financial sector risk Texas has performed better than nation We’ve been “lucky puppies” Market / consumer confidence is major headwind Political failure is hurting growth Address deficit, reform taxes, address market volatility Housing market will start recovery Local job market growing

59
Questions? Contact info: tclower@unt.edu 940-565-4049 http://cedr.unt.edu

Similar presentations


 Shall Rise Again – Just you Wait! 48 th ASU/Chase Economic Forecast>")


: The total market value of goods and services.>")


 Q1 2002 – Q4 2012 € Billion GDP GNP.>")


