Download presentation
Presentation is loading. Please wait.

1
Factors that influence primary producers –biomass, productivity, diversity Light Temperature Flow of water Consumers Scouring action of floods Toxic substances Nutrients—Chemical substances required for biomass to grow.—Any of the 13 or 14 essential elements could potentially be growth limiting. All organic compounds require C Proteins require a lot of N and some S Energy stores (ATP) Phospholipids (membranes) and nucleic acids (DNA, RNA) require a lot of phosphorus Membranes also need a lot of K Photosynthetic efficiency is low (light or CO 2 taken up both not converted to biomass) under severe nutrient limitation. Redfield Ratio--C:N:P=106:16:1 for marine plankton, Diatoms, C:Si:N:P = 106:15:16:1.
 Phospholipids (membranes) and nucleic acids (DNA, RNA) require a lot of phosphorus Membranes also need a lot of K Photosynthetic efficiency is low (light or CO 2 taken up both not converted to biomass) under severe nutrient limitation. Redfield Ratio--C:N:P=106:16:1 for marine plankton, Diatoms, C:Si:N:P = 106:15:16:1..")
2
Nutrient limitation of primary producers Productivity and biomass of most unenriched periphyton and phytoplankton communities are usually limited by the availability of Nor P. In rare situations, Si, Fe, or some other trace element (eg Co) prove to be rate limiting For aquatic macrophytes which obtain nutrients from sediment pore water and not the water column, but generally obtain their C from DIC in the water column, DIC can sometimes be the rate limiting factor. Although light is usually the main limiting factor, near the bottom of the photic zone where water is deep, nutrient enrichment (eutrophication, usually with N and P can make whole systems light limited.
 prove to be rate limiting For aquatic macrophytes which obtain nutrients from sediment pore water and not the water column, but generally obtain their C from DIC in the water column, DIC can sometimes be the rate limiting factor. Although light is usually the main limiting factor, near the bottom of the photic zone where water is deep, nutrient enrichment (eutrophication, usually with N and P can make whole systems light limited..")
3
Bioassays can be used to test the responses of algal communities to additions of individual nutrients or mixtures.

4
How do we detect nutrient limitation? Experimentally a)Incubate bottles of water from lakes or rivers, or enclosures of rocks or artificial substrates with different nutrients added, and measure primary productivity and/or algal biomass. The factor that gives the largest growth response is the limiting factor. a)The response can depend on the scale of time and space, so experiments are often done on a large-scale—whole system manipulations. b)The response of primary productivity to nutrient addition is more noticeable in measurements made volumetrically (/m 3 ), than in areal measurements (/m 2 ), where increased light penetration can compensate at least partially for low nutrient supply. Comparative studies—Correlations Measure primary productivity and primary producer biomass in different systems that differ in their resource regimes (eg nutrients, light etc) and see which factor show the best correlation to productivity and biomass.
Incubate bottles of water from lakes or rivers, or enclosures of rocks or artificial substrates with different nutrients added, and measure primary productivity and/or algal biomass. The factor that gives the largest growth response is the limiting factor. a)The response can depend on the scale of time and space, so experiments are often done on a large-scale—whole system manipulations. b)The response of primary productivity to nutrient addition is more noticeable in measurements made volumetrically (/m 3 ), than in areal measurements (/m 2 ), where increased light penetration can compensate at least partially for low nutrient supply. Comparative studies—Correlations Measure primary productivity and primary producer biomass in different systems that differ in their resource regimes (eg nutrients, light etc) and see which factor show the best correlation to productivity and biomass..")
5
Nutrient addition experiments can be carried out on may different spatial and temporal scales Water column enclosures are bags that extend downward—not open at the bottom—usually to the bottom of the photic zone, or to the thermocline.

6
The famous curtain experiment in lake 226. The lake was divided in half by a curtain the half on the right was fertilized with a mixture of C, N and P. The blue half on the left was fertilized with a mixture of C and N. The green colour is due to a massive bloom of colonial cyanobacteria (Anabaena). A large-scale experiment at the Experimental Lakes Area (ELA) in Canada (Schindler et al. 1971)
. A large-scale experiment at the Experimental Lakes Area (ELA) in Canada (Schindler et al. 1971).")
7
Lake 227 in the foreground-26 years of Phosphorus addition Lake 305 in the background—no fertilization

8
Mean annual biomass (as indicated by Chlorophyll a) in lakes is usually best correlated with the phosphorus supply Lakes with poor P supply usually however have much greater benthic algal biomass and productivity, so total biomass(per unit area) is usually much more poorly correlated with nutrient supply in the water column Each point on the graph represents the average value of P and Chl a for a lake.
 in lakes is usually best correlated with the phosphorus supply Lakes with poor P supply usually however have much greater benthic algal biomass and productivity, so total biomass(per unit area) is usually much more poorly correlated with nutrient supply in the water column Each point on the graph represents the average value of P and Chl a for a lake.")
9
Lakes can be classified into trophic categories on the basis of productivity and nutrient measures—however such boundaries are arbitrary. Oligotrophic P<10 Chla<3 Mesotrophic 10<P<40 3< Chla <25 Eutrophic P>40 Chla > 25

10
For ultra-high P levels, chlorophyll a is no longer correlated with P Most such systems have their primary productivity limited by light.

11
Nutrient limitation of stream algae?? Many people speculated that in flowing water nutrient supply would be constantly renewed, so that increasing its concentration would have little effect on algal productivity or biomass. Testing was difficult. It is difficult to make an enclosure in flowing water, and it is hard to fertilize a whole stream because a lot of water is flowing by.

12
Carnation Creek as it looks now—it used to have a densely forested watershed

13
Diatoms communities In mountain streams sometimes Respond to nutrient addition … but not always Why would the community sometimes not respond? Why is the response greater to a combination of N and P than to either alone? The stream was partitioned into troughs and different nutrients were added to each. The Stockner and Shortreed experiment on Vancouver Island.

14
In this nutrient addition experiment, no response was detectable for the first 2 week but as the biomass built up it was clear that the community was responding. Why do you think the algal biomass started to diminish toward the end of the experiment while nutrients were still being added?

15
Diatoms communities In mountain streams sometimes respond to nutrient addition … but not always Why would the community sometimes not respond? Limitation by light—Forest canopy Grazers—sometimes biomass of grazers responds but algae don’t Flood Scouring—after floods there might not be enough biomass available to mount a response to nutrient addition.

16
Awareness of the role of nutrients in eutrophication of waterways led to legislation aimed at controlling nutrient release (eg improved sewage treatment, P-free detergents). Such nutrient abatement measures were often highly successful in restoring water quality In Lake Washington, which formerly received the sewage from Seattle Washington, nutrient diversion had a dramatic effect on the trophic status of the lake Managing releases of nutrients to lakes and rivers

17
Attempts like the Lake Washington experiment, where point source nutrient sources were diverted from the lakes, failed more often than they succeed. Reasons? 1.)Large non-point source nutrient loading 2.) Lake not nutrient limited 3.) Internal loading from P trapped in sediments may have compensated for reduced external loading.
Large non-point source nutrient loading 2.) Lake not nutrient limited 3.) Internal loading from P trapped in sediments may have compensated for reduced external loading..")
18
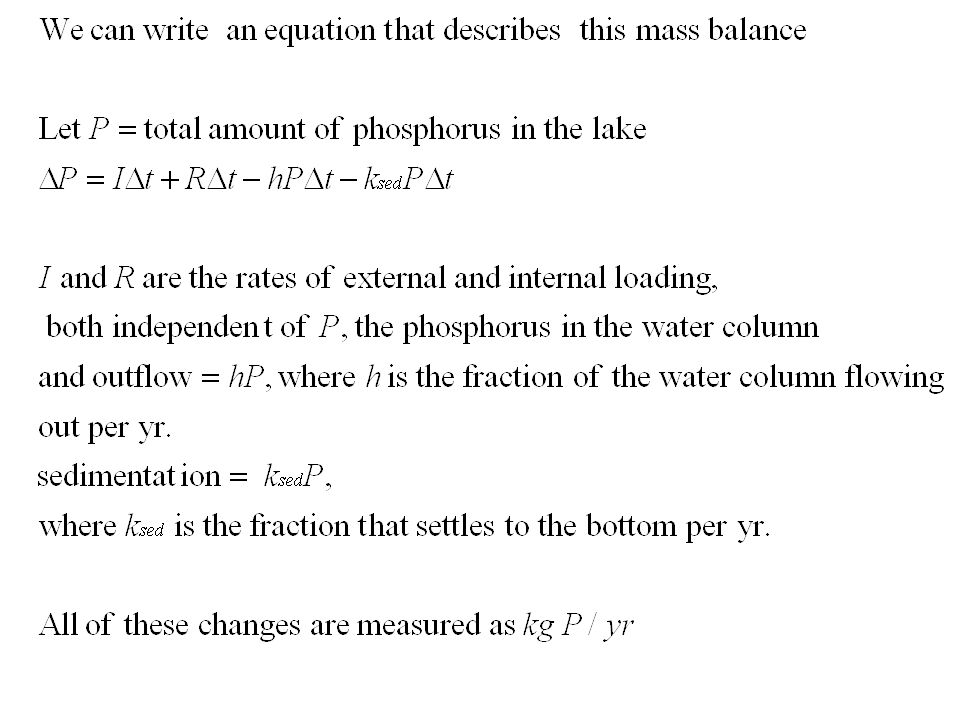
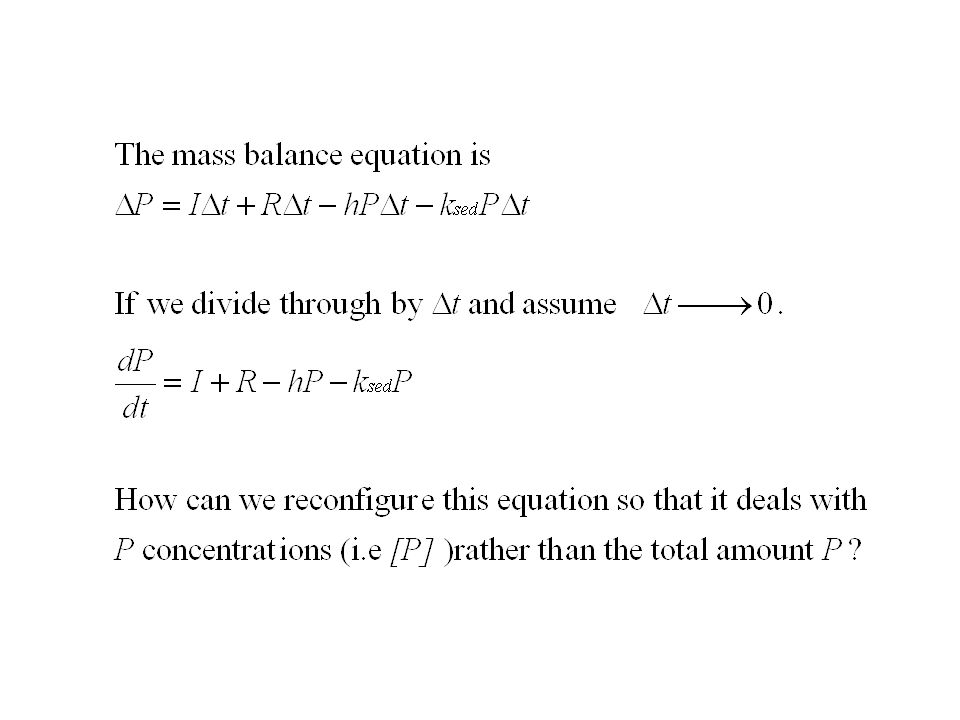
Phosphorus models have played an important role in eutrophication management Since it requires a lot of investment of effort and funds both public and private to improve sewage treatment or build structures to divert point sources, it is best to try to have some idea how well it will work. Modelling incorporates what we know about the important processes involved, and tells us how to expect the lake to respond.

20
(external+internal loading all sources) Sedimentation rate All processes (ie arrows) have the units (kg P/yr) What are the units of h and k sed ? k sed P hP P [P]=P/V single compartment mass balance model Downstream export I+R

25
Example Problem Pigeon lake is an AB lake whose total external P load is 5600 kg/yr, 900 of which is estimated to be the result of cabins and other residential activities around the shoreline, and 1800 of which is estimated to be the result of agricultural activities in the watershed. The present P concentration in the lake water averages 32 mg/m 3. How much would this drop if the cabins and houses were removed and all agricultural activities in the watershed were to cease? The mean depth of the lake is 6.2 m, the Area is 96.7 km 2. The internal load from the basin in this lake has been estimated to be 3000kg/yr. Mean annual outflow of water is 4.5 x 10 6 m 3 /yr. What do we need to assume in order to apply the previous model to this question? What will be the new P concentration in the lake water after the lake reaches equilibrium with the new loading regime?

27
Lakes can be classified into trophic categories on the basis of productivity and nutrient measures—however such boundaries are arbitrary. Oligotrophic P<10 Chla<3 Mesotrophic 10<P<40 3< Chla <25 Eutrophic P>40 Chla > 25

28
A review of some terminology concerning Nutrient inputs External loading (I) -point source (domestic, agricultural or industrial) -non-point source (stream or seepage flows) -atmospheric (wet or dry depostion) Internal loading (R) -return from the sediment (diffusion) Forms of Nutrient -Available for direct uptake by primary producers dissolved free ions e.g. PO 4 -3, NO 3 -, NH 4 + -Non-available particulate—organic or inorganic (e.g. clays, minerals) dissolved organic matter, e.g. sugar phosphates, ATP, amino acids etc We generally model total nutrient pools, because over the residence time scale of nutrients in a lake most unavailable forms will be become available through decomposition or desorption Nutrient Retention by lakes Most lakes tend to retain nutrients--i.e. output flow contains less than inflowing water, with much of the input retained in sediment. Lakes with large internal loadings exhibit “negative retention”.
 dissolved organic matter, e.g. sugar phosphates, ATP, amino acids etc We generally model total nutrient pools, because over the residence time scale of nutrients in a lake most unavailable forms will be become available through decomposition or desorption Nutrient Retention by lakes Most lakes tend to retain nutrients--i.e. output flow contains less than inflowing water, with much of the input retained in sediment. Lakes with large internal loadings exhibit negative retention ..")
29
Although we made rapid progress in curtailing point source nutrient loadings such eg (domestic sewage, feedlots etc) it took longer to realize that nutrient export from the landscape (non-point source loadings) also contributed greatly to eutrophication of lakes and rivers Studies on the nutrient concentrations in stream flow, lead to the concept of watershed nutrient export By studying streams that drain different types of watersheds reflecting different types of land use, it is possilble to determine how land use affects nutrient export from the landscape.
 it took longer to realize that nutrient export from the landscape (non-point source loadings) also contributed greatly to eutrophication of lakes and rivers Studies on the nutrient concentrations in stream flow, lead to the concept of watershed nutrient export By studying streams that drain different types of watersheds reflecting different types of land use, it is possilble to determine how land use affects nutrient export from the landscape.")
30
LandscapeN export coef (kg/km 2 /yr)P export coefN:P Tundra271.419 Boreal forest974.124 Temperate forests300 (130-500)10 (5-12)30 Agricultural land600 (500-1000)30 (5-50)20 Urban700 (500-880)480 (30-1660)<5 Nutrient export rates from undisturbed watersheds are much lower than those measured in disturbed landscapes (e.g. Agricultural and Urban)
.")
31
Primary productivity by aquatic macrophytes is frequently limited by availability of inorganic C, which the leaves take up from the water Aquatic macrophytes don’t respond to N and P additions in the water column and only to sediment fertilizers when sediment is very nutrient poor. Eg sand or gravel Mud always has plenty of N and P.

34
Ocean acidification –the ongoing decrease in the pH of the oceans, caused by uptake of anthropogenic CO 2 from the atmosphere.pHoceansanthropogenic atmosphere Since the industrial revolution surface ocean pH is estimated to have decreased from approximately 8.179 to 8.104 (a change of −0.075). ~25% increase in [H+] NOAA scientists have found large portions of the ocean to be undersaturated in carbonates.NOAA Organisms such as Foraminifera, red algae and coral reefs produce carbonate skeletons and require water to saturated or super saturated. Such organisms help trap carbon and sediment it on the ocean floor, and acidification will greatly impair this process—a strong positive feedback which will gradually reduce the ocean’s capacity to trap carbon

35
Primary productivity by aquatic macrophytes is frequently limited by availability of inorganic C Potamogeton pectinatus is switching to bicarbonate as carbon dioxide becomes depleted in the weed bed Callitriche stagnalis does not have this capability The ability to use bicarbonate depends on the presence of the enzyme carbonic anhydrase which catalyses the hydration of carbon dioxide

36
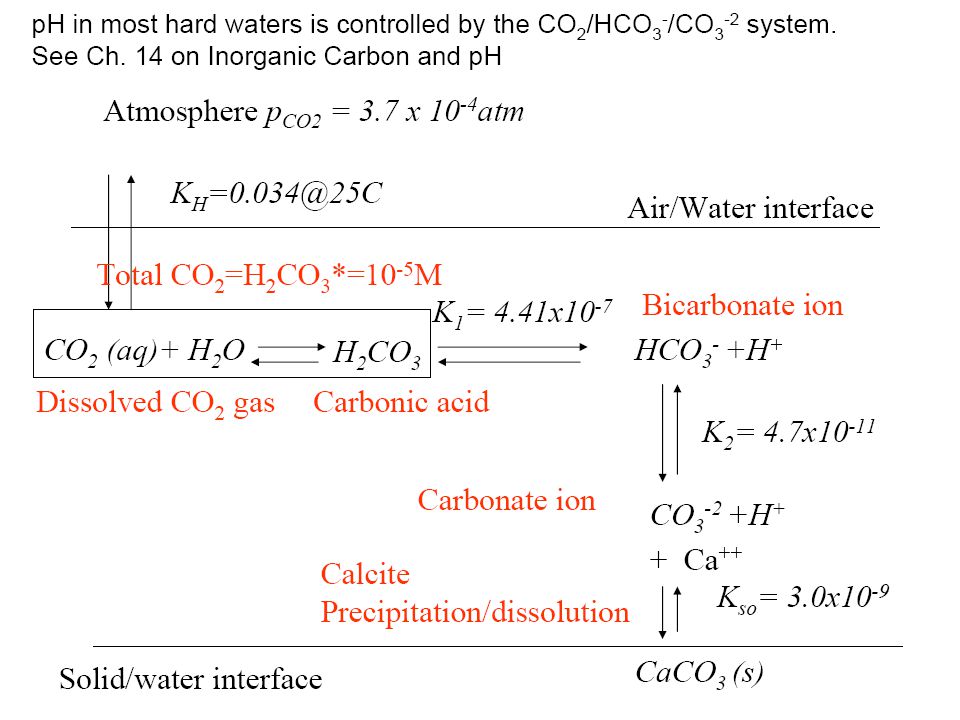
Hard water has more dissolved inorganic C (carbonates and bicarbonates) than soft water. Production, biomass and species diversity of aquatic plants is always higher in hard water lakes and ponds than softwater systems.

38
Carbon in the form of CO 2, HCO 3 - and CO 3 -2, are oxidized forms of C, and tend to be the only forms present where O 2 is plentiful. In anoxic environments methanogens (Archaea) convert organic C and CO 2 into methane (CH 4 ). Methane is a gas and can bubble out of the water or it can be oxidized to CO 2 by methylotrophic bacteria.
 convert organic C and CO 2 into methane (CH 4 ). Methane is a gas and can bubble out of the water or it can be oxidized to CO 2 by methylotrophic bacteria..")
39
http://faculty.plattsburgh.edu/jose.deondarza/images/Organisms/methanogen.jpg Methanogens are not true bacteria, they belong to the Archaea Most methanogens can grow on CO 2 and H 2 as their sole energy source: Chemoautotrophs —chemical bond energy is their energy source they utilize CO 2 as their C source

40
C-transformations in aerobic and anaerobic environments Under anaerobic conditions organic molecules break down to methane instead of CO 2 —This process is facilitated by methanogens (Archaea), which are chemoautotrophic bacteria. They utilize the energy released from 2H 2 + Organic C (CH 2 O)→CH 4 + H 2 0 to build their biomass. -4 +4 0 Oxidation state Where do we find methanogens?
→CH 4 + H 2 0 to build their biomass Oxidation state Where do we find methanogens .")
41
We keep track of the e - transfer using Oxidation numbers (Ox#) For each e - transferred the Ox# changes by 1 2H 2 + O 2 2H 2 O 00+1-2 Some rules for Oxidation numbers 1. In free elements Ox# =0 2. For ions with one atom Ox# = charge. eg H + Ox# of H + = 1 3. Ox# of O in most compounds is -2, 4. Ox# of H in most compounds is +1, 5. For a complex ion like SO 4 -2, the net Ox# = charge (Thus S=+6) How to assign Oxidation numbers
 How to assign Oxidation numbers.")
42
Carbon and Oxygen play a major role in biological energy transformations Oxidation means giving up electrons, and reduction means taking on electrons (─) The oxidation state of C in CO 2 is +4, in Carbohydrates is 0 How many electrons are taken up by each C during photosynthesis?
 The oxidation state of C in CO 2 is +4, in Carbohydrates is 0 How many electrons are taken up by each C during photosynthesis")
Similar presentations


 Problem Description: Networked Aquatic Microbial Observing System (NAMOS) Proposed.>")
 of phytoplankton can be measured directly by O.>")


