Download presentation
Presentation is loading. Please wait.

1
Chemsheets AS006 (Electron arrangement)
06/04/2017 IR SPECTROSCOPY 2 © A Jul-12

2
Light is one form of electromagnetic radiation.
Light is only a very small part of the electromagnetic spectrum. Electromagnetic waves consist of electric and magnetic fields which are perpendicular to each other and to the direction of travel of the wave. The electric and magnetic fields vibrate at the same frequency as each other.

3
THE ELECTROMAGNETIC SPECTRUM

4
Atoms, molecules and ions can absorb (or emit) electromagnetic radiation of specific frequencies, and this can be used to identify them. Electromagnetic radiation absorbed What the energy is used for Spectroscopy technique Ultra-violet / visible Movement of electrons to higher energy levels Ultra-violet / visible spectroscopy Infra-red To vibrate bonds Infra-red spectroscopy Microwaves To rotate molecules Microwave spectroscopy Radio waves To change nuclear spin NMR spectroscopy © A Jul-12

5
INFRA-RED SPECTROSCOPY
All bonds vibrate at a characteristic frequency. There are different types of vibration. Symmetric stretch Assymmetric stretch Bending The frequency depends on the mass of the atoms in the bond, the bond strength, and the type of vibration. The frequencies at which they vibrate are in the infra-red region of the electromagnetic spectrum.

6
INFRA-RED SPECTROSCOPY
If IR light is passed through the compound, it will absorb some or all of the light at the frequencies at which its bonds vibrate. Wavenumbers (cm-1) are used as a measure of the wavelength or frequency of the absorption. Wavenumber = wavelength (cm) IR light absorbed is in the range 4000 – 400 cm-1. Above 1500 cm-1 is used to identify functional groups. Below 1500 cm-1 is used for fingerprinting. © A Jul-12
 are used as a measure of the wavelength or frequency of the absorption. Wavenumber = 1. wavelength (cm) IR light absorbed is in the range 4000 – 400 cm-1. Above 1500 cm-1 is used to identify functional groups. Below 1500 cm-1 is used for fingerprinting. © A Jul-12.")
7
BELOW 1500 cm-1 – “Fingerprinting”
Complicated and contains many signals – picking out functional group signals difficult. This part of the spectrum is unique for every compound, and so can be used as a "fingerprint". This region can also be used to check if a compound is pure. © A Jul-12

9
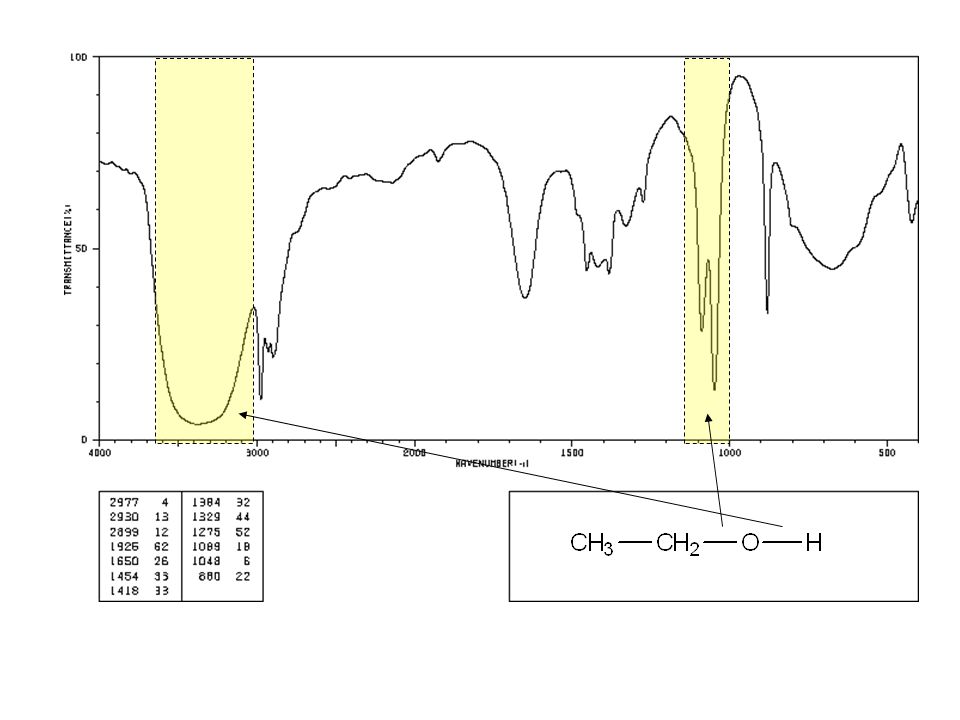
Alcohol O-H ( cm-1)
")
10
Acid O-H ( cm-1)
")
11
C=O ( cm-1)
")
12
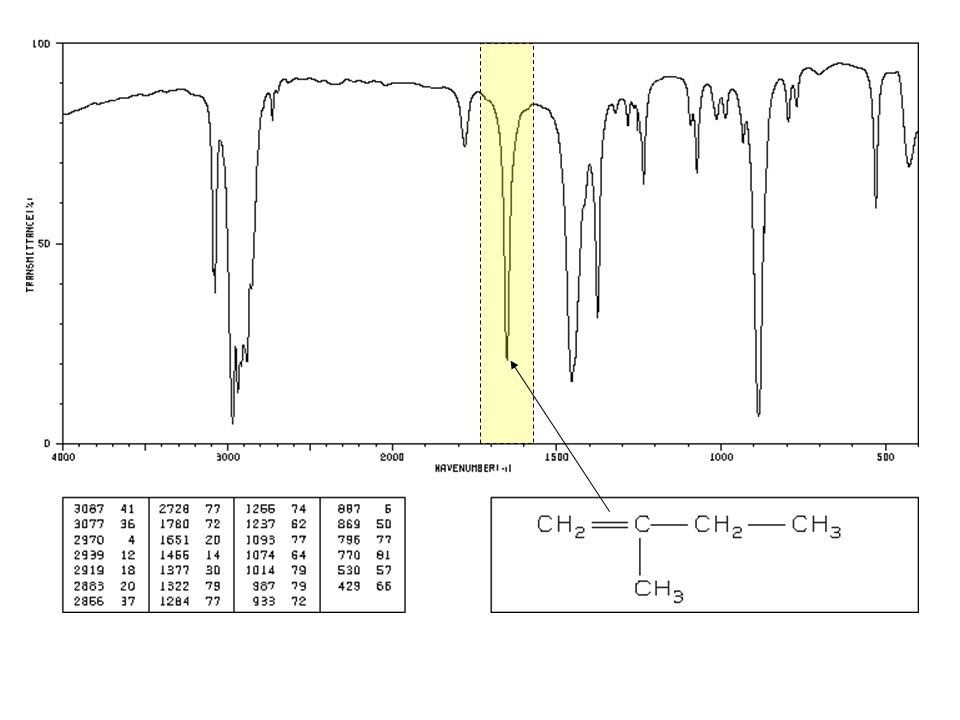
C=C ( cm-1)
")
13
C-H ( cm-1)
")
14
C≡N ( cm-1)
")
27
TASK 1 3-methylbutanoic acid butyl methanoate ethanenitrile propanal
2,2-dimethylamine 2-methylbut-1-ene 3-methylbutan-1-ol 4-hydroxybutanone 3-methylbutanoic acid butyl methanoate ethanenitrile propanal

28
TASK 1 3-methylbutanoic acid butyl methanoate ethanenitrile propanal
2,2-dimethylamine 2-methylbut-1-ene 3-methylbutan-1-ol 4-hydroxybutanone 3-methylbutanoic acid butyl methanoate ethanenitrile propanal

29
TASK 2 butanoic acid butanone but-3-en-1-ol 2-methylpropan-2-ol
2-ethylbutan-1-ol pent-1-ene

30
TASK 3 1) Propene reacts with HBr to form H. H reacts with sodium hydroxide to form I, and I reacts with warm acidified potassium dichromate (VI) to form J. The infra-red spectra of H, I and J are given below, but it does indicate which is which. Identify the three compounds H, I and J, using the infra-red spectra below, and decide which spectrum belongs to which compound.
 Propene reacts with HBr to form H. H reacts with sodium hydroxide to form I, and I reacts with warm acidified potassium dichromate (VI) to form J. The infra-red spectra of H, I and J are given below, but it does indicate which is which. Identify the three compounds H, I and J, using the infra-red spectra below, and decide which spectrum belongs to which compound.")
31
TASK 3 2) Compound E, which is a branched chain haloalkane, was found to have the composition by mass of 39.8% C, 7.3% H, and 52.9% Br. There were two peaks for the molecular ions in the spectrum at 150 and 152, of approximately equal intensity. E reacts with sodium hydroxide to form F, whose infra-red spectrum is shown. F does not undergo dehydration with concentrated sulphuric acid. F reacts further with acidified potassium dichromate (VI) to form G, whose infra red spectrum is also shown. Draw the structures and name E, F and G. Identify the species responsible for the peaks at 150 and 152 in the mass spectrum of E.
 Compound E, which is a branched chain haloalkane, was found to have the composition by mass of 39.8% C, 7.3% H, and 52.9% Br. There were two peaks for the molecular ions in the spectrum at 150 and 152, of approximately equal intensity. E reacts with sodium hydroxide to form F, whose infra-red spectrum is shown. F does not undergo dehydration with concentrated sulphuric acid. F reacts further with acidified potassium dichromate (VI) to form G, whose infra red spectrum is also shown. Draw the structures and name E, F and G. Identify the species responsible for the peaks at 150 and 152 in the mass spectrum of E.")
Similar presentations


>")
>")


 rays at.>")
. Overview Elemental microanalysis Mass spectroscopy Infra-red spectroscopy NMR spectroscopy X-ray crystallography.>")


