Download presentation
Presentation is loading. Please wait.

1
Turkey’s Energy Policies Between East and West Bilkent University A. Necdet PAMİR General Coordinator Center for Eurasian Strategic Studies (ASAM) February 21, 2006
 February 21,")
2
Percentage of resources in primary energy demand (%) end 2003 Reference: BP Statistical World Review of Energy, June 2005
 end 2003 Reference: BP Statistical World Review of Energy, June 2005")
3
World Primary Energy Demand Fossil fuels will continue to dominate the global energy mix, while oil remains the leading fuel Oil Natural gas Coal Nuclear power Hydro power Other renewables 0 1 000 2 000 3 000 4 000 5 000 6 000 7 000 1970198019902000201020202030 Mtoe 0 1 000 2 000 3 000 4 000 5 000 6 000 7 000 1970198019902000201020202030 Mtoe

4
Source: International Energy Agency, 2004

5
World Recoverable Oil Reserves (billion barrels) 101,2 112,2 733,9 120,8 18,4 61 41,1 Source: BP Statistical World Review, June 2005 Total: 1188,6 billion barrels Reserve/Production: 41 years
 101,2 112,2 733,9 120,8 18, ,1 Source: BP Statistical World Review, June 2005 Total: 1188,6 billion barrels Reserve/Production: 41 years")
6
World Exploration & Production Costs ($/barrel) N. Sea 9.85 Gulf of Mexico 9.0 Alaska 5.7 S. America (excl. Mek., Ven., Brasil) 5.52 Mexico 7.2 W. Siberia 7.0 Kazakhistn 7.0 İran 4.5 Iraq 2.5 Algeria 7.0 Angola 9.0 Nigeria 5.75 Canada Oil sands 8.41(?) Indonesia 10.5 S. Arabia 4.0 W. Canada Konvns: 9.0 E. Canada 10.0 Source: CERA Brasil 12.50 Venezuella 4.23 (ağır petrol hariç) China (onshore) 8.90 China (offshore) 11.80
 5.52 Mexico 7.2 W. Siberia 7.0 Kazakhistn 7.0 İran 4.5 Iraq 2.5 Algeria 7.0 Angola 9.0 Nigeria 5.75 Canada Oil sands 8.41( ) Indonesia 10.5 S. Arabia 4.0 W. Canada Konvns: 9.0 E. Canada 10.0 Source: CERA Brasil Venezuella 4.23 (ağır petrol hariç) China (onshore) 8.90 China (offshore)")
7
World Recoverable Gas Reserves (trillion cubic meters) 7,32 7,1 14,06 72,8 5,6 58,51 14,2 Kaynak: BP Statistical World Review, Haziran 2005 Total: 179,5 trillion m 3 R/P: 67 years
 7,32 7,1 14,06 72,8 5,6 58,51 14,2 Kaynak: BP Statistical World Review, Haziran 2005 Total: 179,5 trillion m 3 R/P: 67 years")
8
World Recoverable Coal Reserves (billion tons) R/P: 164 Homogenous distribution 254,4 19,8 50 296,8 227 60 Total: 909,6 billion tons Kaynak: BP Statistical World Review, Haziran 2005
 R/P: 164 Homogenous distribution 254,4 19, , Total: 909,6 billion tons Kaynak: BP Statistical World Review, Haziran 2005")
9
Global Reserve Additions from Discoveries & Global Production In the last decade, discoveries of new fields have replaced only half the oil produced

10
Inter-Regional Trade in World Fossil-Fuel Supply Energy trade between regions more than doubles by 2030, most of it still in the form of oil

15
Caspian Oil Production to 2010

16
West Africa Oil Production to 2010 Nijerya Angola

18
Significance of OPEC and Persian Gulf (2001-2025) (million barrels per day) 20012025 OPEC Exports Mb/d(%)Mb/d(%) 24.944.254.460.8 OPEC Gulf Exports Mb/d(%)Mb/d (%) 16.930.036.440.7 Source: EIA, May 2004
 (million barrels per day) OPEC Exports Mb/d(%)Mb/d(%) OPEC Gulf Exports Mb/d(%)Mb/d (%) Source: EIA, May 2004")
19
Importance of the Persian Gulf

22
Contribution of Regions to World Oil Supply (million barrels per day)
")
23
Major Net Inter-Regional Oil Trade Flows Inter-regional oil trade doubles by 2030, with most of the additional exports coming from the Middle East

24
Oil Flows & Major Chokepoints: The “Dire Straits” The risk of an oil-supply disruption will grow as trade and flows through key maritime and pipeline chokepoints expand

25
Dünya Ekonomisinde Büyüme

26
Bölgesel Büyümede Farklılık

27
Gelişen Asya, Yakıt Talebi ve Emisyonda Sürükleyici

28
Amount of energy consumed to produce 1 unit of GDP US: 1,5 EU: 1 Russia: 8,5 China: 6,5

29
Energy Intensity (Green Paper)
")
30
Toplam Enerji Yatırım Gereksinimi (2003- 2030) 2003 – 2030 yılları arasında, küresel enerji yatırımlarının % 65’i elektrik üretimine ayrılacak G K P E
 2003 – 2030 yılları arasında, küresel enerji yatırımlarının % 65’i elektrik üretimine ayrılacak G K P E")
31
Who controls world oil reserves ? Iraq National Oil Companies Concessions Production Sharing Agreements Limited reach/ National Companies

33
Proven Natural Gas Reserves Gas reserves, concentrated in the Middle East & the transition economies, are equal to 66 years of current production

34
Who owns the gas reserves ? More than 60 % of world gas reserves are under the control of countries restricting foreign investments Source: BP

36
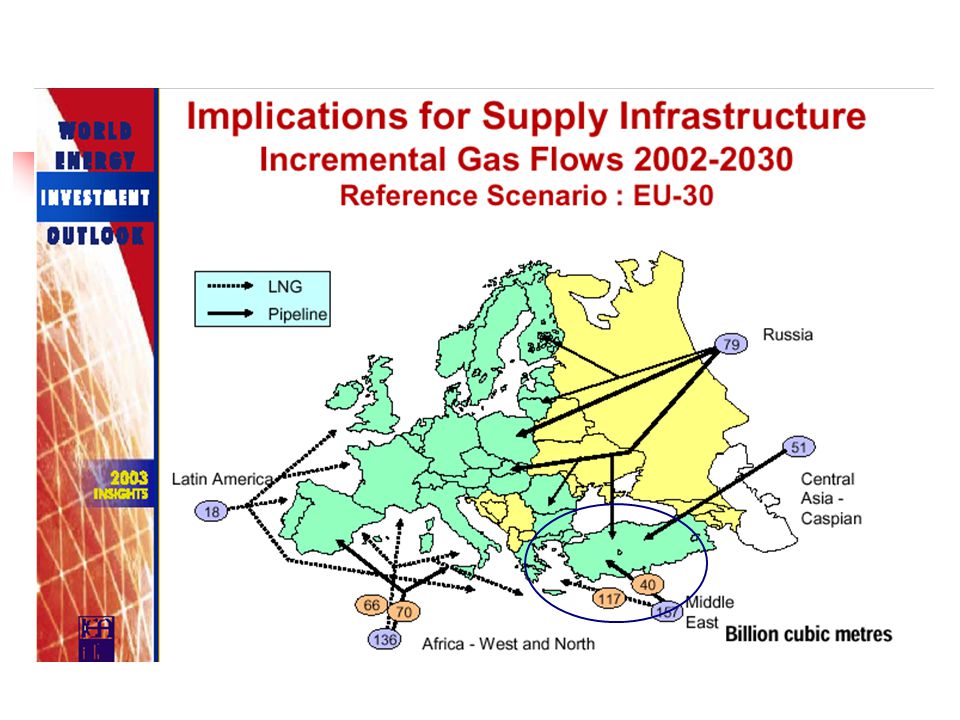
Major Net Inter-Regional Gas Trade Flows Inter-regional gas trade triples by 2030, with most new exports coming from the Middle East, Africa and Russia

37
A Vital Insecurity Issue: Increasing Dependency of Major Powers on Energy Imports

38
Fossil Fuels Consumption Percentages (%) USA Oil: % 39 N. Gas: % 26 Coal: % 24 EU-15 Oil: % 43 N. Gas: % 23.6 Coal: % 14.8 China Oil: % 24.6 N. Gas: % 2.0 Coal: % 66.5 Asia-Pasific Oil: % 36.5 N. Gas: % 11 Coal: % 43.5 BP, June 2003

39
Source: EIA 2005 US consumes 25 % of the world total primary energy demand

42
The US gas supply will increase depending on domestic/unconventional production, Alascan gas production (2016) and LNG
 and LNG")
45
Prof. Michael Klare: “Control over the Persian Gulf translates into control over Europe, Japan and China. It is having our hand on the spigot.” (Thirty Year Itch, Robert Dreyfuss, motherjones.com, March 1, 2003)
.")
46
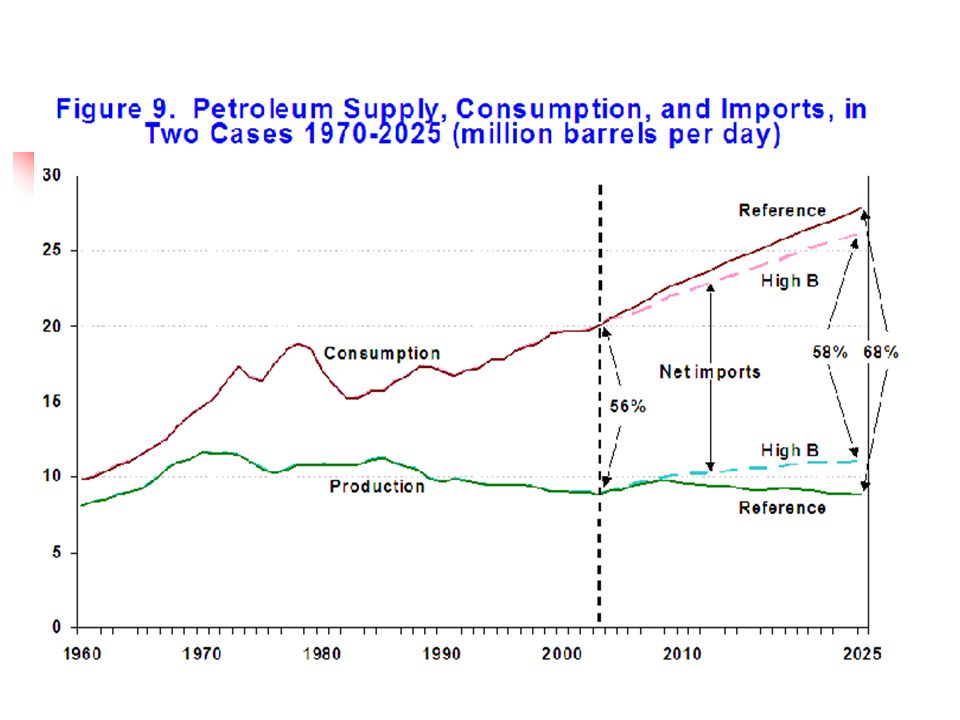
Consumption Production Net imports

47
EU Oil Balance (1980-2030)
")
48
Net imports AB 30 Production

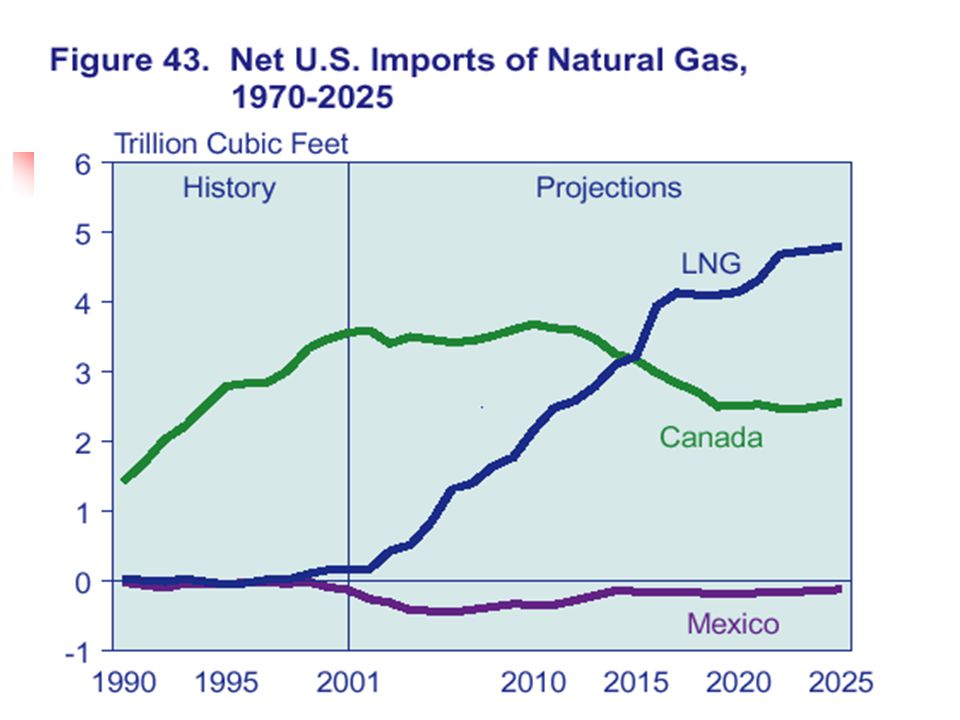
49
Billion cubic meters

50
Afrika

52
Source:Elena Telegina;Director, Inst. Of Geopolitics and Energy Security of Russia, Lukoil, Paris 25 Nov. 2003 (International Investment in Russia’s Gas Industry) EU Gas Production EU gas imports Need for New contracts
 EU Gas Production EU gas imports Need for New contracts.")
56
AB Gaz Arz Talep Gelişimi (2001-2020) Kaynak:Elena Telegina;Director, Inst. Of Geopolitics and Energy Security of Russia, Lukoil YK Üyesi, Paris 25 Kasım 2003 (International Investment in Russia’s Gas Industry) İç Üretim Kontrata bağlı ithalat Ek ithalat gereksinimi Ek ithalat gereksinimi AB üretimi AB ithalatı
 İç Üretim Kontrata bağlı ithalat Ek ithalat gereksinimi Ek ithalat gereksinimi AB üretimi AB ithalatı.")
57
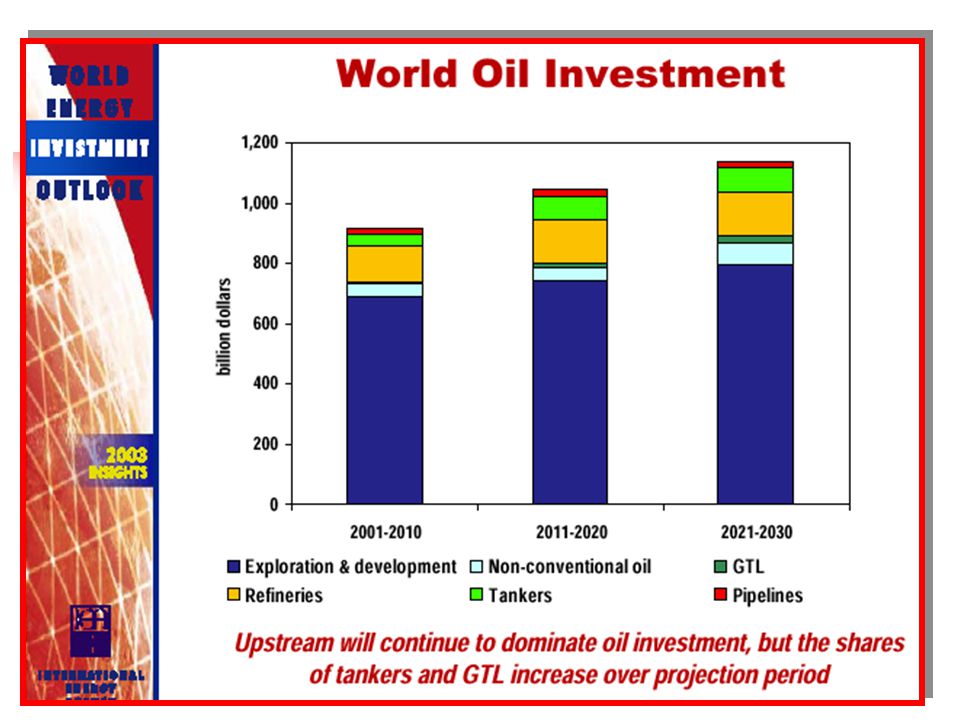
World Energy Investment Outlook, IEA 2003

58
RF: General Data

60
RF: Gaz Rezervleri

61
Role of Russia in the world energy context in 2010 Russia will continue to play a central role in oil and gas trade, with major implications for energy security 0% 5% 10% 15% 20% 25% 30% 35% 40% percent of world trade CO 2 0 100 200 300 400 500 600 700 Mt CO 2 CO 2 credits Oil Net exports 7.3 mb/d Gas 182 bcm

62
Russian Gas Production Higher Gazprom and independent production will meet both rising domestic and export demand

63
World Energy Investment Outlook, IEA 2003

66
RF: General Policies When they first hold the power (Putin and Kasyanov) talked about market rules will be set but then changed their rhetoric and applications Putin: Foreign investments will be restricted in strategic areas (like energy) of the national economy Restructuring of Gazprom in line with market conditions was directly refused by Putin. “His men” were brougt into most critical and managing posts The same line is observed even in the oil sector for the last state enterprise Rosneft These back-off strategy started in 2002-2003 2002-2003 Yukos affair For foreign investments, in case of disputes, Russian courts are authorized

67
RF: Different approach towards different foreign companies Uncertainty in legalfarmework and legislation. Each foreign investment proposal is evaluated seperately and mostly with different criteria. Positive results: Conoco Philips buying stake from Lukoil, BP-TNK partnership, Balthic Pipeline agreement with German BASF and EoN Ruhrgas Negative: ExxonMobil’s Yukos deal failure, French Total’s stake expectation from Sibneft Russian agressiveness: Russian companies taking the control of the gas and elecricity transportation and distribution companies of the CIS countries Power game between the actors in Kremlin

68
RF: Major Pipeline Projects W. Siberia – Murmansk: 1 – 2.4 million barrels/day oil pipeline project. Vital for the U.S. Remains as a project. Angarsk – Daqing: To China. Yukos designed and proposed. CNPC supported. Stalled after the Yukos crisis. China-Japan competiton. Within the RF, power struggle between the State and the private sector. Putin, wants State control in the pipeline sector. Transneft proposes a different pipeline: From East Siberia to Pasific. Exports to China was guaranteed by an agreement. Until 2010 0.6 million b/d. Recent warm(?) relations between China and Russia may increase the chance of the project. In additon reserves does nort seem to be encouraging to further supply Japan demand.
 relations between China and Russia may increase the chance of the project. In additon reserves does nort seem to be encouraging to further supply Japan demand..")
69
RF: Limits for further exports RF’s role in the international energy market is limited (could be much greater) due to its limits for the export infrastructure. Druzhba (oil export) Pipeline and port capacity is limited For Black Sea exports the Turkish Straits and for exports from the balthis ports the Dutch Straits (Kattegat and Skagerrak) limits the capacity The export potential to Asia Pasific countries and to the US is limited with the lack of pipeline and port capacities (ex: W. Siberia – Murmansk P/L)
 Pipeline and port capacity is limited For Black Sea exports the Turkish Straits and for exports from the balthis ports the Dutch Straits (Kattegat and Skagerrak) limits the capacity The export potential to Asia Pasific countries and to the US is limited with the lack of pipeline and port capacities (ex: W. Siberia – Murmansk P/L).")
71
RF: Energy and international relations Very positive and diversified with Germany and Italy. Total gas exports: 57 billion cubic meters France: Problems with (agressive) Total. Otherwise, “colorless” U.K.: Despite some political tensions, Gazprom entered into the UK internal market and gas distribution pipeline construction business (Interconector). BP -TNK partnership positive. Gazprom wants stake in different projects (Centrica). European Commission finds indepency (to Russian gas imports) exceeding 30 % dangerous for energy security. They want RF to sign the Energy Charter Treaty and keep the way open for Central Asian and Caspian gas without applyin any pressure on related countries.
 Total. Otherwise, colorless U.K.: Despite some political tensions, Gazprom entered into the UK internal market and gas distribution pipeline construction business (Interconector). BP -TNK partnership positive. Gazprom wants stake in different projects (Centrica). European Commission finds indepency (to Russian gas imports) exceeding 30 % dangerous for energy security. They want RF to sign the Energy Charter Treaty and keep the way open for Central Asian and Caspian gas without applyin any pressure on related countries..")
72
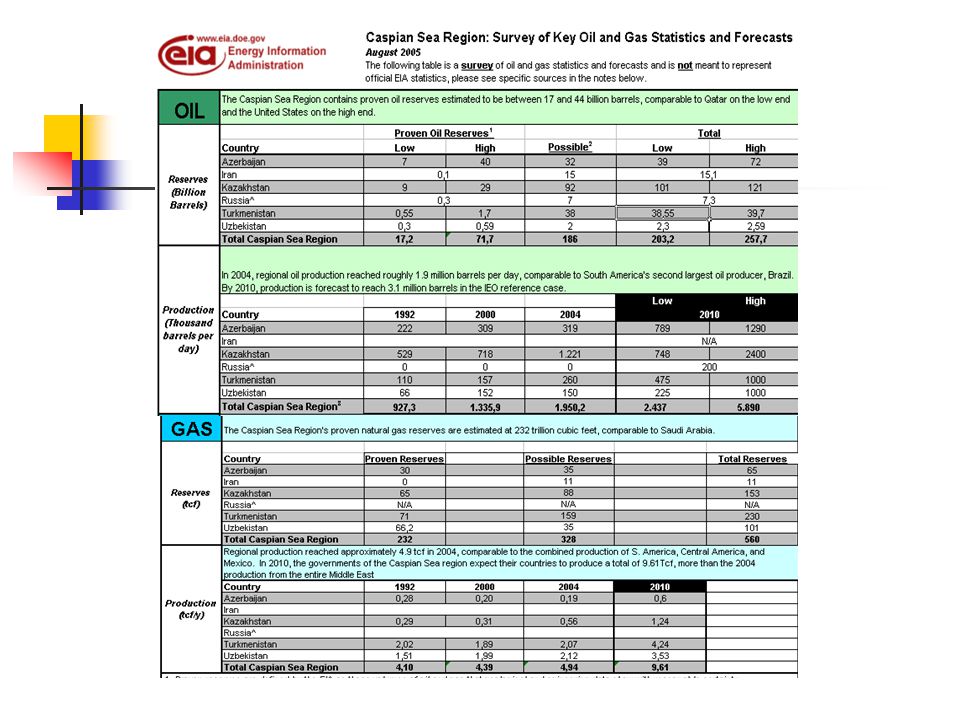
The Caspian Resources

78
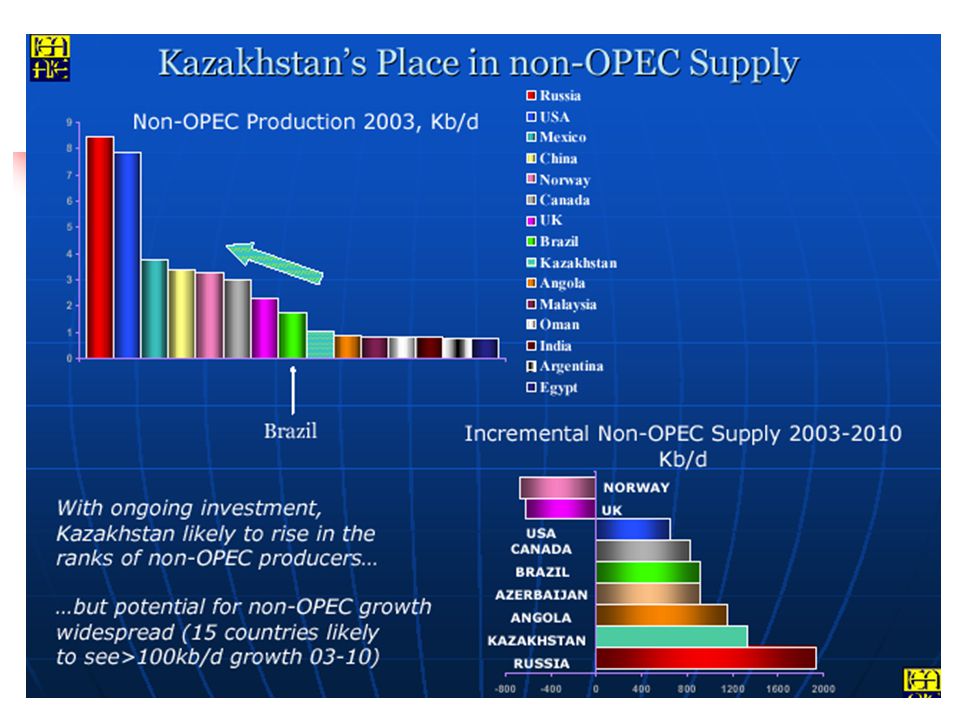
Kazakistan 1000 barrels/day

81
Kazakhstan Oil Exports First half of 2005: 1.1 million barrels/day North: Russian P/l and railway network West: Caspian Pipeline Consortium (Russia) and by barge to Azerbaijan South: Iran (swaps) East: China (Alashankoy rail crossing, 30,000 barrels/day) Plans are underway for expansion (P/L) to China, join to BTC (to rise exports from 145,000 b/d to 760,00 b/d in 2016). Also interested in Odessa- Brody P/L reversal now being effectively used by BP-TNk in N-S direction towards Black Sea.

82
Kazakhstan - China Oil Pipeline

83
Kazakh Oil P/L to China and Odessa Brody reversal

84
Kaynak: ABD Enerji Bakanlığı web sitesi (http://www.eia.doe.gov/cabs/Centasia/pdf.pdf)

87
Caspian Region Oil Pipelines

88
Bosphorus By Pass Options

89
Caspian Region Gas Pipelines

91
Turkmenistan (Oil) Oil reserves: 546 millon barrels (mostly towards west and in South Caspain basin) Oil production: 260,000 b/d. Limited foreign investment (JV, PSA) (Dragon Oil-UAE, Burren-UK, Petronas-Malesia) Oil Consumption: 90,000 b/d Conflict w/Azerbaijan on Kepez/Serdar 2 refineries (240,000 b/d; Chardzou, Turkmenbashi) No oil export pipeline. Oil exports mostly via Caspian and through Russia (Mohackale). RF quotas are frequently restricted. Limited oil exports through Iran (Neka-swap) and Azerbaijan.
 (Dragon Oil-UAE, Burren-UK, Petronas-Malesia) Oil Consumption: 90,000 b/d Conflict w/Azerbaijan on Kepez/Serdar 2 refineries (240,000 b/d; Chardzou, Turkmenbashi) No oil export pipeline. Oil exports mostly via Caspian and through Russia (Mohackale). RF quotas are frequently restricted. Limited oil exports through Iran (Neka-swap) and Azerbaijan..")
92
Turkmenistan (Gas) Gas reserves: 2 trillion cubic meters (main fields: Devletabad and Shatlik). Devletabad is reserved for TransAfghan gas p/l. Reserve sufficiency is still being questioned by investors. Gas production: 63 bcm/y (2005, BP) Gas consumption: 18 bcm/y Exports: 45 bcm/y 40 bcm/y to Russia and via Russia to Ukraine Russia re-sells % 20 of the imported Turkmen gas to Europe
 Gas consumption: 18 bcm/y Exports: 45 bcm/y 40 bcm/y to Russia and via Russia to Ukraine Russia re-sells % 20 of the imported Turkmen gas to Europe.")
93
Russia Caspian Middle East Africa

94
Turkey: Energy Profile Reserves Production/Consumption % of Resources Dependency on oil and gas Cost of Incompetent Policies Supply-demand (Exaggeration) Take or pay guarantees (Over) Dependency on Russia No re-export opportunity (Exception: Azerbaijan) “Overbooked” gas imports
 Take or pay guarantees (Over) Dependency on Russia No re-export opportunity (Exception: Azerbaijan) Overbooked gas imports")
95
Turkey: Primary Energy Consumption by Resources (%), end 2002
, end 2002")
96
Turkey Primary Energy Balance and Development (million tons ofoil equivalent) 200220102020 Enerji Talebi 78.4126222 Yerli Üretim 24.6 (Talebin %31’i) 37 (% 29) 66 (% 30)
 Enerji Talebi Yerli Üretim 24.6 (Talebin %31’i) 37 (% 29) 66 (% 30)")
97
Turkey: Resource Potential Oil (problems for exploration, vertical integration,..) Gas Thrace/Hamitabat source rock: 90 bcm Gas hydrates East Black Sea Coal Re-evaluation of reserves (9.3 billion tons) “coal bed methane” Hydro New potential: 180 billion kilowatt-hours Renewables Uranium, torium
 Gas Thrace/Hamitabat source rock: 90 bcm Gas hydrates East Black Sea Coal Re-evaluation of reserves (9.3 billion tons) coal bed methane Hydro New potential: 180 billion kilowatt-hours Renewables Uranium, torium")
98
Turkey: Refineries and Pipelines

99
Russia Kazakhstan Tataristan Azerbaijan Iran Suriye Egypt S. Arabia Libya Algeria Yerli HP Alımı TÜPRAŞ Crude Oil Imports (million tons) Iraq
 Iraq.")
100
Turkey: Oil Production and Demand Balance Needs additional refinery capacity

101
Gas Consumption YearsConsumption bcm 19870,51 19903,3 19956,7 200014,1 200116,4 200217,6 200321.2 200422.2 200527 Russia: 8,67 bcm Turusgas: 2,44 bcm B. Stream: 3,24 bcm Nigeria: 1,03 bcm Algeria: 3,24 bcm Iran: 3,56 bcm Russia: 14,3 ( % 65 )
.")
102
Would Turkey be an Energy Bridge ?

103
Turkey: Pipeline Projects Baku Tblisi Ceyhan Oil Pipeline (early 2006) Straits “by pass” P/Ls Russsia – Turkey (West P/L) Blue Stream Gas P/L Turkey Greece Gas P/L Trans Caspian Turkmen Gas P/L (-) Shah Deniz Gas P/L Iraq – Turkey Gas P/L (10 bcm) Egypt – Turkey Gas P/L (4 - 8 bcm) Turkey-Bulgaria-Romania-Hungary-Austria Gas P/L (Nabucco Project) Turkey-Bulgaria-Romania-Hungary-Austria Gas P/L (Nabucco Project) Blue Stream Expansion to Israel
 Straits by pass P/Ls Russsia – Turkey (West P/L) Blue Stream Gas P/L Turkey Greece Gas P/L Trans Caspian Turkmen Gas P/L (-) Shah Deniz Gas P/L Iraq – Turkey Gas P/L (10 bcm) Egypt – Turkey Gas P/L (4 - 8 bcm) Turkey-Bulgaria-Romania-Hungary-Austria Gas P/L (Nabucco Project) Turkey-Bulgaria-Romania-Hungary-Austria Gas P/L (Nabucco Project) Blue Stream Expansion to Israel")
104
Baku – Tblisi - Ceyhan Oil Pipeline First oil at Ceyhan: May 2006 (delayed) To be followed by South Caucasus Gas Pipeline (late 2006 ?)
 To be followed by South Caucasus Gas Pipeline (late 2006 )")
105
BTC ve Bakü – Supsa Erken Petrol Hattı

106
Russia Caspian Middle East Africa

107
The First Cornerstone of The “Bridge”

108
The Bidding Process is on the way.. Phase 1 (on land): Bayındır SUTEK Phase 2: Single proposal by SAIPEM Phase 3: Greece – Italy – Albania – Europe ? 0.75 – 3.6 bcm
: Bayındır SUTEK Phase 2: Single proposal by SAIPEM Phase 3: Greece – Italy – Albania – Europe – 3.6 bcm.")
109
Gas Transportation to Europe NABUCCO: 20 – 30 bcm Caspian – C. Asian gas To Europe BOTAS – Bulgargaz – Transgaz - MOL

110
Baku-Tblisi-Ceyhan (BTC) Project Max. Capacity: 50 mta (1 milllion b/d) Total Length: 1774 km Azerbaijan Section: 440 km Georgian Section: 260 km Turkey Section: 1074 km Pipe diameter: 42-34 inch Total Pomping Stations: 10 (Turkey:4)
 Total Length: 1774 km Azerbaijan Section: 440 km Georgian Section: 260 km Turkey Section: 1074 km Pipe diameter: inch Total Pomping Stations: 10 (Turkey:4).")
111
Baku-Tblisi-Ceyhan Oil P/L 0 – 16 years: 55 cents/barrel 35 cents/barrel: to BOTAŞ (operating, pilotage, loading/off-loading, etc. included) 20 cents/barrel: to the Treasury (land use) 17-40 (24 years): 80 cents/barrel First 6 years 250,000 bbl/day minimum transportation To BOTAŞ: 250,000 b/d X 35 c/b X 365 X 0.85 = 27 million $/year To the Treasury: 18 million $/year BOTAŞ yearly operational/maintainance expenses: 40 million $ (est.) After 6 years: 1 million b/d (No obligation/punishment) 6 – 16 years: To BOTAŞ: 108 million $/year (If it transports 1 million barrels a day) To the treasury: 72 million $/year
 20 cents/barrel: to the Treasury (land use) (24 years): 80 cents/barrel First 6 years 250,000 bbl/day minimum transportation To BOTAŞ: 250,000 b/d X 35 c/b X 365 X 0.85 = 27 million $/year To the Treasury: 18 million $/year BOTAŞ yearly operational/maintainance expenses: 40 million $ (est.) After 6 years: 1 million b/d (No obligation/punishment) 6 – 16 years: To BOTAŞ: 108 million $/year (If it transports 1 million barrels a day) To the treasury: 72 million $/year.")
112
Current Status of the Projects (East to West) BTC (Oil P/L): Delayed. Early 2006. Problems in all countries. Fill in takes 66 days from the Georgian border to Ceyhan. Shah Deniz (Gas P/L): On its way. Late 2006. 225 km in Turkey. Turkey – Greece (Gas P/L): Bidding for onland p/l completed. Subsea P/L pending. NABUCCO (Gas P/L): Turkey – Bulgaria –Romania – Hungary – Austria. Joint Venture Agreement signed. Still facing some problems. Austria’s policies against Turkey’s EU membership is a significant one.
: On its way. Late km in Turkey. Turkey – Greece (Gas P/L): Bidding for onland p/l completed. Subsea P/L pending. NABUCCO (Gas P/L): Turkey – Bulgaria –Romania – Hungary – Austria. Joint Venture Agreement signed. Still facing some problems. Austria’s policies against Turkey’s EU membership is a significant one..")
113
Current Status of the Projects (cont..) (East to West) Iran (Gas P/L): Facing technical and supply side problems. Gone to international court. Turkey has the right to cancel (interruptions exceeded 70 days). No supply between December 2004 – Feb 2005 Iraq -Turkey (Oil P/L): Mostly closed due to sabotages. Iraqi debt around 700 million dollars Iraq – Turkey (Gas P/L): TPAO – BOTAS – Tekfen joint venture. 2 out of the 5 negotiated fields are gone to US companies (Needs confirmation). MOU signed in June 2005. A significant potential for gas transit to Europe. US invasion is a critical factor.
. No supply between December 2004 – Feb 2005 Iraq -Turkey (Oil P/L): Mostly closed due to sabotages. Iraqi debt around 700 million dollars Iraq – Turkey (Gas P/L): TPAO – BOTAS – Tekfen joint venture. 2 out of the 5 negotiated fields are gone to US companies (Needs confirmation). MOU signed in June A significant potential for gas transit to Europe. US invasion is a critical factor..")
114
Current Status of the Projects (cont..) (All Directions) Egypt - Turkey (Gas P/L): Working groups to include Syria. ( 4 + 2 or 6 + 2 bcm) Russia – Turkey - Israel (Gas P/L): A parallel line to Blue Stream. Russians also want to expand the BStream for Turkish market but reverse the existing West P/L to supply Europe Samsun – Ceyhan (Oil P/L)
 Russia – Turkey - Israel (Gas P/L): A parallel line to Blue Stream. Russians also want to expand the BStream for Turkish market but reverse the existing West P/L to supply Europe Samsun – Ceyhan (Oil P/L).")
115
Russia Caspian Middle East Africa

116
Thank you for your kind patience and interest…

117
Further Notes....

118
Mega Project and BTC Oil P/L Projects 5.4 billion barrrels recoverable reserve 181 bcm gas 15.6 billion $ investment 1.1 mbd production in 2009 In operation: early 2006 3.6 billion $ cost % 15 cost increase (Woodward)
")
119
(BTC) Project Steps Basic Engineering: Nov. 2000 – May 2001 Detailed Eng. : June 2001- Aug. 2002 Land Acq. And Construction: Sep. 2002- May 2005 (delayed) Turn key cost: 1.307 billion $ (?) (5 months ago: 1.420 million dolars) Mechanical completion: 6 Jan. 2005 (?) Line fill, and flow: May 2005 Welding completed. But pumping stations, elektrification, SCADA, etc. incomplete May delay until the first quarter of 2006 Cost over run and penalties for delay: 500 thousand $ every day
 Turn key cost: billion $ ( ) (5 months ago: million dolars) Mechanical completion: 6 Jan ( ) Line fill, and flow: May 2005 Welding completed. But pumping stations, elektrification, SCADA, etc. incomplete May delay until the first quarter of 2006 Cost over run and penalties for delay: 500 thousand $ every day.")
120
Straits “By-Pass” Projects A- Samsun – Ceyhan Samsun-Amasya- Kırıkkale-Yumurtalık (Çalık,70mty) Samsun-Sivas-Yumurtalık (Çalık,70mty) Samsun-Kırıkkale-Yumurtalık (Ekinciler, 40 mty) Samsun-Sivas-Yumurtalık (Ekinciler, 50mty) B- Kıyıköy – Saros Kıyıköy-Keşan-İbrikbaba (Thrace Development, 70 mt) Kıyıköy-Keşan-İbrikbaba (Anadolu İnşaat, 60 mty) Saray-Ambarlı-Saros (Tunoil, 70 mty)
 Samsun-Sivas-Yumurtalık (Çalık,70mty) Samsun-Kırıkkale-Yumurtalık (Ekinciler, 40 mty) Samsun-Sivas-Yumurtalık (Ekinciler, 50mty) B- Kıyıköy – Saros Kıyıköy-Keşan-İbrikbaba (Thrace Development, 70 mt) Kıyıköy-Keşan-İbrikbaba (Anadolu İnşaat, 60 mty) Saray-Ambarlı-Saros (Tunoil, 70 mty)")
121
Azerbaijan Projects

122
TPAO

124
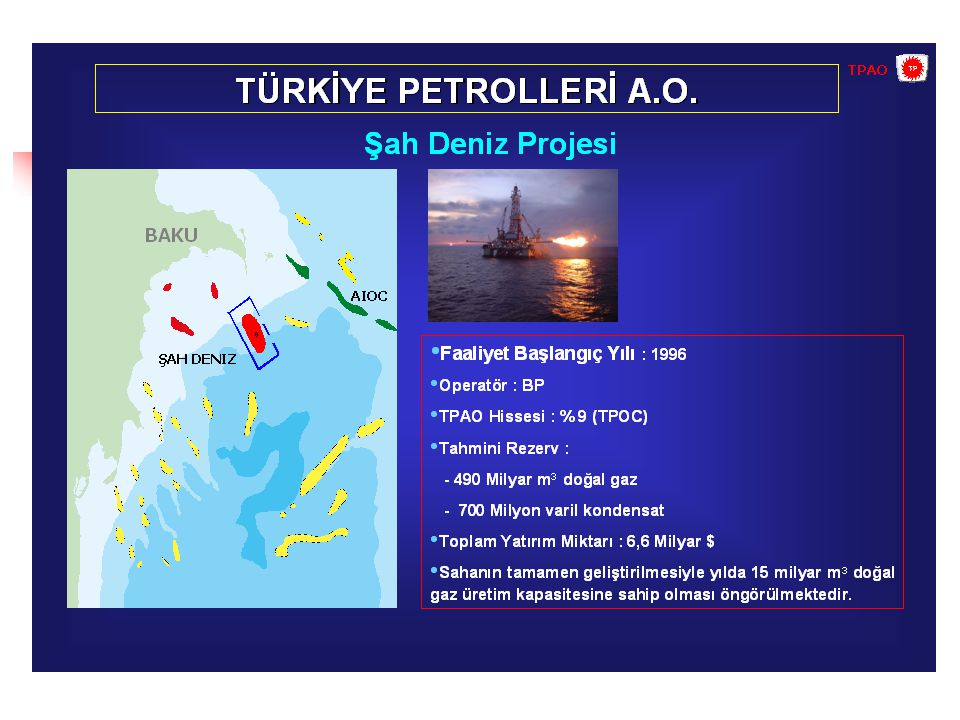
Şah Deniz ve Güney Kafkasya Gaz BH Projeleri Kapasite: 8.1 milyar metre küp Türkiye’ye: 6.6 milyar m3 (Ekim 2006) Maksimum Kapasite: 22 milyar m3 625 milyar metre küp gaz (+) 750 milyon varil kondensat
 Maksimum Kapasite: 22 milyar m3 625 milyar metre küp gaz (+) 750 milyon varil kondensat")
126
Hazar Odaklı Diğer Boru Hatları ve Projeler

127
Irak’ın Petrol Üretim ve İhraç Sistemi Mina Al Bakr 1.4 mvg 1.6 mvg 3.0 mvg Kerkük- Hayfa Kohr Al Amaya Kapalı

128
Regional Shares in World Primary Energy Demand Two-thirds of the increase in world demand between 2002 and 2030 comes from developing countries, especially in Asia

129
Comparision of World Oil Price Projections (2010-2025) Source: US Dept. Of Energy, EIA, 2004 (18-24.28)(18-26.70) (15.6-25.89)(18-27.96)
( ) ( )( ).")
130
Kerkük-Yumurtalık (ITP) ile Kıyas Hattı biz yaptık (Körfez krizi öncesi) 82 milyon ton/yıl taşımada: Deniz hizmeti: 30 milyon $/yıl Balast geliri (TÜPRAŞ’a satış dahil): 20 milyon $ Türk mühendis ve teknisyen Alımlar pazarlıkla BTC ilk yıllarda düşük verimle çalışacak, masraflar neredeyse aynı kalacak ITP tarifesi: 50 milyon ton/yıl için: 60 cent/varil 60 milyon ton/yıl için: 50 cent/varil 70.9 milyon ton/yıl için: 43 cent/varil
 ile Kıyas Hattı biz yaptık (Körfez krizi öncesi) 82 milyon ton/yıl taşımada: Deniz hizmeti: 30 milyon $/yıl Balast geliri (TÜPRAŞ’a satış dahil): 20 milyon $ Türk mühendis ve teknisyen Alımlar pazarlıkla BTC ilk yıllarda düşük verimle çalışacak, masraflar neredeyse aynı kalacak ITP tarifesi: 50 milyon ton/yıl için: 60 cent/varil 60 milyon ton/yıl için: 50 cent/varil 70.9 milyon ton/yıl için: 43 cent/varil")
Similar presentations


; Erasmus Mundus Program.>")


 Grants Chapter 6.>")


