Download presentation
Presentation is loading. Please wait.

1
Active Measurement Project on KREONET & APAN 2002. 1. 24 Manhee Lee mhlee@kreonet2.net Supercomputing Center Korea Institute of Science & Technology Information

2
Objectives of this presentation Introduction to KREONET Network Analysis Infrastructure of KREONET Introduction to AMP Interesting results of AMP Proposal to make AMP APAN

3
Introduction to KREONET Korea Research Environment Open Network one of the Korea ’ s national core networks since 1988 Providing an advanced S&T and R&D infrastructure to 300 R&D institutes and universities KREONet2, next generation research network, NGI(Next Generation Internet) technologies through interconnection with STAR TAP Help researchers process large capacity of data in supercomputers and provide activation of world-class collaborative application service
 technologies through interconnection with STAR TAP Help researchers process large capacity of data in supercomputers and provide activation of world-class collaborative application service")
4
Role of KREONET High-Tech S&T devices (Supercomputers, CAVE,DB Servers…) High-Tech S&T applications based KREONET/KREONet2/HPCNet
 High-Tech S&T applications based KREONET/KREONet2/HPCNet")
5
Why Network Measurement? Network Operators ’ View Is the network reliable? How is the network used? When should the network be upgraded? Network Users ’ View How much do I use the network? Should I invest more or not? Does the Service Provider abide by its agreement?

6
Active Measurement Method inject measurement traffic into the network Metrics Round Trip Time, Packet loss, Topology Tools Ping, Traceroute, NIMI, Surveyor, PingER, AMP

7
Passive Measurement Method Do not inject measurement traffic but just observe traffic passively Metrics Link Utilization, Traffic amount, Traffic classification, Traffic pattern Tools Tcpdump, MRTG, Flowscan, OC3MON(CoralReef), Flowscan+
, Flowscan+")
8
Network Analysis Infrastructure(NAI) for KREONET ATM Switch KOREN/KREONet2 Router KOREN/KREONet2 -STAR TAP KREONET Router STAR TAP FlowScan+ OC3MON AMP PingER Netflow AMP PingER Destination hosts Passive Measurement Active Measurement MRTG
 for KREONET ATM Switch KOREN/KREONet2 Router KOREN/KREONet2 -STAR TAP KREONET Router STAR TAP FlowScan+ OC3MON AMP PingER Netflow AMP PingER Destination hosts Passive Measurement Active Measurement MRTG")
9
AMP (Active Measurement Project) Developed by NLANR/MOAT(SDSC) A distributed network of over 120 active monitors Systematically performing scheduled measurements(fping, traceroute) between each other monitor All monitors send data to central data collector periodically located in SDSC Raw and analysis data available by Web
 Developed by NLANR/MOAT(SDSC) A distributed network of over 120 active monitors Systematically performing scheduled measurements(fping, traceroute) between each other monitor All monitors send data to central data collector periodically located in SDSC Raw and analysis data available by Web")
10
What can AMP tell us? Round trip time once a minute Traces between monitors every 10 minute Distribution of RTT Packet Loss History of changes of traces Yearly, weekly, daily RTT graph

11
Deployment Map of AMP U.S

12
Structure of AMP Analysis machine active monitor Other target Analysis machine Cichlid 3D Web Browser active monitor

13
AMP Architecture System cron process fping traceroute AMPlets ping traceroute ping results traceroute results am_master am_slave ping results traceroute results apache cgi-bin trigger File read TCP connection ping results traceroute results ping results traceroute results File write File read am_slave AMPlet1 AMPlet2 AMPlet3 am_slave TCP connection File write HTTP Request Web Service AMP Server ping traceroute

14
How to use AMP? First, select an interested AMP monitor Currently, there are over 120 monitors For example, let ’ s click on amp-arizona

15
You can see brief traffic analysis from amp-arizona to all other monitors yesterday ’ s minimum, mean, and max RTT, and packet loss rate If you want to know specific traffic analysis, click the interested monitor For example, let ’ s click on Harvard University How to use AMP?

16
You can see yearly and weekly RTT graphs from Arizona State Univ. to Harvard Univ. If you want to know more details about a specific day, click any date For example, let ’ s click on 17 Dec 2001 How to use AMP?

17
You can see more details of the day from Arizona to Harvard Daily RTT : around 62ms Hop count: 11 Jitter: around 1ms RTT distribution: mostly 62ms packet loss: many times, 10% How to use AMP?

18
If click route, you can see all routes of the day If there is any changes, you can see all the changes How to use AMP?

19
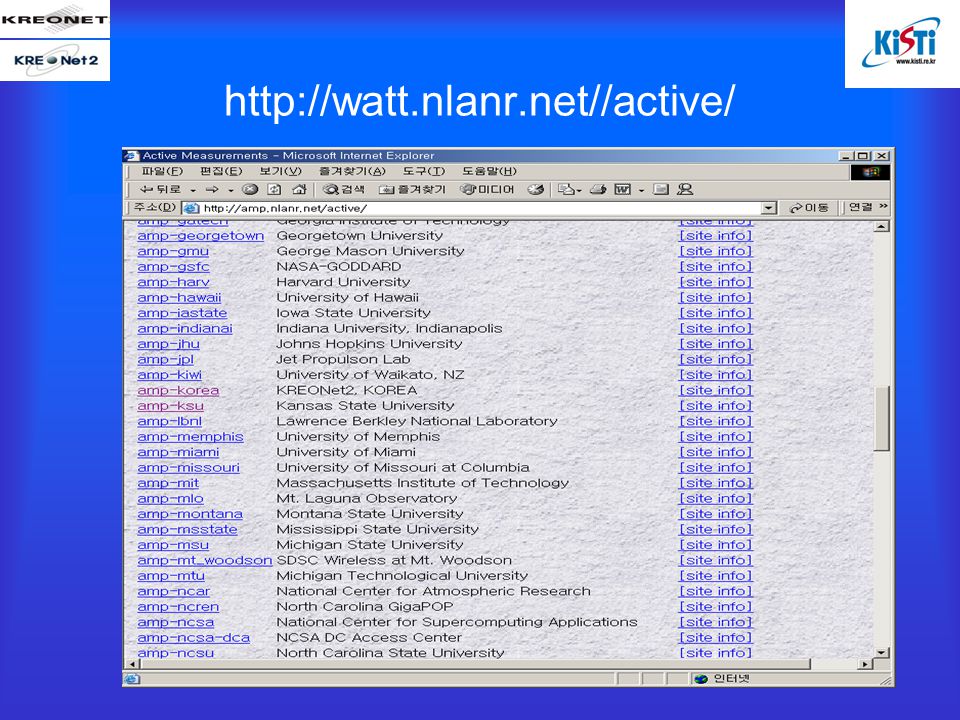
amp-korea NLANR/MOAT(SDSC) gave a monitor to KISTI and allowed it to be joined the AMP infrastructure for international collaboration. amp-korea is monitoring the performance from Korea to about 120 amp U.S sites via STAR TAP. Those amp U.S sites are doing so in the same way. http://watt.nlanr.net//active/

20
http://watt.nlanr.net//active/
21
amp-korea HPC results

22
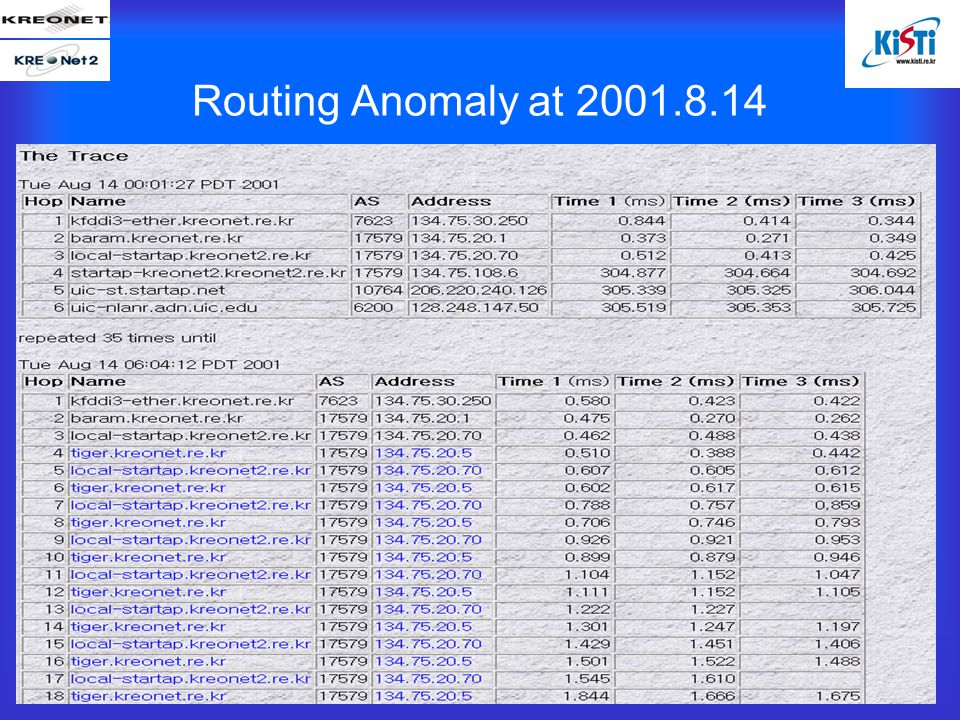
Routing Anomaly at 2001.8.14

24
Problem Analysis in 2001.9 From amp-korea to amp-ncsa RTT anomaly detected. Why?

25
Problem Analysis in 2001.9 First compare with other network. From amp-korea to amp-sdsc Nearly same results.

26
Problem Analysis in 2001.9 Compare with other network. From amp-korea to amp-ucsd Totally different results We can assume that this problem may not be KOREN/KREONet2-STAP TAP link problem but STAR TAP network problem.

27
Problem Analysis in 2001.9 Take a look at STAR TAP network. From amp-startap to amp-ncsa At normal case, its RTT is about 2,3 ms Why? Are there any routing changes?

28
Problem Analysis in 2001.9 Take a look at its routing, but clean Then, we can assume that the reason is not routing problem but may be congestion or router ’ s low performance

29
Problem Analysis in 2001.9 Compare other network from STAR TAP Then, we can know that all traffic patterns STAR TAP to vBNS, Abilene, and CA*net are same So we can conclude that the problem of low network performance might be in STAR TAP routers or inside network.

30
AMP KREONET To build an AMP infrastructure in KREONET Last year, we set up two servers and 4 test AMP monitors at KREONET NOC This year, we plan to install dozens of AMP monitors in KREONET network centers and major supercomputer users. This AMP infrastructure will monitor the performance of the KREONET URL: http://matthew.kreonet2.net (under construction) Software and Server Installing Guide : http://watt.nlanr.net/ http://watt.nlanr.net/
 Software and Server Installing Guide :")
31
Proposal to make AMP APAN APAN ’ s individual networks, institutes, and universities have been doing their own measurements But there is no APAN-wide or Asia-wide measurement infrastructure Because of increasing collaboration within Asia, it will be very useful to actively measure network performance of APAN AMP may be a good candidate for APAN performance measurement infrastructure

32
Expected benefits from AMP APAN RTT, Packet loss, connectivity among APAN countries Same information with U.S and other countries by peering with AMP U.S Optional performance test for APAN Performance testbed for future project such as End-to-end Performance Initiative in APAN

33
Is it difficult to join or make AMP APAN? Absolutely NOT!!!!!!!!!!! Making AMP APAN is very easy because it is cheap and easy to install You just need one FreeBSD system Please send us an email any time, then we can help you install software Easy to join, easy to collaborate, easy to get information and cheap to start!! AMP APAN will be very useful for APAN Why don ’ t you join us now?

34
Conclusions With AMP, we can know RTT, Packet loss, traces, and throughput(optional) AMP APAN will be very useful measurement infrastructure Just one FreeBSD system is needed. Small Investment, Big Benefit!!

35
Links and Contacts Links NLANR: www.nlanr.net AMP: amp.nlanr.net amp-korea: watt.nlanr.net//active AMP KREONET: matthew.kreonet2.net (under construction) Contacts Engineer: Manhee Lee mhlee@kreonet2.netmhlee@kreonet2.net Director: Okhwan Byeon ohbyeon@kreonet2.netohbyeon@kreonet2.net AMP US director: Ronn Ritke rritke@nlanr.netrritke@nlanr.net Developer: Tony McGregor tonym@cs.waikato.ac.nztonym@cs.waikato.ac.nz
 Contacts Engineer: Manhee Lee Director: Okhwan Byeon AMP US director: Ronn Ritke Developer: Tony McGregor")
36
Comments or Questions? Thanks …

Similar presentations


 Funded by the National Science Foundation/CISE/SCI cooperative agreement no. ANI-0129677.>")

 Korea Advanced Institute of Science and Technology August 28, 2003 APAN Measurement WG meeting eTOP End-to-end.>")


 Funded by the National Science Foundation/CISE/SCI cooperative agreement no. ANI-0129677.>")


>")


