Download presentation
Presentation is loading. Please wait.

2
LEfficacité Energétique Energy Efficiency G15 – Dakar 6 November 2012 Benoit Lebot UNDP Climate Change Advisor Benoit.lebot@undp.org

3
Δ CostsEnergy Saved 85 Energy Efficiency Split Air Conditioners $56 00060 000 kWh/year Solar PV Roof on terrace of building $116 00022 000 kWh/year

4
3

5
IEA World Energy Outlook 2008: Reductions in energy- related CO 2 emissions in the climate-policy scenarios Reference Scenario 450 Policy Scenario CCS Renewable & biofuel Nuclear Energy efficiency 20 25 30 35 40 45 200520102015202020252030 Gigatonnes 54% 23% 14% 9%

6
1 2 3 4 Trend in Green House Gases Low Carbon Path Change Behavior Today Tomorrow

9
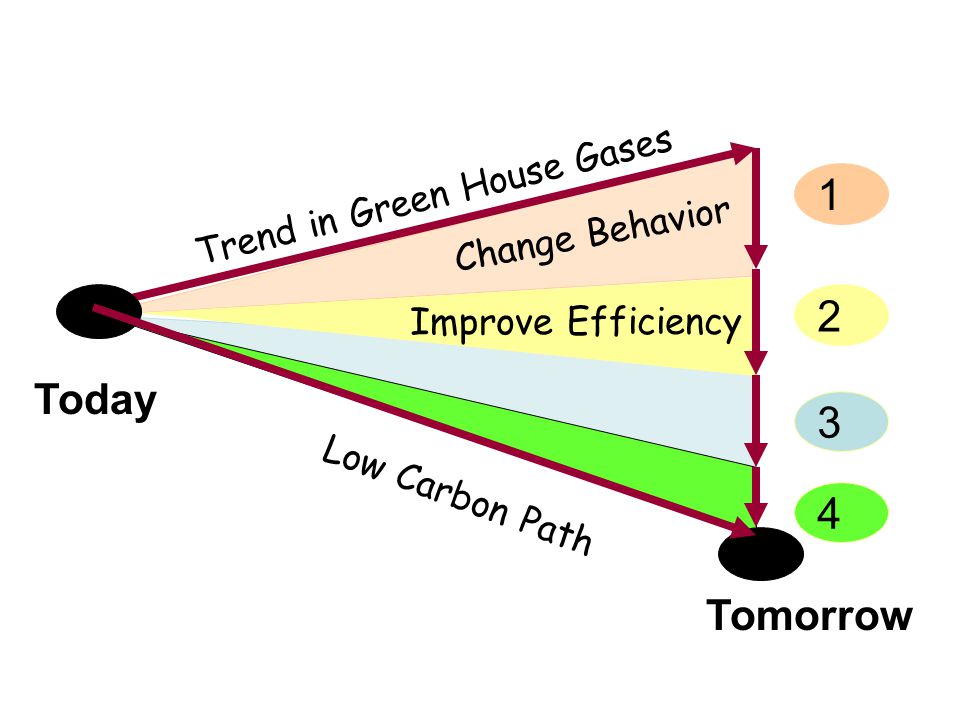
1 2 3 4 Trend in Green House Gases Low Carbon Path Change Behavior Improve Efficiency Today Tomorrow

10
Energy Efficiency

11
33% 90% 5% <1.5 % !

12
95% 5% 55% Advanced Gas Turbine 2.6 %

13
55% Advanced Gas Turbine 95% 25% 13 %

14
100% 95% 25% 24 %

15
Le cas de léclairage: vers des techniques de moins en moins carbonées kg CO2/year 150 kg 100 kg 70 kg 18 kg 0 kg

16
Généraliser les Foyers Améliorés

18
1 2 3 4 Trend in Green House Gases Low Carbon Path Change Behavior Improve Efficiency Renewable Energy REDD & Sequestration Today Tomorrow

19
1 2 3 4 Trend in Green House Gases Low Carbon Path Behavior Efficiency Renewable Energy REDD & Sequestration

20
0 500 1000 1500 2000 2500 717102618201216314151389527411 Household ID kWh/an Source : SAVE/Ecodrôme 98 ADEME - Cabinet O. SIDLER Energy consumption of Fridges & Freezers Measured Energy Consumption of Refrigerators & Freezers in 20 Households

21
Metered Energy Saved with Efficient Refrigerators & Freezers in 20 Households

22
CO 2

23
Metered Energy Saved with Efficient Lighting of 20 Households 209 247 104 164 185 187 195 196 197 246 250 283 286 309 383 799 53 62 71 101 0 200 400 600 800 1000 1200 21810205161581491941117671227133 Household ID kWh/an Energy saved after replacing bulbs Consumption after replacing bulbs Source : SAVE/Ecodrôme 98 Average Savings : 244 kWh / (an.house) ADEME - Cabinet O. SIDLER ADEMECEE

24
No thermal insulation in roof South facing wall without solar protection = Unecessary heat loads Lighting the stars Artificiel lighting during daylight both indoor & outdoor Air conditioners to evacuate The heat loads Unsealed doors Single glazing No solar protection No shade, Openn windows in winter time when heating system is on Energy is being wasted: Analyse of a commercial building

25
24 Source: MED-ENEC Project 2009

26
25 Evolution of the space heating consumption of a new house in France kWh/m 2 /year - 60% -90%

27
Energy Efficiency in the Building Code in Senegal Status: Under implementation $1 million in GEF $3 million co-financing

28
Technology Transfer: Typha-based Thermal Insulation Material Production in Senegal Status: Under implementation $2 million in GEF $3.4 million co-financing

29
How to bring energy efficient equipment & system to the market?

30
% of Market Energy Efficiency Scale Less Efficient More Efficient First, lets understand where the Market is 0

31
% of Market Energy Efficiency Scale Less Efficient More Efficient 0

32
% of Market Energy Efficiency Scale Less Efficient More Efficient 0

33
% of Market 0 Energy Efficiency Scale Less Efficient More Efficient

34
% of Market Energy Efficiency Scale Higher Lower 0 Current Stock 2012

35
% of Market Higher Lower 0 Current Stock 2012 New Buildings Energy Efficiency Scale

36
% of Market Energy Efficiency Scale Higher Lower 0 Current Building Stock 2012 Building Stock 2050 Objective

37
% of Market Energy Efficiency Scale Less Efficient More Efficient Current Supply 2011 0

38
% of Market Energy Efficiency Scale Less Efficient More Efficient Current Supply 2012 0 Supply 2015 Policy Objective The Objective is to Transform the Market

39
% of Market Energy Efficiency Scale Less Efficient More Efficient 0 Setting a Minimum Energy Performance Standard MEPS 2014

40
% of Market Energy Efficiency Scale Less Efficient More Efficient 0 The question is where to setting the Minimum Energy Performance Standard? MEPS 2014

41
% of Market Energy Efficiency Scale Less Efficient More Efficient Current Supply 2011 0

43
% of Market Energy Efficiency Scale Less Efficient More Efficient 0 Market Transformation: Building an Information Label Top 25%

44
% of Market Energy Efficiency Scale Less Efficient More Efficient 0 In some countries 5 Energy Efficiency Categories Market Transformation: A Model

45
Appliance Energy Label

46
% of Market Energy Efficiency Scale Less Efficient More Efficient 0 ABCDEFG In the EU, 7 Energy Efficiency Categories Market Transformation: A Model

47
Energy 350 More efficient Less efficient A B C D E F G A Manufacturer Model Logo ABC 123 Energy consumption kWh/year (Based on standard test results for 24h) Actual consumption will depend on how the appliance is used and where it is located Further information is contained in product brochures Fresh food volume I Frozen food volume I 200 80 40 (dB(A)re 1 pW) Noise Norm EN 153 May 1990 Refrigerator Label Directive 94/2/EC The European Appliance Energy Label
 Actual consumption will depend on how the appliance is used and where it is located Further information is contained in product brochures Fresh food volume I Frozen food volume I (dB(A)re 1 pW) Noise Norm EN 153 May 1990 Refrigerator Label Directive 94/2/EC The European Appliance Energy Label")
48
Does the label work?

49
0% 5% 10% 15% 20% 25% 30% 35% 40% 45% 50% ABCDEFG Energy label class Share of models/market More EfficientLess Efficient Transforming the Equipment Market Impact of EU Label on Market of Cold Appliance BECADFG

50
0% 5% 10% 15% 20% 25% 30% 35% 40% 45% 50% ABCDEFG Energy label class Share of models/market EU Market 1992 More EfficientLess Efficient Transforming the Equipment Market Impact of EU Label on Market of Cold Appliance BECADFG

51
0% 5% 10% 15% 20% 25% 30% 35% 40% 45% 50% ABCDEFG Energy label class Share of models/market EU Market 1996 EU Market 1992 More EfficientLess Efficient Transforming the Equipment Market Impact of EU Label on Market of Cold Appliance BECADFG

52
0% 5% 10% 15% 20% 25% 30% 35% 40% 45% 50% ABCDEFG Energy label class Share of models/market EU Market 1999 EU Market 1996 EU Market 1992 More EfficientLess Efficient Transforming the Equipment Market Impact of EU Label on Market of Cold Appliance BECADFG

53
0% 5% 10% 15% 20% 25% 30% 35% 40% 45% 50% ABCDEFG Energy label class Share of models/market EU Market 1999 EU Market 1996 EU Market 1992 More EfficientLess Efficient EU Market 2003 Transforming the Equipment Market Impact of EU Label on Market of Cold Appliance BECADFG

54
BECADFG A+ A ++

55
Annual Market Share % 1999: MEPS Transforming the Equipment Market Impact of EU Label on Market of Cold Appliance

56
© by GfK MS, www.gfkms.com - Italy - SDA-MDA Dept. European Freezers Market in 2002

57
© by GfK MS, www.gfkms.com - Italy - SDA-MDA Dept. European Refrigerators Market in 2002

61
Labels of Light Sources

62
Beyond the label

63
European Car Label In application of EU Directive 99/94/EC, Several Countries (Denmark, NL, BE...) have selected the above format for Car Labelling G C
 have selected the above format for Car Labelling G C")
64
Energy Label also used for Buildings B In Austria, UK, Denmark, France…. private homes are being labeled F D

67
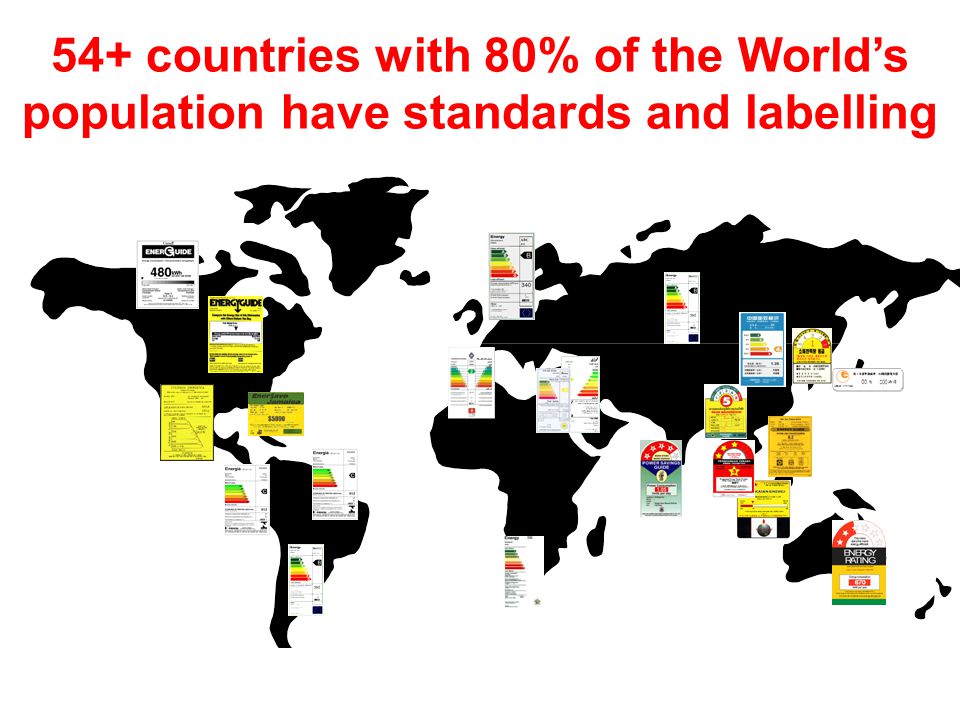
54+ countries with 80% of the Worlds population have standards and labelling

68
Most Products that Will Use Energy in Buildings in 2025 Have Not Yet Been Made End Use Energy Consumption in 2025 0% 10% 20% 30% 40% 50% 60% 70% 80% 90% 100% EuropeAfrica Energy Consumption (% of total) New stock Stock pre-2009
 New stock Stock pre-2009")
71
Appliance Energy Efficiency Standards in the US $2/Home $150/Home

72
Appliance Energy Efficiency Standards in the US $2/Home $150/Home $600/Home $450/Home

73
72

74
0% 5% 10% 15% 20% 25% 30% 35% 40% 45% 50% Percentage of Market Low Carbon Footprint High Carbon Footprint 6 Steps to move towards a low carbon building stock 2. Knowledge & understanding B E C A D F G 3.Rating & Benchmarking R&D 4. Research, & Demonstration 5. Set Minimum Standards 6. DSM, $ incentives, CDM …. 1. Set Right Price Signal $

75
Reduction in GHG GtCO2E per year Cost of Abattement $ / tCO2E/yr Some Mitigation Options Come at Negative Cost to Society O 2O 4O 6O -6O -4O -2O

77
Policies & barriers GEF, ODA Incentives FiTs, taxes, loans, CDM Carbon finance PoAs, sectoral crediting Research, development, demonstration Technology transfer

78
77

79
Scénario tendanciel 0 500 1 000 1 500 2 000 2 500 3 000 3 500 4 000 4 500 5 000 2 0002 0102 0202 0302 0402 050 TWh Renouvelables Uranium Pétrole Charbon Gaz

80
Scénario nW 0 500 1 000 1 500 2 000 2 500 3 000 3 500 4 000 4 500 5 000 2 0002 0102 0202 0302 0402 050 TWh Gaz Charbon Pétrole Uranium Renouvelables Efficacité demande Efficacité sur offre Sobriété

81
80 Scenario Negawatt pour la France

82
Inefficient Products to Museum All over the World!

Similar presentations


, Global Warming, and Energy Efficiency Richard Brent Solar Government Affairs Lake Tahoe, California July 28, 2005 California Manufacturers.>")


 Toyo Engineering Co. (TOYO)>")


 What can be concluded from the following pattern? 1 + 2 + 3 + 4 + 5 = 15 = 3 × 5 2 + 3 + 4 + 5 + 6 = 20 = 4 × 5 3 + 4 + 5 + 6 + 7 = 25 =>")