Download presentation
Presentation is loading. Please wait.

1
CAR Highlights

2
Balance Sheet All Funds (Page 1) Revenue All Funds (Page 3) Expenditures- General Fund (Page 8) Other Funds (Pages 10-22) Special Education (Page 28-45)
 Revenue All Funds (Page 3) Expenditures- General Fund (Page 8) Other Funds (Pages 10-22) Special Education (Page 28-45)")
3
CAR Highlights

4
Current Assets = Current Liabilities + Fund Equity 2010: $17,091,309 = $13,968,434 + $3,122,875 2011: $18,352,781 = $14,424,677 + $3,928,104 Balance Sheet General Fund - June 30, 2011

5
CAR Highlights Current Assets: 2010 2011 Cash & Investments $5,472,610 $6,554,020 Receivables 11,487,125 11,673,973 Prepaid Expenses 33,463 27,366 Inventories 98,111 97,422 $17,091,309 $18,352,781 Current Liabilities: Accounts Payable $367,689 $297,076 Accrued Payroll 2,617,867 2,690,124 Deferred Revenue 10,982,878 11,437,477 $13,968,434 $14,424,677 General Fund June 30, 2011

6
CAR Highlights

11
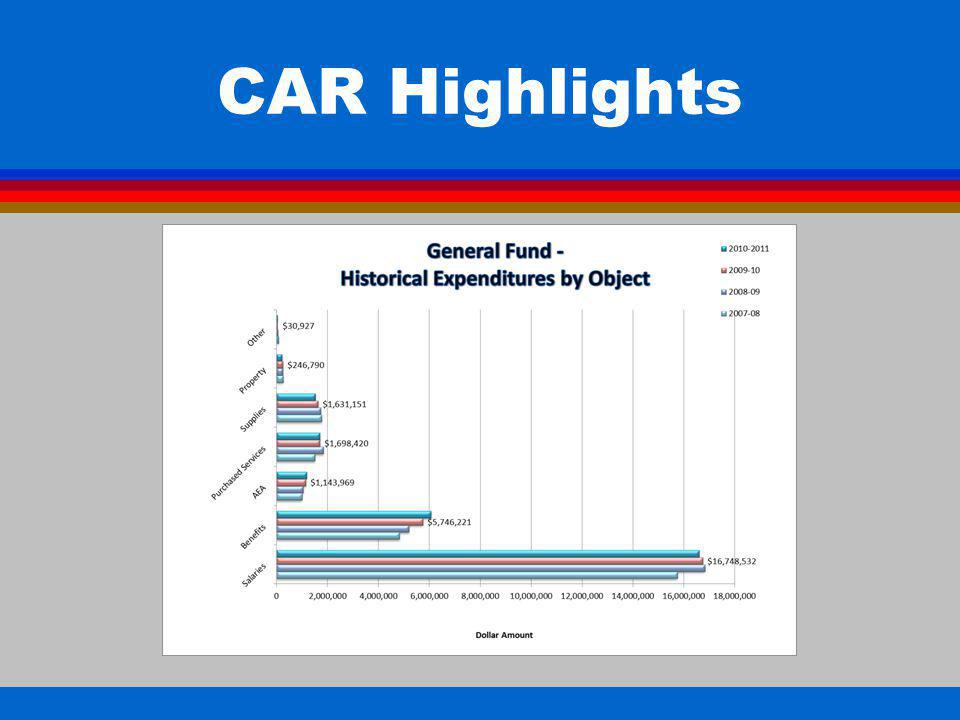
Total Expenditures = $27,307,997

12
CAR Highlights

16
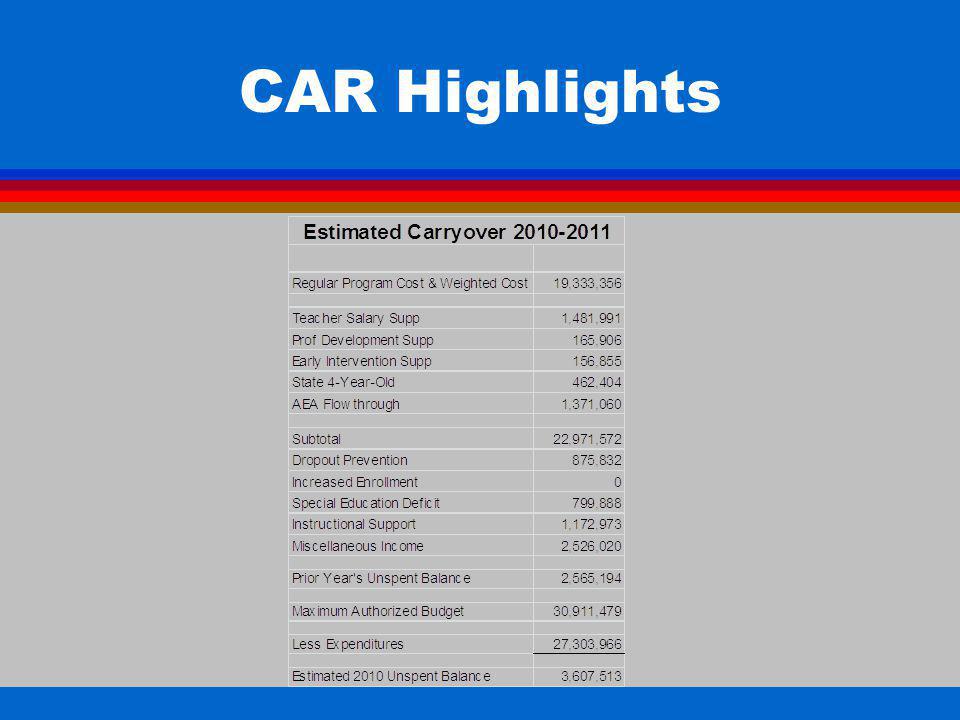
CAR HIGHLIGHTS Est. Act. Diff Special Ed Deficit 780,000 799,888 (19,888) Miscellaneous Income 2,535,495 2,526,020 9,475 Expenditures 28,048,715 27,303,966 744,749 Unspent Balance 2,920,990 3,607,513 (686,523) Included in the unspent balance is the restricted/reserved fund balance 20102011 Diff $408,138 584,776 176,638
 Miscellaneous Income 2,535,495 2,526,020 9,475 Expenditures 28,048,715 27,303, ,749 Unspent Balance 2,920,990 3,607,513 (686,523) Included in the unspent balance is the restricted/reserved fund balance Diff $408, , ,638.")
17
CAR Highlights

18
OTHER FUNDS Fund Beginning Balance RevenueExpenditures Ending Balance Management$1,082,630$46,021$477,057$651,594 Activity$314,987$851,187$863,534$302,640 PPEL$1,122,783$1,116,085$1,077,446$1,161,422 Capital Projects$3,277,796$2,390,152$1,492,889$4,175,059 Debt Service0000 Nutrition$631,876$1,466,236$1,424,182$673,930 Child Care$236,889$308,617$315,568$229,938 Self Funded Health$915,748$4,732,511$4,108,606$1,539,653

19
CAR Highlights Sales Tax Restricted (GASB 54) Attendance Center Solution$1,073,705 4 th Street Expansion 81,013 $1,154,718
 Attendance Center Solution$1,073,705 4 th Street Expansion 81,013 $1,154,718")
20
CAR Highlights

Similar presentations


 YOU 1 x 1 = 1 x 10 =10 1 x 1 = 1 x 3 =3 1 x 1 = 1 x 2.75 =2.75 1 x 1 = 1 x 2.50 =2.5 1 x 1 = 1 x 2 =2 1 x 1 = 1.>")


 Geometry (29%)>")