Download presentation
Presentation is loading. Please wait.

1
Google Fusion Tables API Inneke Ponet

2
Google Fusion Tables: Store, share, query and visualize data. API to run SQL-like queries applications that use Fusion Tables as a database. Google Fusion Tables

3
Send API statements to Goolge Fusion Tables: queries: HTTP GET requests; inserts, updates and deletes: HTTP POST requests. The API is language agnostic. It doesnt have a mechanism for submitting the GET and POST requests. Use existing code libraries (Java, Javascript,.NET, PHP, Python, Objective-C). Writing an application
. Writing an application.")
4
Exploring tables Query example https://www.google.com/fusiontables/api/query?sql=SHOW TABLES table id,name 274409,StoreInventory https://www.google.com/fusiontables/api/query?sql=DESCRIBE 274409 column id,name,type col0,Product,string col1,Inventory,number

5
Google Maps API Fusion Tables Layer Google Chart Tools Data source Fusion Tables with other APIs

6
Geographic data in a Fusion Table: Geocode of a street address, a name of a city, a name of a country; latitude, longitude pair; KML. FusionTablesLayer: interface to a Fusion Table, automatic rendering of the location data, clickable overlays. Google Maps

7
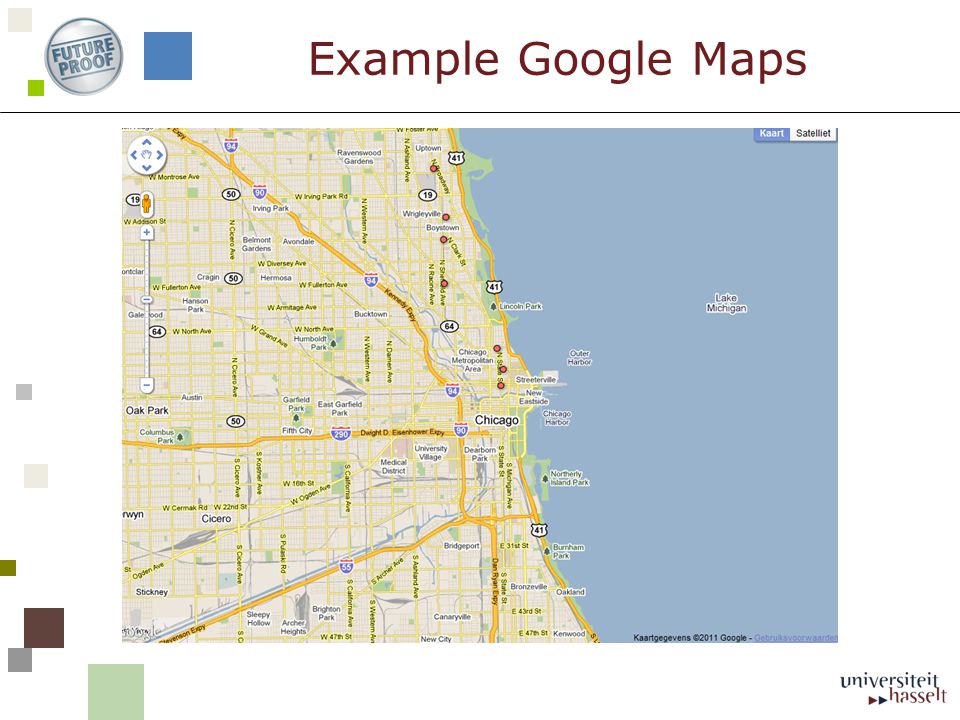
var chicago = new google.maps.LatLng(41.948766, -87.691497); map = new google.maps.Map(document.getElementById('map_canvas'), { center: chicago, zoom: 12, mapTypeId: 'roadmap' }); var layer = new google.maps.FusionTablesLayer({ query: { select: 'address', from: '198945', where: 'ridership > 5000' } }); layer.setMap(map); Example Google Maps
; map = new google.maps.Map(document.getElementById( map_canvas ), { center: chicago, zoom: 12, mapTypeId: roadmap }); var layer = new google.maps.FusionTablesLayer({ query: { select: address , from: , where: ridership > 5000 } }); layer.setMap(map); Example Google Maps")
9
http://www.mtbguru.com/

10
Google Chart Tool

11
google.load('visualization', '1', {'packages':['corechart']}); function changeData() { var queryText = encodeURIComponent( "SELECT Year, Austria, Bulgaria, Denmark, Greece FROM 641716"); var query = new google.visualization.Query( 'http://www.google.com/fusiontables/gvizdata?tq=' + queryText); query.send(getData); } function getData(response) { new google.visualization.BarChart(document.getElementById('visualization')). draw(response.getDataTable(), {title:"Yearly Coffee Consumption by Country", width:600, height:400, vAxis: {title: "Year"}, hAxis: {title: "Cups"}} ); } google.load('visualization', '1', {'packages':['corechart']}); function changeData() { var queryText = encodeURIComponent( "SELECT Year, Austria, Bulgaria, Denmark, Greece FROM 641716"); var query = new google.visualization.Query( 'http://www.google.com/fusiontables/gvizdata?tq=' + queryText); query.send(getData); } function getData(response) { new google.visualization.BarChart(document.getElementById('visualization')). draw(response.getDataTable(), {title:"Yearly Coffee Consumption by Country", width:600, height:400, vAxis: {title: "Year"}, hAxis: {title: "Cups"}} ); } Example Google Chart
![google.load( visualization , 1 , { packages :[ corechart ]}); function changeData() { var queryText = encodeURIComponent( SELECT Year, Austria, Bulgaria, Denmark, Greece FROM ); var query = new google.visualization.Query( tq= + queryText); query.send(getData); } function getData(response) { new google.visualization.BarChart(document.getElementById( visualization )).](http://images.slideplayer.com/7/1651352/slides/slide_11.jpg "draw(response.getDataTable(), {title: Yearly Coffee Consumption by Country , width:600, height:400, vAxis: {title: Year }, hAxis: {title: Cups }} ); } google.load( visualization , 1 , { packages :[ corechart ]}); function changeData() { var queryText = encodeURIComponent( SELECT Year, Austria, Bulgaria, Denmark, Greece FROM ); var query = new google.visualization.Query( tq= + queryText); query.send(getData); } function getData(response) { new google.visualization.BarChart(document.getElementById( visualization )). draw(response.getDataTable(), {title: Yearly Coffee Consumption by Country , width:600, height:400, vAxis: {title: Year }, hAxis: {title: Cups }} ); } Example Google Chart.")
13
google.load('visualization', '1'); function loadData(year) { var queryText = encodeURIComponent( "SELECT 'Male name', 'Reverse rank FROM 642040 WHERE year = '" + year + " ORDER BY 'Male name'"); var query = new google.visualization.Query( 'http://www.google.com/fusiontables/gvizdata?tq=' + queryText); query.send(getData); } function getData(response) { var outputDiv = document.getElementById('visualization'); var tc = new TermCloud(outputDiv); tc.draw(response.getDataTable(), null); } google.load('visualization', '1'); function loadData(year) { var queryText = encodeURIComponent( "SELECT 'Male name', 'Reverse rank FROM 642040 WHERE year = '" + year + " ORDER BY 'Male name'"); var query = new google.visualization.Query( 'http://www.google.com/fusiontables/gvizdata?tq=' + queryText); query.send(getData); } function getData(response) { var outputDiv = document.getElementById('visualization'); var tc = new TermCloud(outputDiv); tc.draw(response.getDataTable(), null); } Example Google Chart 2
; function loadData(year) { var queryText = encodeURIComponent( SELECT Male name , Reverse rank FROM WHERE year = + year + ORDER BY Male name ); var query = new google.visualization.Query( tq= + queryText); query.send(getData); } function getData(response) { var outputDiv = document.getElementById( visualization ); var tc = new TermCloud(outputDiv); tc.draw(response.getDataTable(), null); } google.load( visualization , 1 ); function loadData(year) { var queryText = encodeURIComponent( SELECT Male name , Reverse rank FROM WHERE year = + year + ORDER BY Male name ); var query = new google.visualization.Query( tq= + queryText); query.send(getData); } function getData(response) { var outputDiv = document.getElementById( visualization ); var tc = new TermCloud(outputDiv); tc.draw(response.getDataTable(), null); } Example Google Chart 2")
15
Example Fusion Tables http://www.google.com/fusiontables/DataSource?dsrcid=851292

16
Example Fusion Tables

17
Custom applications (HTTP GET and POST). Google Maps with FusionTableLayer. Google Chart and Fusion Tables as data source. Visualization in an HTML page. Fusion Tables in other applications

Similar presentations


>")


. What is SQL A programming language for databases. SQL (structured Query Language) It allows you add, edit, delete and run queries.>")


 Map rendering facility on Android device Similar to Google Earth Integrate map.>")


