Download presentation
Presentation is loading. Please wait.

1
JavaScript and Data Visualization Dominic DiFranzo

2
JavaScript Nothing to do with Java, a lot to do with scripts. prototype-based, dynamic, weakly typed, and first-class functions. Supports object-oriented, imperative, and functional programming. Mostly runs in client-side in web browsers Very object-based: Object property names are string keys: obj.x = 10 and obj['x'] = 10 are the same

3
Example function factorial(n) { if (n == 0) { return 1; } return n * factorial(n - 1); }
 { if (n == 0) { return 1; } return n * factorial(n - 1); }")
4
Example function sum() { var x = 0; for (var i = 0; i < arguments.length; ++i) { x += arguments[i]; } return x; } sum(1, 2, 3); // returns 6
![Example function sum() { var x = 0; for (var i = 0; i < arguments.length; ++i) { x += arguments[i]; } return x; } sum(1, 2, 3); // returns 6](http://images.slideplayer.com/12/3416129/slides/slide_4.jpg "Example function sum() { var x = 0; for (var i = 0; i < arguments.length; ++i) { x += arguments[i]; } return x; } sum(1, 2, 3); // returns 6")
5
Example function add1(n) { return n +1; } function map(func, list) { for (var i = 0; i < list.length; ++i) { list[i] = func(list[i]); } return list; }
![Example function add1(n) { return n +1; } function map(func, list) { for (var i = 0; i < list.length; ++i) { list[i] = func(list[i]); } return list; }](http://images.slideplayer.com/12/3416129/slides/slide_5.jpg "Example function add1(n) { return n +1; } function map(func, list) { for (var i = 0; i < list.length; ++i) { list[i] = func(list[i]); } return list; }")
6
Quick reference on other “things” DOM – Document Object Model AJAX - Asynchronous JavaScript and XML JSON - JavaScript Object Notation Same-origin policy and XSS (Cross Site Scripting)
")
7
JSON { "id": 1, "name": "Foo", "price": 123, "tags": ["Bar","Eek"] } data.id is 1 data.tags[0] is “Bar”
![JSON { id : 1, name : Foo , price : 123, tags : [ Bar , Eek ] } data.id is 1 data.tags[0] is Bar](http://images.slideplayer.com/12/3416129/slides/slide_7.jpg "JSON { id : 1, name : Foo , price : 123, tags : [ Bar , Eek ] } data.id is 1 data.tags[0] is Bar")
8
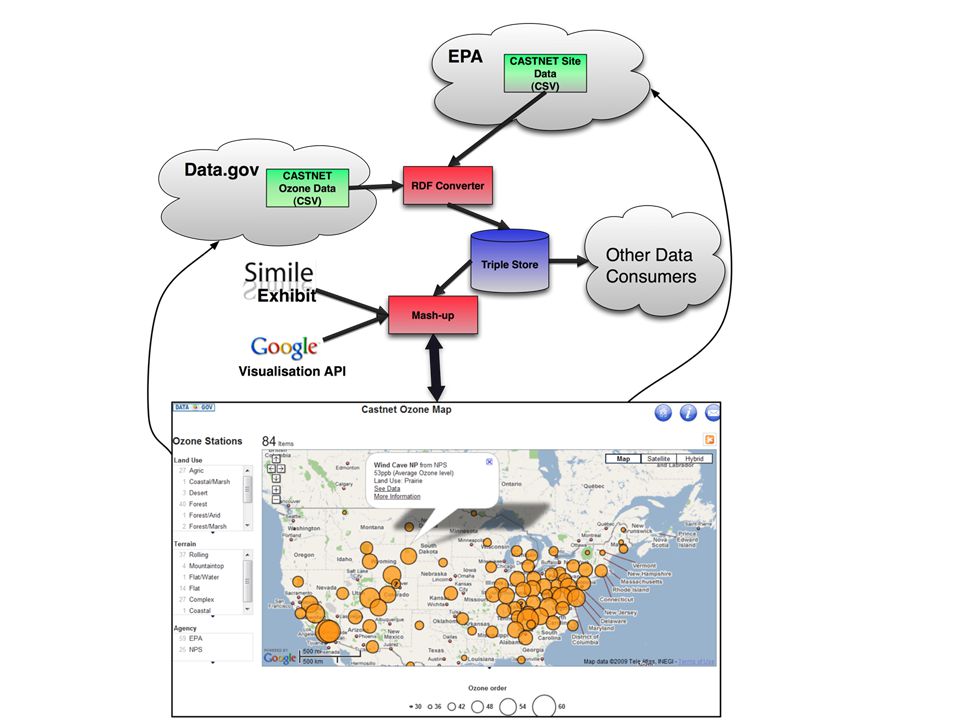
What We Have

9
What We Want

11
Start w/ Data and Query Think about the data you have, what it can mash with, how you could query it. Hardest part! What is in your data? What story do you want to tell? What is the quality of the data? What should it look like? All about visualization theory and design. A map? A pie chart? Something different? What interactions will the user have?

12
SPARQLProxy This is a web service that allows you to query any SPARQL endpoint, and get back the results in any format you want. A RESTful way to query any endpoint in any environment.

13
SPARQLProxy http://logd.tw.rpi.edu/sparqlhttp://logd.tw.rpi.edu/sparql? Paramiters: query: [required] encoded String of SPARQL query query-uri :[required] URI of SPARQL query (use as an alternative to "query" parameter. These two parameters are mutul-exclusive)
.")
14
SPARQLProxy service-uri: [required] URI of SPARQL Endpoint – default is the LOGD endpoint output: output format. ''xml'' - SPARQL/XML (default) : ''exhibit'' - JSON for MIT Exhibit : ''gvds'' - JSON for Google Visualization : ''csv'' - CSV : ''html'' - HTML table : “sparql” - SPARQL JSON
![SPARQLProxy service-uri: [required] URI of SPARQL Endpoint – default is the LOGD endpoint output: output format.](http://images.slideplayer.com/12/3416129/slides/slide_14.jpg "xml - SPARQL/XML (default) : exhibit - JSON for MIT Exhibit : gvds - JSON for Google Visualization : csv - CSV : html - HTML table : sparql - SPARQL JSON.")
15
Example http://logd.tw.rpi.edu/sparql.php?query- option=text&query=PREFIX+conversion%3A+%3C http%3A%2F%2Fpurl.org%2Ftwc%2Fvocab%2Fco nversion%2F%3E%0D%0ASELECT+%3Fg+sum%28 +%3Ftriples+%29+as+%3Festimated_triples%0D% 0AWHERE+{%0D%0A++GRAPH+%3Fg++{%0D%0A +++%3Fg+void%3Asubset+%3Fsubdataset+.%0D %0A+++%3Fsubdataset+conversion%3Anum_tripl es+%3Ftriples+.%0D%0A++}%0D%0A}+%0D%0AG ROUP+BY+%3Fg%0D%0A&service- uri=&output=html&callback=&tqx=&tp=

16
Example // compose query $sparqlproxy_uri = "http://logd.tw.rpi.edu/ws/sparqlproxy.php" $params = array(); $params["query-uri"] = "http://logd.tw.rpi.edu/demo/retrieving-sparql- results/datagov-list-loaded-dataset.sparql"; $params["service-uri"] = "http://services.data.gov/sparql"; $params["output"] = "gvds"; $query= $sparqlproxy_uri."?". http_build_query($params,,'&') ; //specific for Drupal //show query result echo file_get_contents($query);
![Example // compose query $sparqlproxy_uri = $params = array(); $params[ query-uri ] = results/datagov-list-loaded-dataset.sparql ; $params[ service-uri ] = ; $params[ output ] = gvds ; $query= $sparqlproxy_uri. .](http://images.slideplayer.com/12/3416129/slides/slide_16.jpg "http_build_query($params,, & ) ; //specific for Drupal //show query result echo file_get_contents($query);.")
17
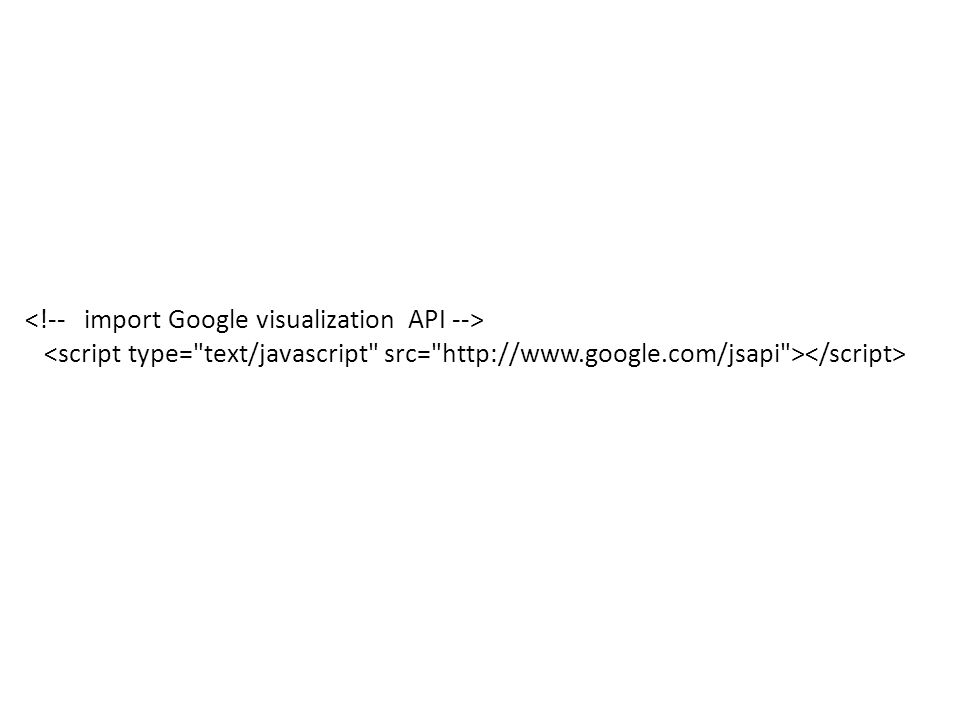
Visualizing The Data Many JavaScript API and Libraries to help make visualizations Trades in eases of use and control/customization. We will focus on the Google Visualization API, very easy to use out-of-the-box but almost impossible to customize outside of what they provide. http://code.google.com/apis/chart/interactive /docs/gallery.html http://code.google.com/apis/chart/interactive /docs/gallery.html

18
Visualization Example Start with a dataset(s) We will look into State Library Agency Survey: Fiscal Year 2006http://logd.tw.rpi.edu/source/data- gov/dataset/353/version/1st-anniversaryhttp://logd.tw.rpi.edu/source/data- gov/dataset/353/version/1st-anniversary and Tax Year 2007 County Income Data http://logd.tw.rpi.edu/source/data- gov/dataset/1356/version/2009-Dec-03
 We will look into State Library Agency Survey: Fiscal Year 2006http://logd.tw.rpi.edu/source/data- gov/dataset/353/version/1st-anniversaryhttp://logd.tw.rpi.edu/source/data- gov/dataset/353/version/1st-anniversary and Tax Year 2007 County Income Data gov/dataset/1356/version/2009-Dec-03")
19
Example Lets make a map of "Adjusted Gross Income(AGI) per Capita” a US map where each state is colored according to the average AGI per person living in that state. We obtain a state's AGI data from Dataset 1356 and a state's population data from Dataset 353.

20
Lets make a query http://logd.tw.rpi.edu/demo/building-logd- visualizations/mashup-353-population-1356- agi.sparql http://logd.tw.rpi.edu/demo/building-logd- visualizations/mashup-353-population-1356- agi.sparql

21
<!DOCTYPE html PUBLIC "-//W3C//DTD XHTML 1.0 Strict//EN" "http://www.w3.org/TR/xhtml1/DTD/xhtml1-strict.dtd"> AGI per Capita Map AGI per Capita Map Loading Map...

23
// load google visualization packages - STEP 1 google.load('visualization', '1', {'packages': ['geomap']}); // set callback function for drawing visualizations - STEP 2 google.setOnLoadCallback(drawMap);
![// load google visualization packages - STEP 1 google.load( visualization , 1 , { packages : [ geomap ]}); // set callback function for drawing visualizations - STEP 2 google.setOnLoadCallback(drawMap);](http://images.slideplayer.com/12/3416129/slides/slide_23.jpg "// load google visualization packages - STEP 1 google.load( visualization , 1 , { packages : [ geomap ]}); // set callback function for drawing visualizations - STEP 2 google.setOnLoadCallback(drawMap);")
24
function drawMap() { //Query data - STEP 3 var sparqlproxy = "http://logd.tw.rpi.edu/sparql"; var queryloc = "http://logd.tw.rpi.edu/demo/building-logd- visualizations/mashup-353-population-1356-agi.sparql"; var queryurl = sparqlproxy + "?" + "output=gvds” + “&query-option=uri” + "&query-uri=" + encodeURIComponent(queryloc) ; var query = new google.visualization.Query(queryurl); query.send(handleQueryResponse); }
 { //Query data - STEP 3 var sparqlproxy = ; var queryloc = visualizations/mashup-353-population-1356-agi.sparql ; var queryurl = sparqlproxy + + output=gvds + &query-option=uri + &query-uri= + encodeURIComponent(queryloc) ; var query = new google.visualization.Query(queryurl); query.send(handleQueryResponse); }")
25
function handleQueryResponse(response){ // Check for query response errors. - STEP 4 if (response.isError()) { alert('Error in query: ' + response.getMessage() + ' ' + esponse.getDetailedMessage()); return; }
) { alert( Error in query: + response.getMessage() + + esponse.getDetailedMessage()); return; }.")
26
// read data - STEP 5 var data = response.getDataTable(); // create new data - STEP 6 var newdata = new google.visualization.DataTable(); newdata.addColumn('string', 'State'); newdata.addColumn('number', 'AGI per Capita');
; // create new data - STEP 6 var newdata = new google.visualization.DataTable(); newdata.addColumn( string , State ); newdata.addColumn( number , AGI per Capita );")
27
// populate each row - STEP 7 var rows = data.getNumberOfRows(); for (var i = 0; i < rows; i++ ) { var state = 'US-' + data.getValue(i, 0); // AGI figure uses thousand-dollar unit var value = Math.round(data.getValue(i, 1)*1000/ data.getValue(i, 2)); newdata.addRow([state, value]); }
![// populate each row - STEP 7 var rows = data.getNumberOfRows(); for (var i = 0; i < rows; i++ ) { var state = US- + data.getValue(i, 0); // AGI figure uses thousand-dollar unit var value = Math.round(data.getValue(i, 1)*1000/ data.getValue(i, 2)); newdata.addRow([state, value]); }](http://images.slideplayer.com/12/3416129/slides/slide_27.jpg "// populate each row - STEP 7 var rows = data.getNumberOfRows(); for (var i = 0; i < rows; i++ ) { var state = US- + data.getValue(i, 0); // AGI figure uses thousand-dollar unit var value = Math.round(data.getValue(i, 1)*1000/ data.getValue(i, 2)); newdata.addRow([state, value]); }")
28
// configure map options - STEP 8 var options = {}; options['region'] = 'US';// show US map options['dataMode'] = 'regions'; options['width'] = 900; options['height'] = 550;
![// configure map options - STEP 8 var options = {}; options[ region ] = US ;// show US map options[ dataMode ] = regions ; options[ width ] = 900; options[ height ] = 550;](http://images.slideplayer.com/12/3416129/slides/slide_28.jpg "// configure map options - STEP 8 var options = {}; options[ region ] = US ;// show US map options[ dataMode ] = regions ; options[ width ] = 900; options[ height ] = 550;")
29
// define geomap instance - STEP 9 var viz = document.getElementById('map_canvas'); new google.visualization.GeoMap(viz).draw(newdata, options ); }//end of handleQueryResponse function //end of JavaScript Tag
; new google.visualization.GeoMap(viz).draw(newdata, options ); }//end of handleQueryResponse function //end of JavaScript Tag")
30
See Live Version - http://logd.tw.rpi.edu/demo/building-logd- visualizations/agi-per-capita-v2.html

Similar presentations


 Introducing JavaServer Pages TM (JSP TM ) JSP scripting elements.>")

 Norman White.>")


