Download presentation
Presentation is loading. Please wait.

1
1 The PFC concept is: §Based on the fact that systems need to be functional before they can produce aquatic or riparian values – or desired conditions

2
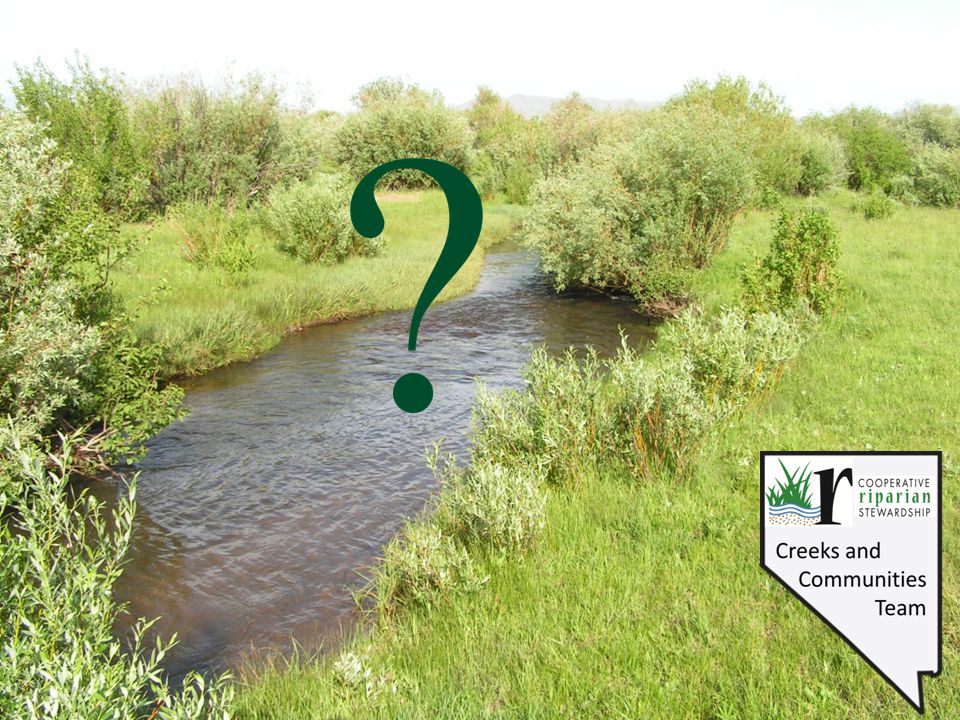
Current Conditions Desired Future Conditions

3
Current Conditions Desired Future Conditions PFC

4
PFC Provides necessary broad scale perspective Triage: Assign priority order to projects where resources can be best used, are most needed, or are most likely to achieve success Focus on FAR reaches w/high values (to avoid loss of function & values) Focus management & monitoring to on no answers Appropriate time for experienced IDT to locate representative DMAs Why PFC (Prichard et al. 1998)?
 .")
5
§Broad scale assessments provide landscape scale overview of existing conditions… §define the scope of the issues/problem… §develop solutions that become alternatives)… §Focusing on physical functioning helps communicate among stakeholders WHY PFC?
… §Focusing on physical functioning helps communicate among stakeholders WHY PFC")
6
Step 1: Assess riparian resource function using PFC a.Identify assessment area and assemble an ID team b.Review existing information and delineate and stratify reaches c.Determine reach potential d.Complete PFC assessment (validate with monitoring data if necessary) Integrated Riparian Management
 Integrated Riparian Management")
7
Step 3: Identify issues, goals, actions and priorities and establish objectives a.Identify issues, goals, actions, and priorities b.Collect baseline data and establish or modify existing objectives Step 4: Design and implement management and restoration actions Step 6: Implement adaptive actions Modify Objectives if Necessary Monitor Adaptive Actions Step 2: Identify riparian resource values and complete additional assessments Step 5: Monitor and analyze effectiveness of actions and update resource condition ratings (PFC) Step 1: Assess riparian resource function using PFC
 Step 1: Assess riparian resource function using PFC")
8
Degradation Rates

9
Recovery Rates Non-Functional

10
Bear Creek May 1977

11
Bear Creek Sept 1997 20 years

12
Date -40 -20 0 20 40 60 80 100 8-Aug 12-Aug16-Aug20-Aug24-Aug28-Aug Temperature (Degrees F) Air Water Difference Difference in Air & Water Temperatures Bear Creek - Central Oregon 1976
 Air Water Difference Difference in Air & Water Temperatures Bear Creek - Central Oregon 1976")
13
Difference in Air & Water Temperatures Bear Creek - Central Oregon 1998 0 20 40 60 80 100 120 7-Aug 11-Aug 15-Aug 19-Aug 23-Aug27-Aug 31-Aug Date Temperature Degrees F Air Water Difference

14
Bear Creek (3.5 Miles) Data from C. Rasmussen (1996) and W. Elmore 19781994 Riparian Area 3.8 acres12 acres Bank Erosion 12,448 feet799 feet Water Storage 500,000 gal/mi 2,096,000 gal/mi Production200 lbs/acre2000 lbs/acre

15
Management needs change A.Continue what works B.Focus on risks: 1.Trampling - season of use 2.Weak plants - duration of use 3.Up or Downstream - water, sediment, ___? E.Focus on recovery: 1.Willows - season of use, rest 2.Sedges - rotation, duration F. Continue what works

16
Good Resource Objectives Describe the continuing resource attributes to be achieved by management Achievable, Measurable, Worthy

17
Objectives should Be: §S pecific – What will be achieved, where, and when §M easurable – With recognized monitoring methods §A chievable – With likely management §R ealistic – Within the timeframe and budget §T rackable – Within law, policy, plans, and issues

18
A Management Chain Reaction §Rotation grazing for three weeks (or other strategy) leads to §A four inch stubble height and 85% growing season recovery leads to §An increase in colonizers leads to §Deposition there of fine sediments leads to §An increase in stabilizers leads to §Narrowing a stream leads to §Increased floodplain access & aquifer recharge leads to §Improved base flow leads to §Improved water and habitat quality leads to §Increased fish populations leads to §Increased recreationist satisfaction §So, which of these provides the best focus for an objective?
 leads to §A four inch stubble height and 85% growing season recovery leads to §An increase in colonizers leads to §Deposition there of fine sediments leads to §An increase in stabilizers leads to §Narrowing a stream leads to §Increased floodplain access & aquifer recharge leads to §Improved base flow leads to §Improved water and habitat quality leads to §Increased fish populations leads to §Increased recreationist satisfaction §So, which of these provides the best focus for an objective")
19
A Management Chain Reaction Where is the objective? §Rotation grazing §A four inch stubble height §and 85% growing season recovery §An increase in colonizers §Deposition there of fine sediments §An increase in stabilizers §Narrowing a stream §Increased floodplain access & aquifer recharge §Improved base flow etc. §Improved habitat quality §Improved water quality §Increased fish populations §Increased recreationist satisfaction Efficiently Monitored (MIM) Objectives Efficiently Monitored Actions or tools PFC Values (difficult to monitor)
 Objectives Efficiently Monitored Actions or tools PFC Values (difficult to monitor).")
20
Objectives should be quantified for a specific location using baseline data and experience For example: §At the Designated Monitoring Area 2 on Bear Camp Creek: l Increase colonizers by X % l Increase stabilizers by Y % l Narrow the greenline to greenline width by Z %

21
Match Objectives to Planning Timeline T I M E ANNUAL INDICATORS OF MANAGEMENT = End-of-season condition residual vegetation bank alteration Recovery period 3 - 5 - YEARS INDICATORS OF RECOVERY = Vegetative greenline = Water and Habitat Quality DECADES INDICATORS OF RECOVERY 5 - 10 YEARS INDICATORS OF RECOVERY = Vegetative/Physical X-section composition Woody recruitment Greenline to Greenline Width Bank Stability e.g. Temp Pools e.g.

22
T I M E ANNUAL INDICATORS OF MANAGEMENT = End-of-season condition residual vegetation residual vegetation bank alteration bank alteration Recovery period Recovery period 3 - 5 - YEARS INDICATORS OF RECOVERY = Vegetative Greenline composition = Water and Habitat Quality DECADES INDICATORS OF RECOVERY 5 - 10 YEARS INDICATORS OF RECOVERY = Vegetative/Physical X-section composition Woody recruitment Greenline to Greenline Width Bank Stability e.g. e.g. Temp pools e.g. Match Objectives to Planning Timeline

23
T I M E ANNUAL INDICATORS OF MANAGEMENT = End-of-season condition residual vegetation residual vegetation bank alteration bank alteration Recovery period Recovery period 3 – 5+ - YEARS INDICATORS OF RECOVERY = Vegetative = Vegetative Greenline composition Greenline composition = Water and Habitat Quality DECADES INDICATORS OF RECOVERY 5 – 10+ YEARS INDICATORS OF RECOVERY = Vegetative/Physical X-section composition Woody recruitment Greenline to greenline width Bank Stability e.g. e.g. e.g. Temp pools e.g. Match Objectives to Planning Timeline

24
T I M E ANNUAL INDICATORS OF MANAGEMENT = End-of-season condition residual vegetation residual vegetation bank alteration bank alteration Recovery period Recovery period 3 – 5+ - YEARS INDICATORS OF RECOVERY = Vegetative = Vegetative Greenline Composition Greenline Composition = Water and Habitat Quality DECADES INDICATORS OF RECOVERY 5 – 10+ YEARS INDICATORS OF RECOVERY = Vegetative/Physical = Vegetative/Physical X-section composition X-section composition Woody recruitment Woody recruitment Greenline to greenline width Greenline to greenline width Bank Stability Bank Stability e.g. e.g. e.g. Temp. or width Pool quality e.g. Match Objectives to Planning Timeline

25
NON-LINEAR TIMELINES The power of drought – For allowing vegetation to encroach into a stream The power of Floods – For moving sediment, building banks, forming channels The power of disturbance – for reinitiating succession

26
More generally successful than not Generally successful Early use Short duration Cool season Riparian pasture Rotate use areas and timing Light to moderate use Long recovery periods Regrowth before winter Jumpstart or occasional rest Stutter deferred More off-riparian water Well scattered supplements/salt Cleaned pastures and closed gates PFC – Resilience Select for hill climbers Riding for animal placement Yearlings Generally unsuccessful Season-long use Long season of use Hot or dry growing season use Giant pastures - upland objectives Consistent seasonal use Heavy use too often Little time for regrowth Late use Annual use Little woody recovery Only riparian water Salt on creeks Stragglers At risk or nonfunctional Retain riparian dwellers Little or no riding Cow calf pairs

27
Core Grazing Management Principles §Avoid stress on important forage plants l Moderate or lower utilization OR l Graze for only a short period when plants are growing (shorter when growing faster) §Provide long growing season recovery with no grazing before next use §Graze in a different season at next use
 §Provide long growing season recovery with no grazing before next use §Graze in a different season at next use")
28
PFC in Documents Communicating with stakeholders Purpose and need Description of the existing environment Selection of alternatives Effects of proposed actions Planning monitoring Criteria for adapting management

29
» Desired Future Condition (DFC) PFC does not equal PFC does not replace » Legal Requirements, e.g., ESA, CWA Supports
 PFC does not equal PFC does not replace » Legal Requirements, e.g., ESA, CWA Supports")
30
» Strategize appropriate monitoring PFC Helps » Understand what can be achieved » Define/prioritize issues to address » Select appropriate management practices » Provide linkage between reach/watershed processes and habitat/water quality conditions Communicate among stakeholders

Similar presentations