Download presentation
Presentation is loading. Please wait.

1
3.3 HOW MARKET FORCES AFFECT SUPPLY AND DEMAND AGRICULTURAL AND HORTICULTURAL SCIENCE

2
AchievementAchievement with Merit Achievement with Excellence Demonstrate understanding of how market forces affect supply of and demand for New Zealand primary products. Demonstrate in- depth understanding of how market forces affect supply of and demand for New Zealand primary products. Demonstrate comprehensive understanding of how market forces affect supply of and demand for New Zealand primary products.

3
WHAT IS PRIMARY PRODUCTION? Primary: Being first in a list, series, or sequence Industry:A specific branch of manufacture and trade A Primary Industry is therefore a business that is the first in a series of businesses Primary Industry refers to a business that turns natural resources into products e.g. farming and fishing.

4
Write down 10 examples

5
SUPPLY AND DEMAND WHAT ARE THEY?

6
What is DEMAND? The law of demand states:- That a decrease in the price of a good will lead to an increase in the quantity demanded, all other factors remaining the same. Each time a consumer buys something, they are creating a demand. All the people who buy things then create market demand.

7
The demand curve An individuals demand curve can be plotted from data contained in a demand schedule. This is a table that sets out the quantity of a good or service that a consumer is willing and able to buy at a range of prices in a period of time.

8
Example – Price $Quantity per month 2.00 2.50 3.00 3.50 4.00 10 8 6 4 2 Wendys demand schedule for hamburgers Mrs Jesseps demand for schedule for chicken Price per chicken $Quantity per month 16 14 8 6 11241124

9
A demand schedule consists of two columns The range of prices Quantity demanded at each price The first row of each column should clearly indicate the type of information and the units used. The title of the schedule must indicate the type of information being demanded and by whom, and somewhere the period must be stated, whether it is per week per day or per year.

10
The demand curve Price is always plotted n the vertical axis and quantity demanded on the horizontal axis. The demand curve is plotted accurately The axis and curve are labelled appropriately The title indicates whose demand for which commodity The time period concerned is stated in the title of axis label

12
Market demand This is the total of everyones individual demand The market for most commodities is made up of many individuals Therefore the demand curve is made up of all of those individuals demand schedules or curves. It is the quantity of the good that all consumers will buy at any price.

13
Example 1 Individual and market demand schedules for ice creams per week PRICE $ QUANTITY DEMANDED BY:MARKET DEMAND ABCDE 1.50 2.00 2.50 3.00 3.50 4.00

14
EXAMPLE 2 – FILLET STEAK PRICE $/KG QUANTITY DEMANDED BY:MARKET DEMAND ABCDE 35.00 30.00 25.00 20.00 15.00 10.00

15
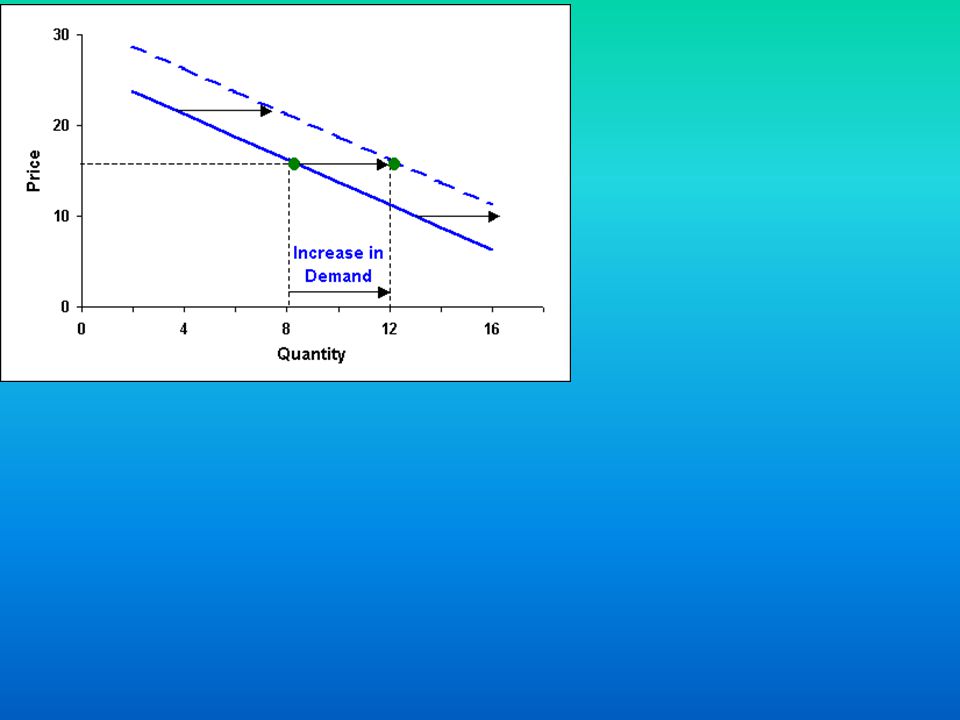
Movements along a demand curve A movement along a demand curve will only result if there is a change in price A fall in price will lead to an increase in the quantity demanded A rise in price will lead to a decrease in the quantity demanded.

20
Change in demand Factors that will shift the demand curve are changes in:- Income Consumer preferences The prices of other related goods and services

21
CONSUMER INCOMES An increase in income will result in an increase in demand for a commodity. Consumers are able to spend more and as a results will purchase more goods and services at each price

22
Incomes change because of Increase in wages or salaries Increases in profits Increases in interest earned on money Increases in transfers such as inheritances and benefits Decreases in personal taxes.

23
What is SUPPLY? Defined as:- The quantity of a good or service a supplier will willingly bring to the market at a range of prices.

24
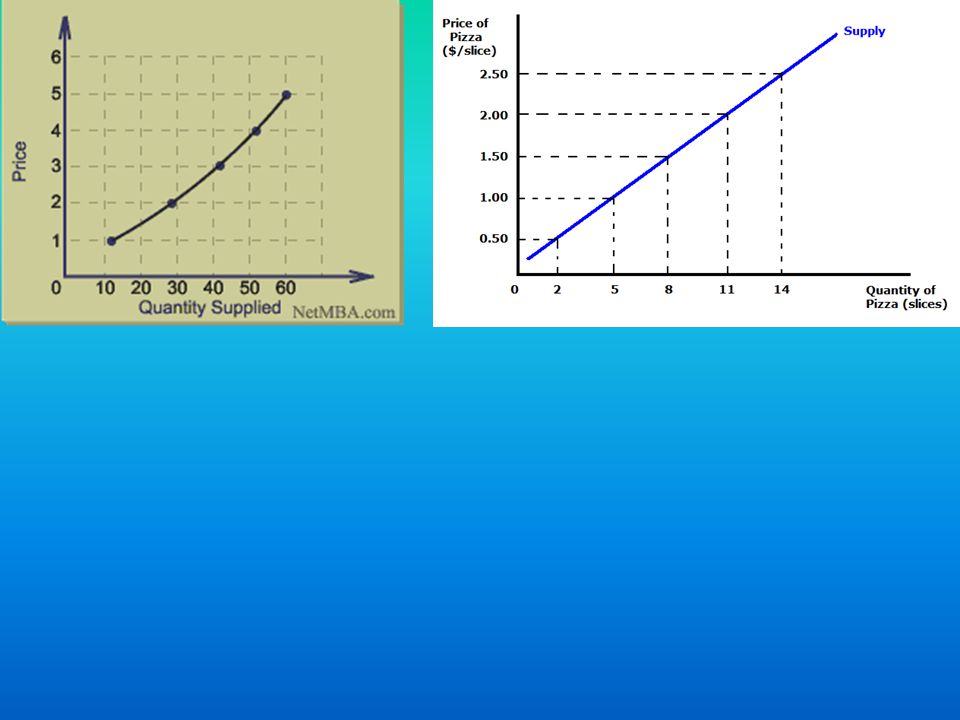
Supply curve Conventionally drawn with the price on the vertical axis, labelled and with units. The quantity is shown on the horizontal axis, labelled with units. The title should indicate the name of the supplier, what is being supplied and in what time period. The supply curve is then drawn using the information from the schedule and the curve is labelled S

26
Law of supply States:- An increase in the price will lead to an increase in the quantity supplied (and vice versa) Price is not the same as cost. Cost is the firms cost of production (including the resources and services) to make a certain output
 to make a certain output.")
27
The supply curve is upward sloping because at higher prices producers are prepared to supply more to the market, because they can make more profit from doing so. There is a positive relationship between price and quantity supplied: as one factor increases so does the other ( and vice versa)
.")
28
Seasonality What does this mean How does it affect supply/demand How do farmers cope with demand How does it affect price

29
Quantity available What does this mean Meeting commitments Seasonal factors

30
Quality requirements What do customers want from NZ produce Fruit – colour, sweetness Meat – pH level fat score, meat grades Processing Vacuum packing Chemical residues

31
Reliability of supply Contracts what happens if we cant supply

Similar presentations