Download presentation
Presentation is loading. Please wait.

1
Oregon EPHT Dan Rubado, Epidemiologist Environmental Public Health Tracking Program Office of Environmental Public Health Oregon Health Authority

3
surveillance indicators to assess the quality of Oregons community design

4
Affordable housing Housing cost burden Food environment Grocery, produce, WIC, convenience, fast food, restaurants Recreation facilities Parks, schools, bikeways, indoor facilities Walkability Street connectivity, walking destinations, density Public safety Traffic injuries Substance use environment Alcohol and tobacco retailers Transportation Public transit, active transportation

5
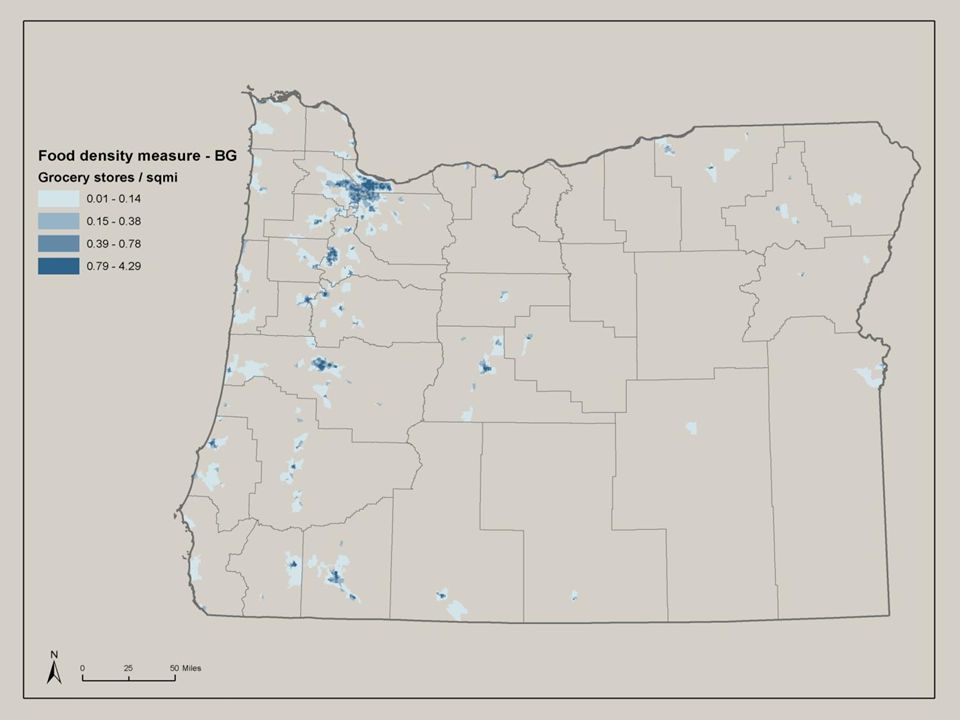
MeasureDescription Data SourcesDisplayDefinitions Produce market density # of farmer and produce markets per sq. mile Employment Department, Farmers Market Assn, WIC raster and choropleth density maps fruit and vegetable markets, Oregon Farmers' Market Association listed markets Grocery store density # of large grocery stores per sq. mile Employment Department super market or grocery store with >9 employees, warehouse club Small grocery store density # of small and specialty groceries per sq. mile Employment Department grocery store with 5-9 employees or specialty food store Healthy food density # of produce, large and small groceries per sq. mile Employment Department, Farmers Market Assn, WIC combination of produce, grocery and small grocery measures

6
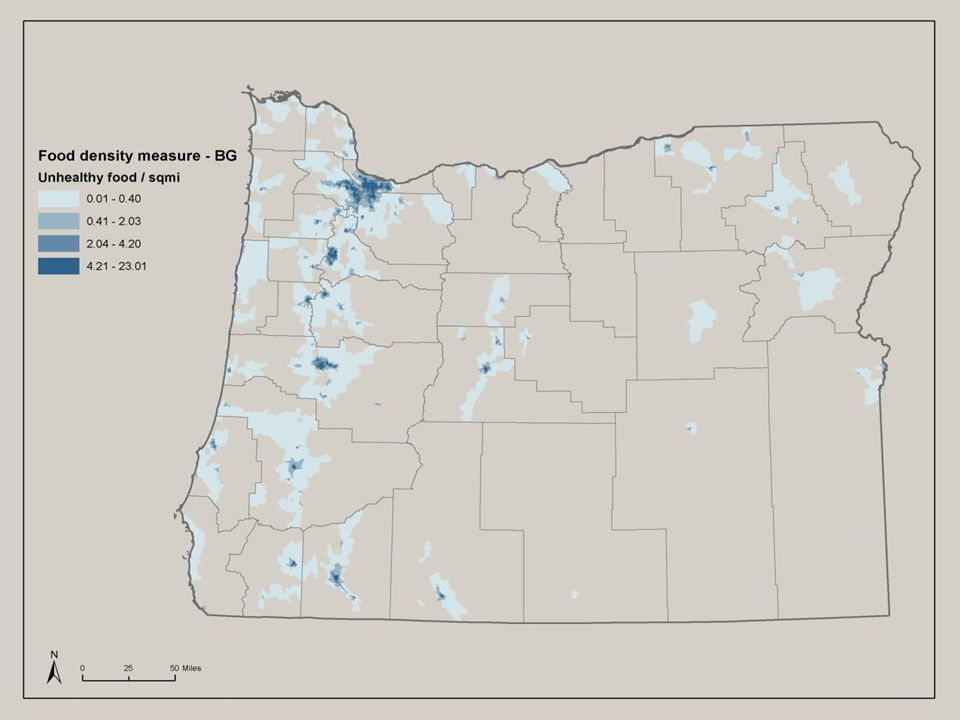
MeasureDescription Data SourcesDisplayDefinitions Convenience store density # of convenience stores per sq. mile Employment Department raster and choropleth density maps convenience stores, gas station stores, grocery stores with <=4 employees Fast food restaurant density # of fast food restaurants per square mile Employment Department large chain restaurants selling inexpensive, calorie dense, high fat, high sugar, high salt, or processed foods Unhealthy food retailer density # of convenience stores and fast food restaurants per sq. mile Employment Department combination of convenience store and fast food restaurant measures Restaurant density # of total restaurants per sq. mile Employment Department all restaurants and prepared food vendors Retail food environment index Ratio of # of groceries and produce markets to fast food and convenience stores Employment Department, Farmers Market Association, WIC combination of healthy and unhealthy food retailers

7
N 1 mile block group boundary n = 6 d1 d2 n = 2 n 4 Block group score = average of grid cells food retailer Inverse distance weighted average

17
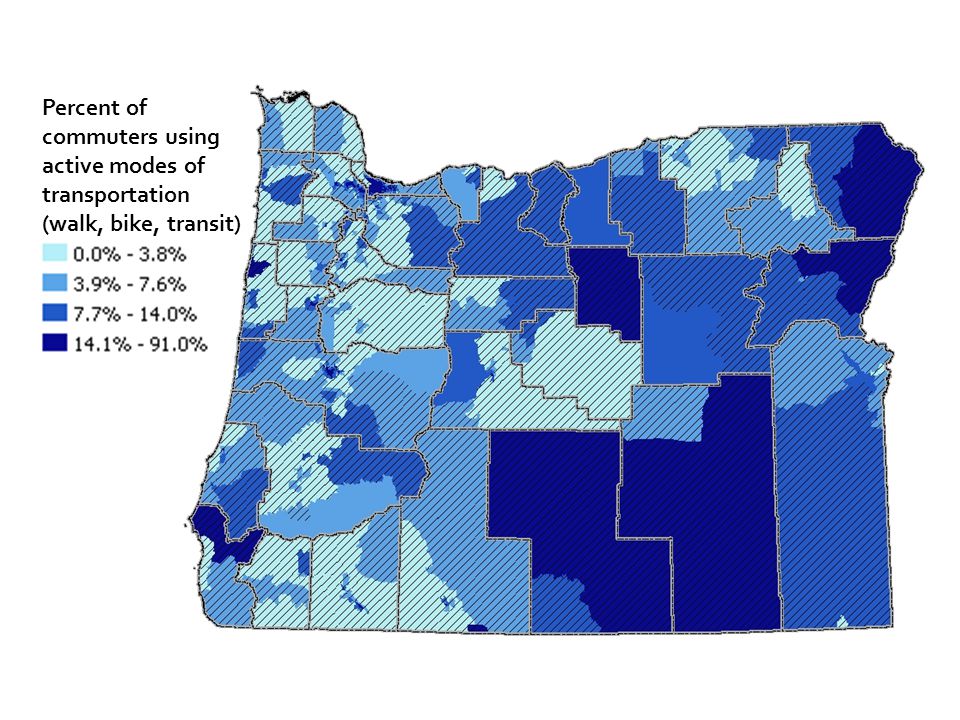
MeasureDescription Data SourcesDisplayDefinitions Bicycling % of commuters biking to work ACS 5-year estimates Choropleth maps; County and Census tract geography Commuters are employed workers, 16+ years old, who travel to work (excludes working from home) Walking % of commuters walking to work Public transit % of commuters taking public transit to work Active transportation % of commuters biking, walking or taking public transit to work
 Walking % of commuters walking to work Public transit % of commuters taking public transit to work Active transportation % of commuters biking, walking or taking public transit to work")
18
Percent of commuters using active modes of transportation (walk, bike, transit)
")
20
MeasureDescription Data SourcesDisplayDefinitions Intersection density # of intersections per square mile ACS streets data Choropleth # of street network intersections per square mile, minus highways and Walking destinations # of total walking destinations accessible within a X mile network distance Oregon Dept of Employment Choropleth + point density ?

22
MeasureDescription Data Sources DisplayDefinitions Owner cost burden % of owner – occupied households spending >30% of household income on housing costs ACS 5-year estimates Choropleth maps County and census tract geography Owner housing costs = mortgage + utilities Renter cost burden % of renter–occupied households spending >30% of household income on housing costs Renter housing costs = rent + utilities

23
Owner households Renter households

24
Owner households Renter households

25
15.3 – 19.0% 19.1 – 20.8% 20.9 – 22.3 % 22.4 – 24.7% Percent of owner households spending >30% of household income on housing costs

26
0.0 – 20.4% 20.5 – 22.7% 22.8 – 25.0% 25.1 – 50.0%

27
0.0 – 5.4% 5.4 – 7.2% 7.2 – 10.0 % 10.0 – 40.0% Percent of renter households spending >30% of household income on housing costs

28
0.0 – 25.8% 25.9 – 29.4% 29.5 – 34.1% 34.2 – 50.0%

29
MeasureDescription Data SourcesDisplayDefinitions Access to parks and greenways % of population residing within X miles of a designated park or greenway Oregon Parks Dept, GEO, Local GIS office parks and open space inventories choropleth + locations of facilities Parks: are defined by local jurisdictions and may include state, county, city and regional parks Access to public schools % of population residing within X miles of public school grounds Oregon GEO school locations Public schools: are enumerated by the Dept of Education Access to parks, greenways and public schools % of population residing within X miles of a designated park, trail or public school grounds Oregon Parks Dept, Local GIS office parks and open space inventories See above definitions. Bikeway density Ratio of miles of existing bikeways to square miles Local GIS office bike routes Bikeways: Defined by local MPO. Must be existing, marked bike lanes, off-street paths, or bike boulevards Access to indoor recreation facilities % of population residing within X miles of an indoor facility Dept of Employment Indoor facilities: gyms, swimming pools, athletic clubs

31
Contact Info: Dan Rubado, Epidemiologist Oregon Environmental Public Health Tracking Program Phone: 971-673-1210 E-mail: daniel.j.rubado@state.or.us

Similar presentations


 Order 2005 Fire Safety Order What is the Fire Safety Order? The order was made, under the Regulatory Reform Act 2001.>")


 Gregory.>")