Download presentation
Presentation is loading. Please wait.

1
Water Resources 1. Hydrologic Cycle and Water Reservoirs 2. Floods and Flood Control 3. Use of Water 4. Water Composition 5. Water Problems

2
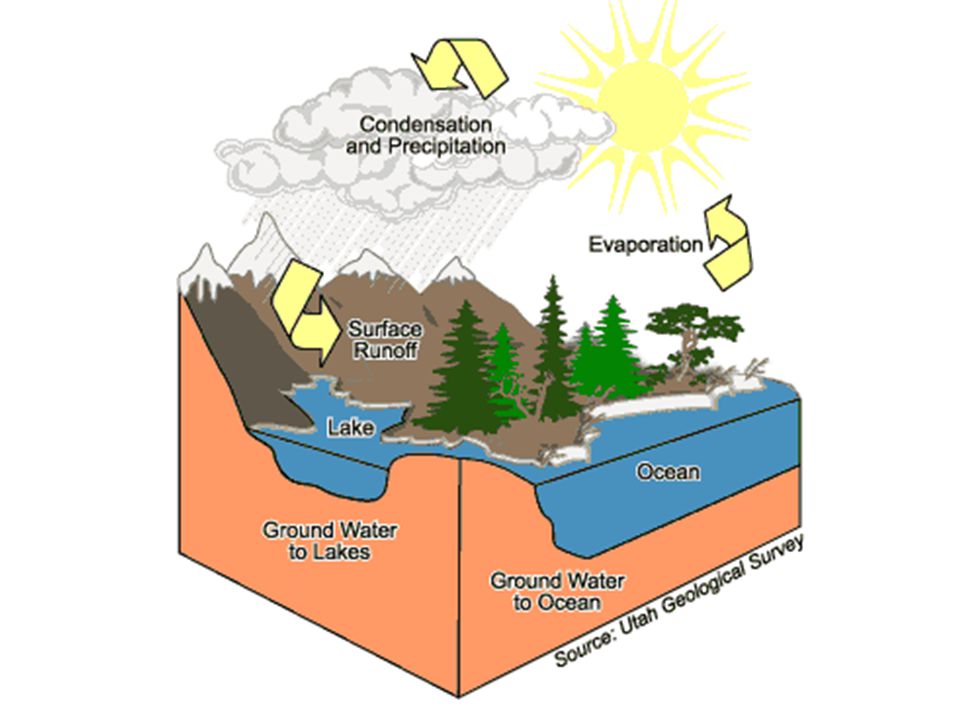
Hydrologic Cycle

4
Distribution of Water (from Resources of the Earth 1972 data) TypeLocationVolume (l)Percent SurfaceLakes1.25 x 10 17 0.009 Saline lakes/seas1.04 x 10 17 0.008 Streams1.00 x 10 15 0.0001 SubsurfaceVadose6.7 x 10 16 0.005 Groundwater (to 750 m)4.17x 10 18 0.31 Groundwater (below 750m)4.17x 10 18 0.31 Other ReservoirsIcecaps, glaciers2.9 x 10 19 2.15 Atmosphere1.3 x 10 16 0.001 Oceans1.32 x 10 21 97.2
 TypeLocationVolume (l)Percent SurfaceLakes1.25 x Saline lakes/seas1.04 x Streams1.00 x SubsurfaceVadose6.7 x Groundwater (to 750 m)4.17x Groundwater (below 750m)4.17x Other ReservoirsIcecaps, glaciers2.9 x Atmosphere1.3 x Oceans1.32 x")
5
Distribution of Water h ttp://ga.water.usgs.gov/edu/waterdistribution.html (1997 data) h ttp://ga.water.usgs.gov/edu/waterdistribution.html SourceVolume (km 3 )% Fresh% Total Oceans1338 x 10 6 96.5 Ice caps/glaciers24 x 10 6 68.71.74 Groundwater23.4 x 10 6 Fresh10.53 x 10 6 30.10.76 Saline12.87 x 10 6 0.94 Soil Moisture.0165 x 10 6 0.050.001 Permafrost0.3 x 10 6 0.860.022 Lakes0.1764 x 10 6 0.013 Fresh0.091 x 10 6 0.260.007 Saline0.0854 x 10 6 0.006 Atmosphere0.0129 x 10 6 0.040.001 Swamp Water0.0115 x 10 6 0.030.0008 Rivers0.00212 x 10 6 0.0060.0002 Biological Water0.00112 x 10 6 0.0030.0001
 h ttp://ga.water.usgs.gov/edu/waterdistribution.html SourceVolume (km 3 )% Fresh% Total Oceans1338 x Ice caps/glaciers24 x Groundwater23.4 x 10 6 Fresh10.53 x Saline12.87 x Soil Moisture.0165 x Permafrost0.3 x Lakes x Fresh0.091 x Saline x Atmosphere x Swamp Water x Rivers x Biological Water x")
6
Bibliographical Acknowledgment referenced publication for content development Peixoto and Kettani, 1973 The Control of the Water Cycle Scientific American - Vol. 228 - pp. 46-6

7
Heat Capacity of Water This means that water has the ability to absorb and hold heat with a minimal change in temperature Why? When water evaporates it takes 540 cal/gm. This means that evaporation creates a cooling effect. Ice going to water releases 80 cal/gm, thus releasing heat

10
World water resources http://www.worldmapper.org/

11
Evaporation (mean annual U.S.) http://geochange.er.usgs.gov/sw/changes/natural/et/
")
12
http://ga.water.usgs.gov/edu/watercycleevapotranspiration.html Evapotranspiration

13
Mean Annual Evapotranspiration

14
When ppt >>> e/t Then we get rivers and streams Eastern NAwater surplus Western USwater deficiency Plays a role in population density in U.S. and Canada

15
Freshwater Reservoirs Rivers and Streams Lakes Icecaps Groundwater

16
Much greater in volume than either lakes or streams Non-renewable in our lifetime

17
Water Table Surface below which pores and fractures of rocks and overburden are water filled

18
What is an aquifer? Geologic formation that possesses porosity and permeability

19
Water Resources 1. Hydrologic Cycle and Water Reservoirs 2. Floods and Flood Control 3. Use of Water 4. Water Composition 5. Water Problems

20
Surface Water/Floods/Flood Control Surface water is water that flows off the land in streams and rivers What is it dependent upon??

21
Amount of precipitation Slope and Length of drainage basin Rock and soil type of drainage basin Vegetation Extent of impermeable areas

22
Red River Discharge Hydrograph

23
When does flooding occur? When surface run-of exceeds a normal stream channels capacity and water spreads out onto the flood plain Is this a problem?

24
What do we do to minimize flooding? 1. build dams 2. build levees 3. create channels (channelization) 4. Moveable damsThames
 4. Moveable damsThames.")
25
Dams: pro 1. Do help with flood control 2. Supply electricity 3. Provide recreation 4. Sources of water for irrigation 5. Increases groundwater Does anyone see some inconsistency here?

26
Dams: con 1. Sediment catchment 2. Increased evaporation 3. Loss of land 4. Interruption of river transport and fish migration 5. Environmental alteration

27
Some Dams Aswan High Dam

28
Glen Canyon Dam

29
Hoover Dam

30
Three Gorges Dam http://svs.gsfc.nasa.gov/vis/a000000/a003400/a003433/#topm http://svs.gsfc.nasa.gov/vis/a000000/a003400/a003433/#topm

32
Levees

33
Channelization Replacement of a meandering stream by a deeper, straighter channel

34
Drawbacks Transfer of flooding Flood plain doesnt get new sediment

35
Kissimmee river in Florida

36
Drawbacks of Channelization Increased erosion Transfer of flooding downstream Reduced natural filtering of water and drainage basin Loss of wetlands Reduction in available water for general use Less evapotranspiration Less infiltration Lower ground water levels Larger variations in flow rates Reduction in wildlife

Similar presentations


 Of the 3% of freshwater that remains 2/3 of it is frozen in the ice caps.>")


 Vadlani Ronak Patel Shivanshu Patel Parth Thaker Rajvi Leuva Nisarg Patel Rudra ALPHA COLLEGE.>")
