Download presentation
Presentation is loading. Please wait.

1
Hedonic Modeling Mats Wilhelmsson Center for Banking and Finance (Cefin)
")
2
Lecture Tuesday 15/2 – Wilhelmsson, Mats (2008). House Price Depreciation Rates and Level of Maintenance. Journal of Housing Economics. Vol.17(1), 88-101. – Kryvobokow, Mark and Wilhelmsson, Mats (2007). Analyzing location attributes with hedonic model for apartment prices in Donetsk, Ukraine. International Journal of Strategic Property Management, Vol.11, 157-178. – Song, Han-Suck and Wilhelmsson, Mats (2010). Improved price index for condominums.
, – Kryvobokow, Mark and Wilhelmsson, Mats (2007). Analyzing location attributes with hedonic model for apartment prices in Donetsk, Ukraine. International Journal of Strategic Property Management, Vol.11, – Song, Han-Suck and Wilhelmsson, Mats (2010). Improved price index for condominums..")
3
3 Price Variation in Space Why do housing prices vary in space? – That is to say, what can explain the price variation when we are using cross-sectional data? Attributes – Property specific Size, quality, age – Neighborhood specific Positive and negative externalities Segmented market The relationship between housing price and housing attributes is estimated with the so-called hedonic regression

4
4 The Hedonic Regression Relating price to attributes of the goods Housing, cars, electronics, wine…. The hedonic regression is based on the hedonic value model where the property value is a function of property attributes. Hedonic regression controls for differences across individual properties by modeling the value effects of those differences. That is, we estimate an implicit (hedonic) price of the attribute – Haas (1922), Court (1937) and Rosen (1974) FirstHedonicTheory
 price of the attribute – Haas (1922), Court (1937) and Rosen (1974) FirstHedonicTheory.")
5
5 The Hedonic Price Equation Attributes (Z) – Property specific attributes (F) Apartment specific attributes – Neighborhood specific attributes (O) – Time specific attributes (T)
 – Property specific attributes (F) Apartment specific attributes – Neighborhood specific attributes (O) – Time specific attributes (T)")
6
6 The Hedonic Methodology Estimated parameters in the hedonic regression is equal to the marginal willingness to pay, that is, the hedonic price is equal to how much the individual is willing to give up of other goods to get attribute z.

7
7 The Hedonic Methodology The first stage: Estimation of P(Z) The second stage: Estimation of: – Price elasticity – Income elasticity z PzPz ? ?

8
8 When it is used? Valuation/appraisal Estimation of willingness to pay (WTP) –Neighborhood specific attributes Golf courses, Power lines, Sea view, city plans Proximity to roads, airports etc etc –Property specific attributes Quality, depreciation, size Time specific attributes Index construction
 –Neighborhood specific attributes Golf courses, Power lines, Sea view, city plans Proximity to roads, airports etc etc –Property specific attributes Quality, depreciation, size Time specific attributes Index construction.")
9
Article 1: House Price Depreciation Rates and Level of Maintenance 1.Introduction – The introduction states the basic objectives of the study and explains why it is important. 2.Literature review – All papers, even if they are relatively short, should contain a review of relevant literature. 3.Theoretical model and Method – In this section, you describe the general approach to answering the question you have posed. 4.Descriptive statistics – You should always have a section carefully describes the data used. 5.Econometric analysis – The results section should include your estimates of any models formulated in the models section. 6.Summarize and conclusion – This could be a short section that summarizes what you have learned.

10
Introduction Depreciation may bias the estimation of CPI, appraisals, tax assessment Why does a property depreciate over time? – Physical deterioration – Functional obsolescence Technological changes – External obsolescence Changes in neighborhood My main objective is to estimate different house price depreciation rates depending on the level of maintenance. – Keeping physical deterioration constant

11
Literature Review Malpezzi et al (1987) - literature review, estimate deprecation rates and how it differs across markets (0.9% to 0.3%). Shilling et al (1991) - tenure status, lower depreciation rates in owner- occupied properties Rubin (1993) - why negative age effect – taste for newer houses Goodman and Thibodeau (1995) - age induced heteroskedasticity – depreciation is non-linear, important to include the age effect as a second- order effect Knight and Sirmans (1996) – maintenance, similar to my study. (0.9% to 1.9% depending on maintenance) Clapp and Giaccotto (1998) - over time, across space Knight et al (2000) – No effect. My argument is that their assumptions are unrealistic. Smith (2004) - across sub-markets (0,5%-7% depending on area)
 - tenure status, lower depreciation rates in owner- occupied properties Rubin (1993) - why negative age effect – taste for newer houses Goodman and Thibodeau (1995) - age induced heteroskedasticity – depreciation is non-linear, important to include the age effect as a second- order effect Knight and Sirmans (1996) – maintenance, similar to my study. (0.9% to 1.9% depending on maintenance) Clapp and Giaccotto (1998) - over time, across space Knight et al (2000) – No effect. My argument is that their assumptions are unrealistic. Smith (2004) - across sub-markets (0,5%-7% depending on area).")
12
Method Hedonic Spatial Econometrics (I will come to that) Specification: Implicit price:
 Specification: Implicit price:")
13
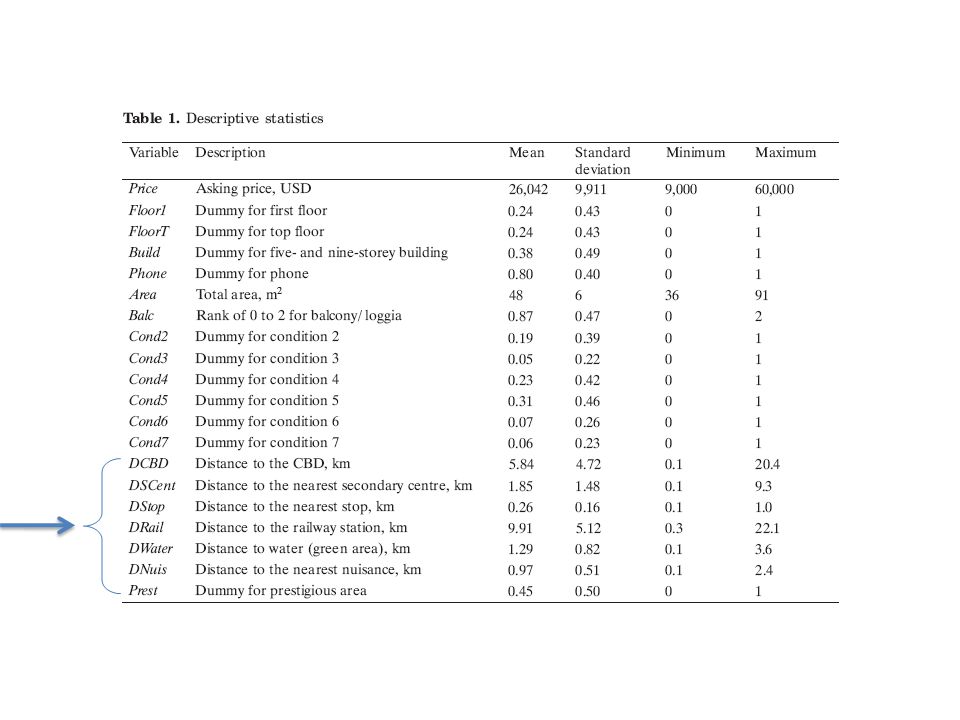
Data - Descriptive Analysis

14
Properties in need of maintenance(%)
")
15
Property age and location from CBD

16
Econometric Analysis

17
Depreciation effect

18
Regression results

19
Conclusions The main contribution in this paper is that the analysis relates depreciation rates to the level of maintenance. The results show that the depreciation rates are significantly lower for a maintained property compared to a non- maintained property. The depreciation rate is estimated to be 0.77 percent per year for a well-maintained property and 1.10 percent for a property that is not renovated in- or outdoors year 1. In year 20 the annually depreciation rate is estimated to be 0.42 percent respectively 0.84 percent.

20
Article 2: Analyzing location attributes with hedonic model for apartment prices in Donetsk, Ukraine Hedonic Apartments Values (instead of prices) Sub-centers – Monocentric vs. polycentric Positive and negative externalities Price gradient – different in different directions

24
Household Consumption Pattern of Housing Attributes First stage: House prices as a function of housing attributes hedonic prices Second stage: hedonic prices as a function of quantity, income and other socioeconomic characteristics. However, problem with the second stage – Simultaneous decision – hedonic price and quantity – Two ways estimating it Assume utility function Multiple markets

Similar presentations


 Alain de Serres* OECD Florian Pelgrin * Bank of Canada * Personal views, not.>")


 GDP vs GPI discussion The Other Major Macroeconomic Variables (Unemployment and.>")


