Download presentation
Presentation is loading. Please wait.

1
Arthur C. Nelson, Ph.D., FAICP, Metropolitan Research Center, University of Utah with support from National Center for Transportation & Communities Reno, NV December 6, 2013

2
Residential values with respect to light rail station distance TRAX case study Job and population change with respect to street car distance Portland streetcar case study Bus Rapid Transit and employment growth Land County, Oregon Case Study Forthcoming BRT research

3
Source : Nelson et al., Metropolitan Research Center, University of Utah. NAICS CodeNAICS Sector Jobs Within 0.25 Mile of EmX Station, 2004 Jobs Within 0.25 Mile of EmX Station, 2010 Change in Jobs, 2004-2010 Jobs Between 0.25 and 0.50 Mile of EmX Station, 2004 Jobs Between 0.25 and 0.50 Mile of EmX Station, 2010 Change in Jobs, 2004-2010 Jobs Balance of Metro Area, 2004 Jobs Balance of Metro Area, 2010 Change in Jobs, 2004-2010 22Utilities4755138%9113649%15118321% 23Construction643520-19%400314-22%5,6964,696-18% 31-33Manufacturing813465-43%293174-41%18,69011,685-37% 42Wholesale427269-37%584499-15%5,3134,742-11% 44-45Retail1,7691,8444%1,0391,0733%14,55114,021-4% 48-49Transportation4845177%52135160%2,6082,260-13% 51Information1,1331,55737%450389-14%1,5501,360-12% 52Finance1,2851,44713%42252424%2,1051,766-16% 53Real Estate44248810%1771823%1,9471,516-22% 54Professional2,3662,221-6%861811-6%2,7512,597-6% 55Management291633118%9875-23%1,6311,7336% 56Administrative1,3202,04255%1,5141,031-32%5,4564,441-19% 61Education1,0151,24923%25830317%13,98315,80013% 62Health Care7,7519,09517%9201,39552%9,36312,10229% 71Arts, Ent., Rec.826707-14%4399130%1,4211,5267% 72Lodging, Food2,6152,91912%1,1131,099-1%7,4458,34112% 81Other Services62171715%2692949%4,0093,926-2% 92Public Admin3,4613,379-2%48855213%1,3612,08453% Total27,73730,58210%9,0729,0850%100,03194,779-5%

4
BRT outcomes so soon are a surprise (for me). Success attributable to “planning for success” by locating stations at current/planned high-demand locations. It is one design among many flavors will results hold up under different designs? Will lagging sectors rebound at BR stations? Will results hold for ½ mile rail-transit areas? Are there any induced jobs or just resorting? Will people also follow BRT or is it just jobs? More research needed but outcomes appear promising.

5
Arthur C. Nelson et al. (2013), Bus Rapid Transit and Economic Development: Case Study of the Eugene-Springfield BRT System. Journal of Public Transportation, Vol. 16, No. 3: 41-57
, Bus Rapid Transit and Economic Development: Case Study of the Eugene-Springfield BRT System. Journal of Public Transportation, Vol. 16, No. 3:")
9
To be presented to Transportation Research Board, 2014 Arthur C. Nelson et al. targeted for Journal of Public Transportation.

10
In theory higher density housing should be more valuable the closer it is to transit stations. Only one study evaluates price differences per square foot in apartment values within ½ mile of heavy-rail stations compared to farther away. No study evaluates the value gradient with respect to transit station distance.

11
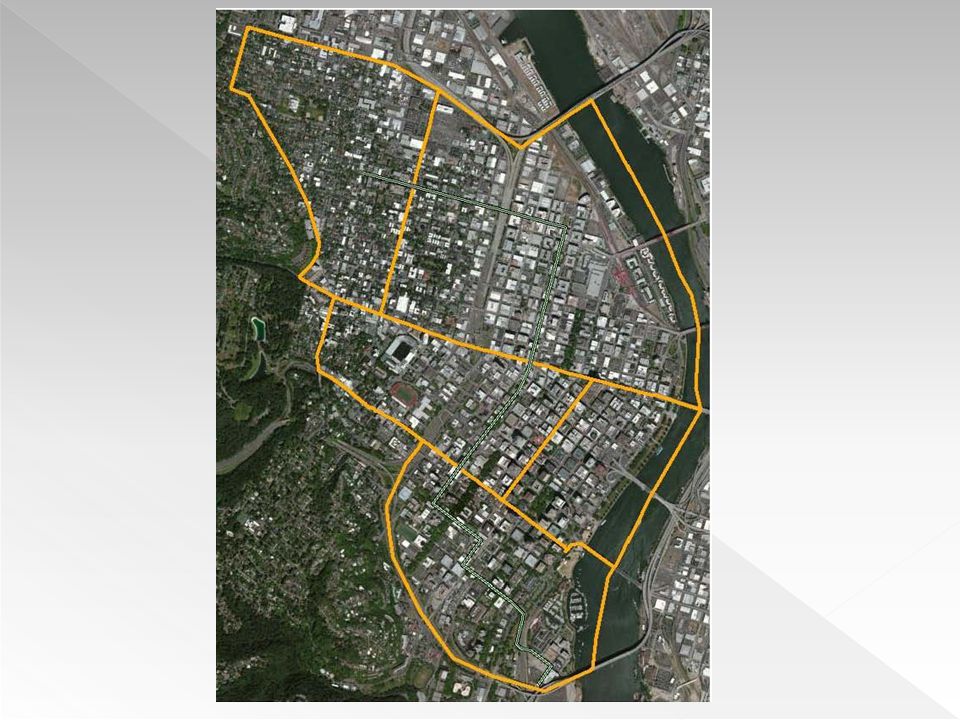
17 municipalities; 6 unincorporated communities Population: 1.03 million (2010 Census) 4 Light Rail Lines 41 Stations 35 miles of track Image: saltlakebusads.com
 4 Light Rail Lines 41 Stations 35 miles of track Image: saltlakebusads.com")
12
Structural Characteristics Bldg. Area Units Property Tax Rate Location Attributes CBD Freeway Exit Schools Shopping Neighborhood Attributes Income Household Size Race/Ethnicity Distance to TRAX Nearest station in ¼ mile bands to 1-1/2 mile Value per square foot of Rental Space

13
Mean value: $87/ft 2 7.276* Up to ¼ mile 3.628* ¼ to ½ mile 4.739* ½ to ¾ mile 3.621* ¾ to 1 mile 3.647* 1 to 1¼ mile 1.678 1¼ to 1½ mile reference Over 1½ mile *Significant p-value

14
Presented to Transportation Research Board, 2013. Susan J. Petheram, Arthur C. Nelson, et al. (2013). Using the Real Estate Market to Establish Light Rail Station Catchment Areas: Case Study of Attached Residential Property Values in Salt Lake County with respect to Light Rail Station Distance. Transportation Research Record
. Using the Real Estate Market to Establish Light Rail Station Catchment Areas: Case Study of Attached Residential Property Values in Salt Lake County with respect to Light Rail Station Distance. Transportation Research Record.")
16
LINEAR MODELAttached SF BSig. within.25 mile of LR20.628880.000.25 to.5 mile to LR12.807350.001.5 to.75 mile to LR7.714340.001.75 to 1 mile to LR9.860590.000 1 to 1.25 mile to LR1.086880.590 Model R Squared:0.563

17
To be presented to Transportation Research Board, 2014 Susan J. Petheram, Arthur C. Nelson, et al., targeted to Transportation Research A.

18
Ranked #1 for funding by NITC National study of all 19 BRT systems in place in 2011. Quasi-experimental compare-and-contrast research design to compare jobs, population and households, and housing units before and after BRT implementation relative to a control corridor and within the metropolitan context. Spatial regression analysis to evaluate the relationship between BRT and employment controlling for socioeconomic, location and other factors. Hedonic analysis to compare market differences in terms of nonresidential and apartment residential rents and vacancy rates with respect to BRT station proximity, and whether there are variations with respect to BRT flavor. Jobs-housing balance analysis will tie together the residential and non-residential analyses. 2010 census blocks within one-eighth mile buffers, out to two miles. Census, Longitudinal Employer-Household Dynamics, CoStar data

Similar presentations


>")


 2004 - 2009 ImprovingLeading LaggingSlipping Source: Oklahoma.>")


:>")

