Download presentation
Presentation is loading. Please wait.

1
Market Potential, MAUP, NUTS and other spatial mysteries Fernando Bruna Jesus Lopez-Rodriguez Andres Faina 11th International Workshop Spatial Econometrics and Statistics 15-16 November 2012 Avignon – France

2
Motivation

3
ECONOMIC REASONS The relative power of the various economic agglomerating and spreading forces are not scale-neutral but heterogeneous. Different economic forces (theories) are active at different spatial scales => Analyses at different scales provide different insights: the MAUP is only a problem when it is not recognized (ESPON, 2006). STATISTICAL REASONS – The two sides of MAUP: Scale effect (ecological fallacy): for a given space, results can depend on the number of units representing it. Zoning (or aggregation ) effect: for a given scale, results can depend on how the study area is divided up. Motivation: reasons for the MAUP
 are active at different spatial scales => Analyses at different scales provide different insights: the MAUP is only a problem when it is not recognized (ESPON, 2006). STATISTICAL REASONS – The two sides of MAUP: Scale effect (ecological fallacy): for a given space, results can depend on the number of units representing it. Zoning (or aggregation ) effect: for a given scale, results can depend on how the study area is divided up. Motivation: reasons for the MAUP.")
4
Is a general form of the wage equation robust to different aggregation levels of European data and different non spatial econometric specifications?: –Long-term relationships: cross-section (variables in levels) –Short-term relationships: Panel data with fixed effects (growth rates) Is the MAUP affecting the estimation of these relationships with spatial econometric models? –SEM and SAR How does the sample selection affect the results? –Broad sample: 25 countries (260 NUTS 2 regions) –Restricted sample: 15 countries (206 NUTS 2 regions) Software – R packages: "spdep" (Bivand 2012); "plm" (Croissant and Millo, 2008) and "splm" (Millo and Piras, 2012). Amelia II (Honaker et al., 2011). Motivation: empirical questions
 –Restricted sample: 15 countries (206 NUTS 2 regions) Software – R packages: spdep (Bivand 2012); plm (Croissant and Millo, 2008) and splm (Millo and Piras, 2012). Amelia II (Honaker et al., 2011). Motivation: empirical questions.")
5
New Economic Geography: The wage equation

6
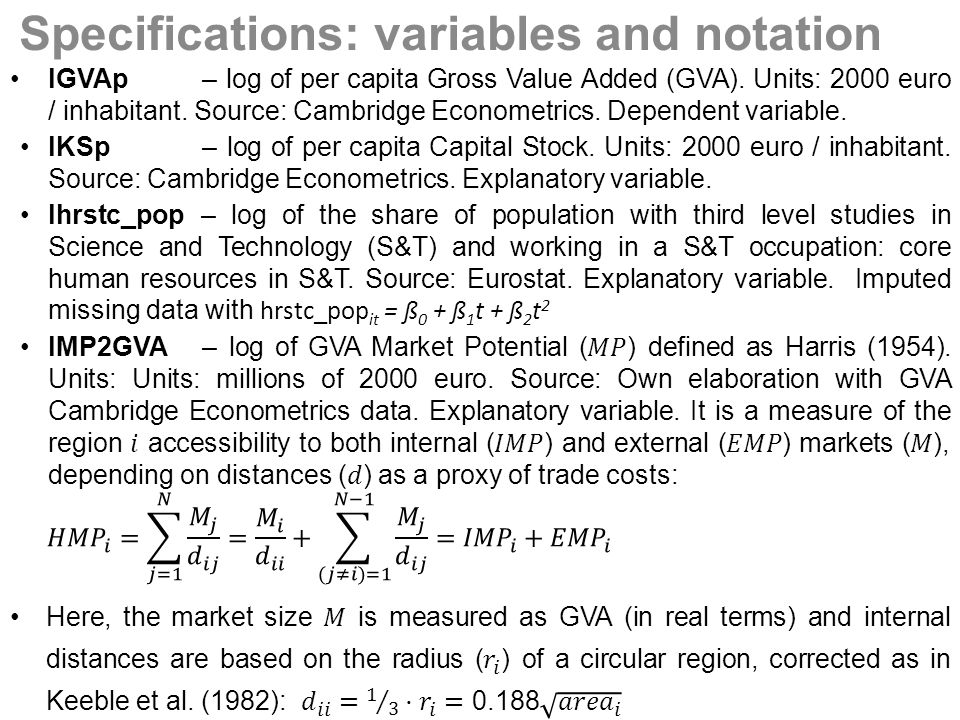
Specifications: variables and notation

8
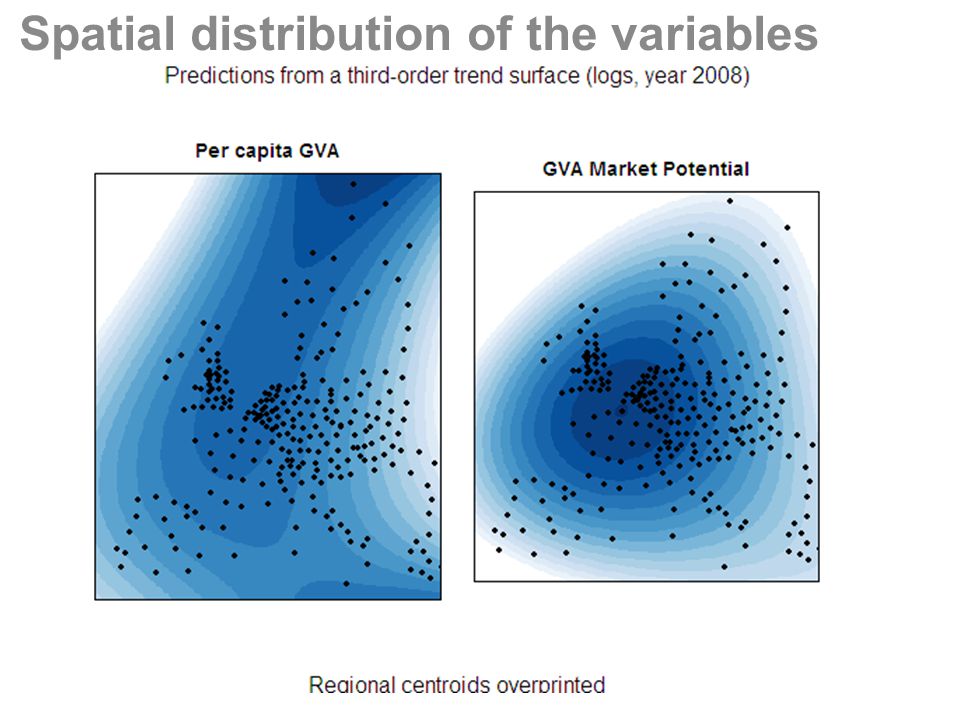
Spatial distribution of the variables

11
Market Potential (lagged one year) is meaningful but its presence does not alter dramatically the results. Residuals are spatially autocorrelated for NUTS 1 and 2: a positive spatial autocorrelation tends to increase with the disaggregation level Pooled estimations 1996-2008 with time dummies: broad sample OLS

12
And the winner is… the SEM model! => OLS estimates are not efficient Particular cases: Contradiction Morans I-LM tests for NUTS 0 in the restricted sample Both robuts tests are highly significant in some cases: thought the decision rule choses the SEM, caution with misspecification. Lagrange Multiplier tests for spatial dependence In the pooled OLS estimations with time dummies and lagged Market Potential Broad sampleRestricted sample

13
SEM: one year cross-section (1) and pooling with time effects (2) Broad sample Broad sample Restricted sample ML estimation
 and pooling with time effects (2) Broad sample Broad sample Restricted sample ML estimation")
14
SAR: one year cross-section (1) and pooling with time effects (2) Broad sample Restricted sample Broad sample ML estimation
 and pooling with time effects (2) Broad sample Restricted sample Broad sample ML estimation")
15
Pooled (1) and fixed effects (2) estimations with time effects Broad sample Restricted sample Broad sample OLS
 and fixed effects (2) estimations with time effects Broad sample Restricted sample Broad sample OLS")
16
SEM: Pooled (1) and fixed effects (2) estimations with time effect Broad sample Restricted sample Broad sample ML
 and fixed effects (2) estimations with time effect Broad sample Restricted sample Broad sample ML")
17
Broad sample Restricted sample Broad sample SAR: Pooled (1) and fixed effects (2) estimations with time effect ML
 and fixed effects (2) estimations with time effect ML")
18
With the exception of the fixed effects estimation in the restricted sample,, residuals are autocorrelated and their autocorrelation and estimated spatial parameters increase with disaggregation. The general wage equation is very robust to the short-and-long-run specifications, to this three NUTS levels and to the broad and the restricted sample. Many test of the wage equation in the literature do not distinguish the short-and-long-run specifications. But the estimation with individual effects give a whole different view (Acemoglu et al., 2008). Preliminary conclusions
. Preliminary conclusions.")
19
Results from NUTS 1 and 2: the estimated elasticities are very robust for the non spatial and the SEM and SAR models (FE non checked) => No problem with MAUP (but we have not studied NUTS 3!). Results from NUTS 0 are more sensitive to sample selection. Maybe higher heterogeneity than when pooling regions from different countries at NUTS 1-3. Some of the detected patterns in the change of estimates by NUT level are economically meaningful: at least from NUTS 1 to NUTS 2 the elasticity to Market Potential always increases => More severe problems if this variable is omitted at higher levels of disaggregation. Preliminary conclusions

20
Sensitivity analysis (at least in the pooled model): –Kelejian and Pruchas (1998) instrumentation of the spatially lagged dependent variable in the SAR model –spatial heteroskedasticity and autocorrelation consistent (HAC) estimators –A graphical W instead of a matrix of the 5 nearest neighbours - but LeSage and Pace (2012)!- – Now annual data: Short-run models for several years panels GWR ( conditional parametric approach) – local variation of estimates: At each NUTS level, what countries are de drivers of the fixed estimates? The zoning effect internal to each MAUP – The areas by country at each NUTS level: Does size matters? –Weighted regression –Recalculate Market Potential: with distances among centroids, bigger regions are further apart from their markets Current research and possible extensions

21
Results change more using NUTS 0: thoughts welcomed. Similar elasticities in the not spatial and in the SEM and SAR models in spite of being a simple equation. Thoughts: Is this because the SAR was not recommended by the LM tests?. So much effort with spatial models for this?.... Endogeneity – Proper instruments for Market Potential. Endogeneity – In the SAR model both market potential and the endogenous spatial lag of the dependent variable are endogenous: How to deal with this? Which would be the best W matrix to compare models using data with different aggregation? Results of the pooled estimation different when using spdep or splm R packages: why? Questions

22
COMMENTS WELCOMED THANK YOU Fernando Bruna f.bruna@udc.es)f.bruna@udc.es University of A Coruña, Spain

Similar presentations


>")


 Fred Joutz (George Washington University) September.>")


 Asli Demirgüç-Kunt (World Bank) Harry.>")


