Download presentation
Presentation is loading. Please wait.

1
News From The New Numbers Ten Trends For 2020 October 4, 2011 Washington, DC Brad Edmondson www.bradedmondson.com

2
April 1, 2010: 308, 745, 538 Now 312.3 million, adding 7,200 a day 27 million more than 2000 (<1% a year) 75 million children (<18) 115 million young adults (18-44) 78 million baby boomers (45-64) 40 million older adults (65+) 53% of growth in TX, CA, FL, GA, NC, & AZ
 75 million children (<18) 115 million young adults (18-44) 78 million baby boomers (45-64) 40 million older adults (65+) 53% of growth in TX, CA, FL, GA, NC, & AZ")
3
The Cultural Pie, 2010

4
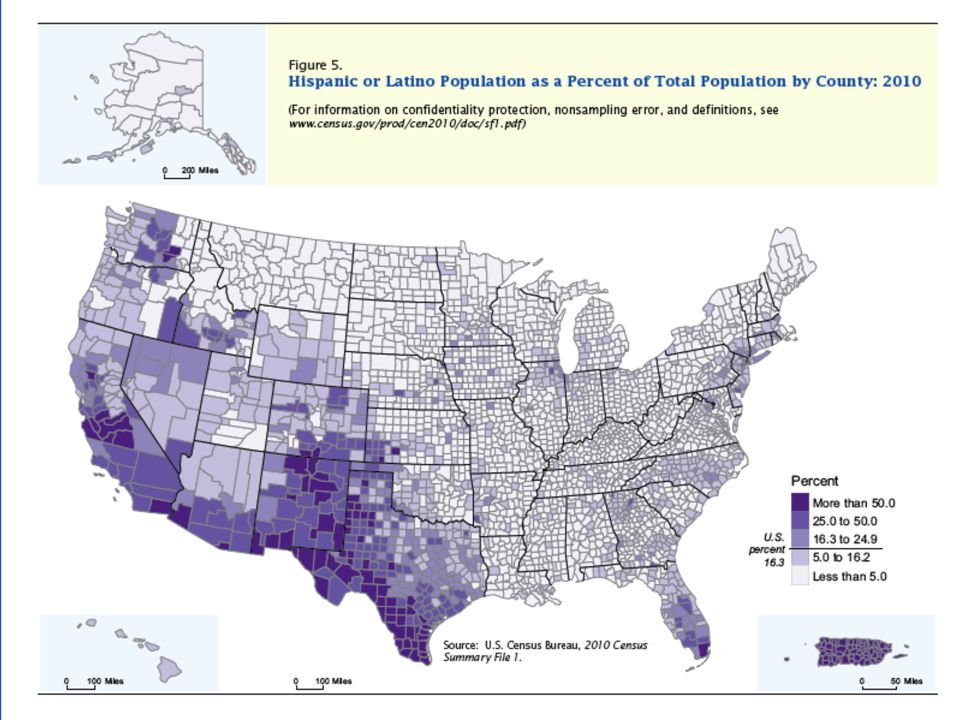
1. Growth equals Hispanics

7
2. The rise of Latino citizens The next America Mexican immigration, 2000-2010: 4.2 million Mexican American births: 7.2 million How to become white

8
3. Multiracial affluence

9
How ethnic foods go mainstream (Lars Perner, University of Southern California)
")
10
4. Hard times for the young Percent change in median household income by age of householder, adjusted for inflation, 1990-2010

11
5. Getting serious about saving Young people are: --Abandoning marriage --Driving less --Doing it themselves --Eating less meat --Supercouponing

12
6. Childhood is changing Percent of US children whose families are Nonwhite or Hispanic: 43% Unmarried households: 31% Getting by or better: 54% Able to save for college: 36%

13
Why boomers still rule US birth rate, 1909-2004. Source: NCHS Division of Vital Statistics

14
Boom, bust, and boomlet US population by single year of age, 2011: 0-18 gray (unnamed), 19-32 green (Millennial), 33-45 yellow (baby bust), 46-65 red (baby boom), 66-80 blue (swing), 81-plus rose (WWII)
, green (Millennial), yellow (baby bust), red (baby boom), blue (swing), 81-plus rose (WWII)")
15
7. An aging population Projected percent change in population by age groups, 2010-2020 Source: Census Bureau

16
The Good Years Median household income by age of householder, 2010

17
8. Boomers are buckling down Percent change in median household income by age of householder, 2000-2010

18
And the winners are… Median adjusted household income by sex and marital status, 1970-2007

19
9. What AARP wont tell you Retirement is not a nice word Boomers are working longer Those who can retire dont want to Convenience food for 60+ workers

20
10. Still the golden years Percent change in median household income by age of householder, 2000-2010

21
Still spending: aged 65 to 74 Index of spending on selected products for householders aged 65 to 74, 2009 Drugs (178%) Medical supplies (152%) Personal care (101%) Reading (140%) & stationery (118%) Housewares (130%) Housekeeping supplies (117%) Beef (109%) & seafood (113%) Pets, toys, & hobbies (112%) Fresh produce (104%)
 Medical supplies (152%) Personal care (101%) Reading (140%) & stationery (118%) Housewares (130%) Housekeeping supplies (117%) Beef (109%) & seafood (113%) Pets, toys, & hobbies (112%) Fresh produce (104%)")
22
Still spending: 75 & older Index of spending on selected products for householders aged 75+, 2009 Drugs (162%) Medical supplies (133%) Personal care (77%) Reading (122%) & stationery (116%) Housekeeping supplies (89%) Fruits and vegetables (83%) Cereal and bakery (82%)
 Medical supplies (133%) Personal care (77%) Reading (122%) & stationery (116%) Housekeeping supplies (89%) Fruits and vegetables (83%) Cereal and bakery (82%)")
23
Uncharted Territory Projected population aged 75 and older, 2010-2050, in millions

24
Wisdom from elderly pioneers Kitchen workarounds High tech memory aids Low-tech bionic aids Social media

25
Summary: youth Hispanics & Asians are driving growth Hispanic births outnumber immigration Multicultural affluence & influence Young adults are much poorer Serious savings strategies Most parents are pinched

26
Summary: Boomers & beyond Rapid growth in store among 65+ Boomers free spending days are over The new royalty: dual-earner professionals Boomers will retire much later 65+ householders have escaped the recession 75+ householders are a brand new market

27
Thank you! Brad Edmondson www.bradedmondson.com brade@lightlink.com

28
Summary

Similar presentations