Download presentation
Presentation is loading. Please wait.

1
Absorptive Capacity and Regional Patterns of Innovation Maria Abreu, Vadim Grinevich, Michael Kitson and Maria Savona

2
Presentation Structure Regional Growth in the UK The CBR Survey: A Meta-Regional Picture The CBR Survey: The Innovation Picture The Absorptive Capacity Concept Innovation and Absorptive Capacity: Multivariate Analysis Innovation and Absorptive Capacity: Open v Closed innovation The Case Study Evidence Implications

3
Regional Productivity Disparities: The Scale of the Problem Since the mid-1980s, major productivity gap has opened up between London and South East on one hand, and rest of UK on the other Only three regions have productivity above UK average (London, South East and Eastern) Productivity growth in the Northern regions has been especially slower The productivity gap is such that output per employee in South East now more than 28 percent above that in Northern Ireland, and 20 percent above that in North East
 Productivity growth in the Northern regions has been especially slower The productivity gap is such that output per employee in South East now more than 28 percent above that in Northern Ireland, and 20 percent above that in North East")
7
Regional Productivity Disparities: The Scale of the Problem Employment growth has also been unequal across the regions Highest in South East, Northern Ireland, South West and Eastern region Some regions have not fully recovered from massive job declines of early-1980s (North East, North West and West Midlands) South East only region to experience above average growth in productivity and employment
 South East only region to experience above average growth in productivity and employment")
8
Drivers of Regional Competitiveness/Productivity According to HM Treasury/DTI

9
Are innovative regions, prosperous regions? Source: Martin (2005)
")
10
CBR Dataset Centre for Business Research (CBR) Survey 2004 1-499 employees Manufacturing and business services 2137 respondents More detailed information than in CIS although the CIS survey is larger CBR Survey also allows the opportunity to review and research respondents in greater depth
 Survey employees Manufacturing and business services 2137 respondents More detailed information than in CIS although the CIS survey is larger CBR Survey also allows the opportunity to review and research respondents in greater depth")
11
Regional Competitiveness For the purpose of this initial analysis, a meta- regional classification is used: –Greater South East (South East, Eastern Region and London) –Middle England (East Midlands, West Midlands and the South West) –The Northern Way (North West, North East and Yorkshire and Humberside) –Scotland/Wales
 –Middle England (East Midlands, West Midlands and the South West) –The Northern Way (North West, North East and Yorkshire and Humberside) –Scotland/Wales")
12
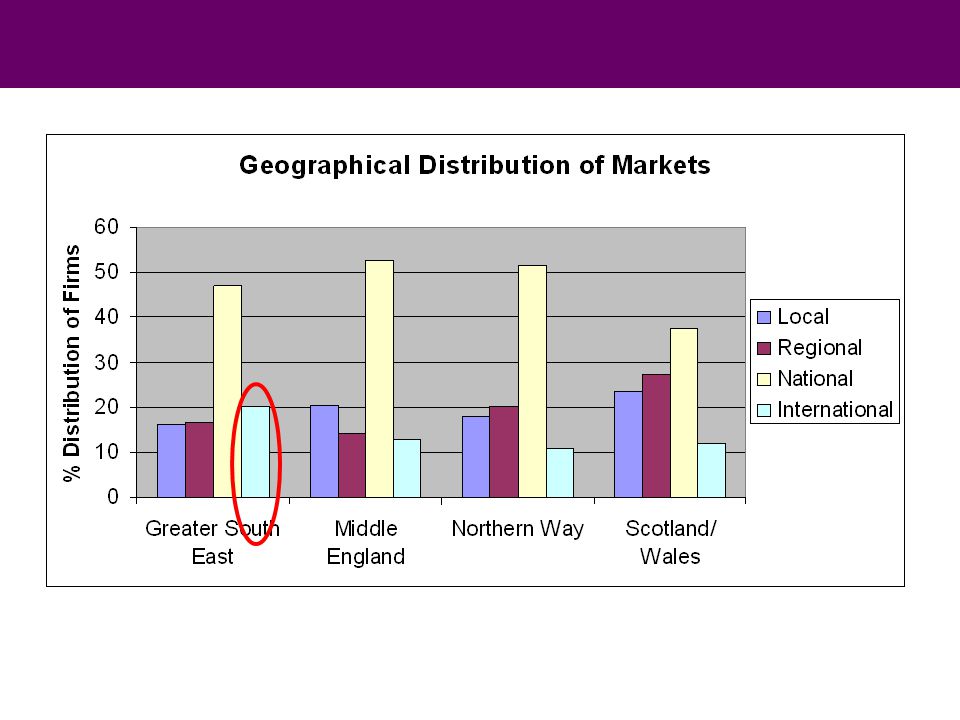
Markets and Competition The Greater South East engaged in the most international trade with over 20% of the businesses identifying overseas markets as being most important compared to only 12% of firms in Scotland/Wales There was a more intense competitive environment in the Greater South East with evidence of a core to periphery decline in the intensity of competition The Greater South East had the highest level of international competition – with 41% of firms facing some overseas competitors and with 10% of firms competing exclusively with overseas businesses

14
Number of Serious Competitors (% distribution of firms)
")
15
Extent of Overseas Competition (% distribution of firms)
")
16
Networks and Cooperation The use of networks and effective collaboration has been identified as an important factor in improving business and regional competitiveness The highest level of collaboration took place in the Greater South East (48% of businesses) and the lowest took place in the Northern Way (37% of businesses)
 and the lowest took place in the Northern Way (37% of businesses)")
18
The Geography of Networks and Cooperation There were significant regional variations in collaborative partners –illustrating that there are significant differences in the character of, and scope of, regional networks Firms in similar lines of businesses were the most important collaborative partners –but this group was more important for Scotland/Wales and the Greater South East compared to Middle England and the Northern Way Forward and backward linkages (collaboration with customers and suppliers) were more important for businesses in Middle England Collaboration with universities and research institutes was higher in the Northern Way compared to other regions
 were more important for businesses in Middle England Collaboration with universities and research institutes was higher in the Northern Way compared to other regions")
19
Policy Support The use of Business Link (and Business Gateway and Business Connect) was significantly greater in Middle England and the Northern Way than in the Greater South East and especially compared to the low use in Wales/Scotland The use of Local Learning and Skills Councils was higher in Middle England and the Northern Way compared to the other two regions The assistance from Development Agencies had a distinct core periphery incline – with the lowest use in the Greater South East and the highest (by far) in Scotland/Wales There was core periphery incline for export advice- with the highest level in Scotland/Wales
 was significantly greater in Middle England and the Northern Way than in the Greater South East and especially compared to the low use in Wales/Scotland The use of Local Learning and Skills Councils was higher in Middle England and the Northern Way compared to the other two regions The assistance from Development Agencies had a distinct core periphery incline – with the lowest use in the Greater South East and the highest (by far) in Scotland/Wales There was core periphery incline for export advice- with the highest level in Scotland/Wales")
20
Policy Support

21
Innovation Behaviour Approximately 60% of firms introduced product innovations Approximately half of firms had introduced process innovation The CBR data indicates a higher level of innovation than CIS –Different survey structures, CBR covers manufacturing and business services –Issue of weighting –Issue of questionnaire design

22
Innovation Performance Product and Process innovation –Positively associated with firm size –Positively associated with firm growth –Higher in high-technology sectors

23
Product innovation Source: Fu (2006)
")
24
Process innovation Source: Fu (2006)
")
25
RegionTotal Firms% Innovative Firms % Goods Innovation % Service Innovation % Process Innovation London29052.2224.1130.1133.95 Eastern25752.8727.8732.5243.32 South East34444.4426.4922.5928.50 South West18156.8831.0830.3542.40 West Midlands18550.7228.9219.8635.40 East Midlands13953.0926.4018.8241.45 Yorkshire17757.1629.0931.7747.82 North West20346.1725.9423.9026.56 North East5156.4336.1826.2721.28 Wales6846.2730.6726.8127.01 Scotland11156.9235.1138.8734.01 Total200652.1129.3127.4434.67 Innovation Statistics by Region, CBR SME Survey 2004

26
Absorptive Capacity: …the ability of a firm to recognize the value of new, external information, assimilate it, and apply it to commercial ends is critical to its innovative capabilities. (Cohen and Levinthal, 1990) What are the main determinants of absorptive capacity? Can regional variations in absorptive capacity explain regional differences in innovation? Can we draw implications for regional and national innovation policies? Research Questions
 What are the main determinants of absorptive capacity. Can regional variations in absorptive capacity explain regional differences in innovation. Can we draw implications for regional and national innovation policies. Research Questions.")
27
Absorptive Capacity Originally developed in the cognitive sciences (Bower and Hilgard, 1981; Lindsay and Norman, 1977) Extended by Cohen and Levinthal (1989, 1990) to the firm level: –Firm-level absorptive capacity is more that the sum of the absorptive capacities of individual workers. –Better internal communication processes improve the firms ability to absorb external knowledge. –Networks are necessary to identify sources of relevant external knowledge.

28
Used at the national level to denote the conditions necessary for a technological catch-up to begin (Nelson and Phelps, 1966; Verspagen, 1991; Keller, 1996; Criscuolo and Narula, 2002) Extension to the regional level: –Regional absorptive capacity is more than the sum of the absorptive capacities of individual firms. –Role of local labour markets (Roper and Love, 2006) –Regional networks allow firms to identify potential sources of knowledge. –Regional development policies promote firms investment in absorptive capacity. Absorptive Capacity
 –Regional networks allow firms to identify potential sources of knowledge. –Regional development policies promote firms investment in absorptive capacity. Absorptive Capacity.")
29
Methodology Empirical analysis of the effect of absorptive capacity on: –The probability of introducing a product, service and process innovation. –The probability of developing an innovation within the firm, in collaboration with other firms or institutions, or by adoption from other firms or institutions. Multivariate Probit model to improve efficiency and exploit all available information (Greene, 2003, pp. 174- 175).
..")
30
Data Issues Absorptive capacity variables: Percentage of R&D employees New management techniques Employee training Connectivity variables Collaborations with different spatial dimensions

31
Data Issues Control variables: Exporter Age, size and size squared Ownership structure Market Number of competitors Perceived obstacles to innovation R&D tax credit Sectoral and regional dummies

32
VariableManufactured Product Service Product Manufacturing Process Service Process R&D Employees 0.449** 0.529*0.009 0.687** Managerial Training -0.010 0.520***0.091 0.322** Scientist Training -0.056-0.2220.013 -0.289** Other Employee Training 0.341**-0.0780.000-0.027 Total Quality Management 0.154 0.268** 0.322*** 0.145 Quality Circles 0.289* 0.102 0.316** 0.161 Job Rotation 0.282** 0.020 0.400*** 0.123 Performance-Related Pay -0.033 0.080-0.061 0.027 Collaborations: Local 0.044 0.123 0.341** 0.213 Collaborations: National 0.209* 0.340***-0.052 0.287** Collaborations: Overseas 0.482***-0.033 0.269** 0.016 MV Probit Estimates, CBR SME Survey 2004

33
VariableManufactured Product Service Product Manufacturing Process Service Process Obstacles: Finance 0.171-0.022 0.1230.053 Obstacles: Skills-0.031 0.160 -0.058 0.337** Obstacles: Technology 0.269** 0.020 0.066 0.195* Obstacles: Market 0.086 0.089 0.029-0.195* Obstacles: Other -0.283**-0.058 -0.252*0.039 R&D Expenditure / Turn. 0.049 0.003 0.0600.014 Claimed Tax Credit 0.571***-0.028 0.199 -0.231* Business Advice: Bus. Link 0.069 0.081 0.287** 0.141 Business Advice: RDA-0.088 -0.332** -0.072 -0.265* MV Probit Estimates, CBR SME Survey 2004, cont.

34
VariableManufactured Product Service Product Manufacturing Process Service Process Market: Localreference Market: Regional0.230 0.147-0.141 0.082 Market: National0.268 0.152 0.105 0.172 Market: International 0.497** 0.100-0.003-0.030 Age (Years) -0.004**-0.001 0.001 Size: Employees (Ln)0.032 0.117** 0.110** 0.075 Ownership: Proprietorship reference Ownership: Partnership -0.646** -0.604** -1.028***-0.074 Ownership: Company-0.537*-0.165 -0.595**-0.091 Ownership: Other-4.368-0.373-5.166-4.602 Observations: 805 Log Likelihood -1598.04 MV Provit Estimates, CBR SME Survey 2004, cont.
 ** Size: Employees (Ln) ** 0.110** Ownership: Proprietorship reference Ownership: Partnership ** ** *** Ownership: Company-0.537* ** Ownership: Other Observations: 805 Log Likelihood MV Provit Estimates, CBR SME Survey 2004, cont.")
35
Absorptive Capacity: R&D Manufactured Product Service Product Manufacturing Process Service Process R&D Expenditure 0000 R&D Employees ++0+ Innovation Type

36
Absorptive Capacity: Training Manufactured Product Service Product Manufacturing Process Service Process Managerial Training 0+0+ Scientist Training 000-

37
Absorptive Capacity: Management Practices Manufactured Product Service Product Manufacturing Process Service Process Total Quaity Management 0++0 Quality Circles +0+0 Job Rotation +0+0

38
Connectivity: the Role of Collaboration Manufactured Product Service Product Manufacturing Process Service Process Local 00+0 National ++0+ Overseas +0+0

39
The Role of Markets Manufactured Product Service Product Manufacturing Process Service Process Regional 0000 National 0000 Overseas +000

40
The Impact of Policy Manufactured Product Service Product Manufacturing Process Service Process R&D Tax Credits +0+- Business Advice: Business Link 00+0 Business Advice: RDA 0-0-

41
Summary of the CBR results Absorptive capacity variables have a positive effect on innovation Management practices are particularly important for manufacturing product and process innovation. Local collaborations are only important for manufacturing process innovation National and overseas collaborations are generally more important than local collaborations Sectoral specificities are strong and significant. Regional dummies are not significant.

42
Regional Effects Regional impacts captured through variations in: –Industrial composition –Local labour market –Extent and reach of networks –Spatial variations in constraints

43
VariableInnovation (Product, Goods) Innovation (Product, Services) Innovation (Process, Goods and Services) S&E employees/Total 0.256*** 0.244*** 0.054 Other high skills empl/Total0.077 0.253*** -0.006 Training 0.370*** 0.522*** 0.626*** New Management Technique -0.097*** 0.093*** 0.191*** New Organisational Structure 0.124*** 0.200*** 0.146*** New Marketing Strategies 0.436*** 0.373*** 0.334*** Collaboration: Local0.033 0.259*** 0.173*** Collaboration: National 0.396*** 0.271*** 0.393*** Collaboration: Overseas 0.356*** 0.004 0.109* Obstacles: Finance 0.222*** 0.260*** 0.205*** Obstacles: Knowledge 0.076** 0.098*** 0.071** Obstacles: Market 0.147*** 0.067*** 0.004 Obstacles: Other -0.085***-0.008-0.043 MV Probit Estimates, Fourth Community Innovation Survey, 2004
 Innovation (Product, Services) Innovation (Process, Goods and Services) S&E employees/Total 0.256*** 0.244*** Other high skills empl/Total *** Training 0.370*** 0.522*** 0.626*** New Management Technique *** 0.093*** 0.191*** New Organisational Structure 0.124*** 0.200*** 0.146*** New Marketing Strategies 0.436*** 0.373*** 0.334*** Collaboration: Local *** 0.173*** Collaboration: National 0.396*** 0.271*** 0.393*** Collaboration: Overseas 0.356*** * Obstacles: Finance 0.222*** 0.260*** 0.205*** Obstacles: Knowledge 0.076** 0.098*** 0.071** Obstacles: Market 0.147*** 0.067*** Obstacles: Other *** MV Probit Estimates, Fourth Community Innovation Survey, 2004")
44
VariableInnovation (Product, Goods) Innovation (Product, Services) Innovation (Process, Goods and Services) R&D expenditure/Turnover 0.004 -0.030 0.012 Regional Public Support 0.083 0.140** 0.079 Government Public Support 0.313*** 0.140* 0.396*** EU Public Support -0.235*** 0.130 -0.099 Claimed R&D Tax Credit 0.497*** -0.117 -0.035 Market: Local reference Market: National 0.241*** 0.145*** 0.116*** Market: International 0.588*** 0.141*** 0.256*** Age0.001 -0.111***-0.008 Size: Employees (LN values) 0.025*** -0.017* 0.068*** Ownership Structure 0.065**0.049 0.042 Constant -2.445*** -1.359*** -1.774*** Observations: 13,237 Log Likelihood: -15753.06 MV Probit Estimates, Fourth Community Innovation Survey, 2004, cont.
 Innovation (Product, Services) Innovation (Process, Goods and Services) R&D expenditure/Turnover Regional Public Support ** Government Public Support 0.313*** 0.140* 0.396*** EU Public Support *** Claimed R&D Tax Credit 0.497*** Market: Local reference Market: National 0.241*** 0.145*** 0.116*** Market: International 0.588*** 0.141*** 0.256*** Age *** Size: Employees (LN values) 0.025*** * 0.068*** Ownership Structure 0.065** Constant *** *** *** Observations: 13,237 Log Likelihood: MV Probit Estimates, Fourth Community Innovation Survey, 2004, cont.")
45
CIS and CBR Analysis of CIS confirms: –Importance of science and engineering employees –No effect of level of R&D expenditure –Importance of training (but CIS does not disaggregate by type) –Importance of new management techniques (for services and process innovation) –Importance of national and international collaborations –Role of tax credits for manufacturing
 –Importance of new management techniques (for services and process innovation) –Importance of national and international collaborations –Role of tax credits for manufacturing")
46
CIS and CBR Additionally analysis of CIS suggests: –A stronger impact of supplying national and international markets –Regional policy support positive for service product innovation –Government support positive for manufactured product innovation and process innovation –EU support negative for manufactured product innovation

47
Innovation strategies and absorptive capacity Closed Innovation - firms rely on internal resources and the controlled environment of the corporate laboratory. Open Innovation - a process where firms use both internal and external sources of ideas and deploy multiple business models to improve corporate performance Adoptive Innovation - utilise innovations developed elsewhere

48
VariableInnovation developed internally Innovation developed in collaboration Innovation adopted externally S&E employees/Total 0.488*** -0.222**-0.098 Other high skills empl/Total 0.050 0.163*-0.045 Training 0.473*** 0.419*** 0.319*** New Management Technique -0.011 0.097** 0.023 New Organisational Structure 0.168*** 0.044 -0.130*** New Marketing Strategies 0.421*** 0.135*** 0.099** Collaboration: Local 0.101** 0.200***-0.052 Collaboration: National 0.125** 0.524*** 0.278*** Collaboration: Overseas 0.045 0.071-0.147* Obstacles: Finance 0.206*** 0.151*** Obstacles: Knowledge 0.102*** 0.001 0.086** Obstacles: Market 0.061** 0.040 0.109** Obstacles: Other-0.066-0.041-0.105** MV Probit Estimates, Fourth Community Innovation Survey, 2004

49
VariableInnovation developed internally Innovation developed in collaboration Innovation adopted externally R&D expenditure/Turnover 0.056*-0.019-0.603 Local and Regional Public Support 0.122** 0.127 Central Government Public Support 0.192*** 0.238***-0.118 EU Public Support -0.202*** 0.087-0.037 Claimed R&D Tax Credit 0.392***-0.154-0.050 Market: Local Reference Market: National 0.144*** 0.067 0.099 Market: International 0.429*** 0.161*** 0.047 Age -0.050-0.044 0.167*** Size: Employees (LN values) 0.036*** 0.032***-0.015 Ownership Structure 0.052* 0.116***-0.031 Constant -1.465*** -2.093*** -2.149*** Observations: 13,277 Log Likelihood: -12845.12 MV Probit Estimates, Fourth Community Innovation Survey, 2004, cont.
 0.036*** 0.032*** Ownership Structure 0.052* 0.116*** Constant *** *** *** Observations: 13,277 Log Likelihood: MV Probit Estimates, Fourth Community Innovation Survey, 2004, cont.")
50
Open, Closed and Adoptive Innovation R&D employees only important for closed innovation New Management Techniques significant for open innovators Local and national collaborations significant for both open and closed innovators – but the effect is larger for national collaborations –and the effect is larger for open innovators Importance of serving international markets

51
Case Study: Rationale To understand the dynamics and interrelationships of absorptive capacity variables To provide greater understanding of causal processes To explore the role of place, institutions and policies

52
Case Studies: Innovation Matrix

53
Case Studies: Characteristics

54
Case Studies: Innovation Behaviour

55
Case Studies: Quadrant I and Quadrant II Q1 –Important role of external sources for innovation such as market, customers and suppliers –Company ability to understand and exploit such sources –Innovation is iterative and interactive Q2 –Emphasise internal sources for innovation –Innovation seen as linear – interactions with customers only at the final stages of delivery

56
Case Studies: Quadrant III and Quadrant IV Q3 –Important role for external sources and internal capability –High innovation expenditure on non R&D activities eg, training and innovation related ICT Q4 –Passive reactive innovators – respond to external demands (customers, consultants and technical standards)
")
57
Case Studies: Quadrant dynamics

58
Case Studies Across-Quadrant Results: Absorptive Capacity Indicators Related prior knowledge and staff skills –Founders knowledgeable about the core technology –Employees have a high general level of education –Use of external and internal training but training budgets tend to be small – Use of variety of recruitment channels tailored to the company needs

59
Case Study Across-Quadrant Results: Absorptive Capacity Indicators Organisational structure and management practices Job and functional rotation Quality management practices Internal knowledge exchange mechanisms Emphasis on corporate culture Importance of workplace layout to maximise learning and knowledge exchange

60
Case Studies Across-Quadrants Results: Barriers to Innovation Finance Shortage of skilled labour Location specific factors –Local labour market –Attractiveness to labour –Infrastructure Choice of Location –Importance of residential preference and path dependence

61
Case Studies Across-Quadrants Results: Role of Networks Local networks –Low rates of participation –Few real benefits other than general awareness raising National and international networks –Provide innovation-related benefits mainly in the form of technical and professional inputs

62
Case Study Across-Quadrants Results: R&D Tax Credits Manufacturing: –General easy access –Benefit is through improving cash flow not directly influencing the decision to innovate Services: –Found it difficult to qualify –Some have resorted to professional accounting firms to negotiate acceptable settlement

63
Policy Implications Different forms of absorptive capacity have different effects on goods, service and process innovation. Management practices are important for innovation Training is important – but the evidence suggest that it is the training of managers not scientists that is important R&D tax credit has a positive and significant association with manufacturing product innovation. But case studies suggests that the transmission mechanism is through the impact on cashflow Networks are important, but their geographical impact varies across types of innovation. Policy focus in UK to develop local and regional networks might be detrimental in some sectoral and regional contexts.

64
Collaboration and Clusters According to Porter (1998) clusters aregeographic concentrations of interconnected companies, specialised suppliers, service providers, firms in related industries, and associated institutions (for example universities, standards agencies, and trade associations) in particular fields that compete but also co-operate
 clusters aregeographic concentrations of interconnected companies, specialised suppliers, service providers, firms in related industries, and associated institutions (for example universities, standards agencies, and trade associations) in particular fields that compete but also co-operate")
65
Collaboration and Clusters The stress on geographic concentrations is misleading The Porter analysis is based on where firms are, not what firms do Local collaborative behaviour is not an important driver of innovation National collaborators are consistently more important than local collaborators Important to distinguish between bridging and bonding networks – bridging networks that are outward looking may be more important for knowledge based activity

66
Further Information Centre for Business Research www.cbr.cam.ac.uk Programme on Regional Innovation www.regionalinnovation.org.uk

Similar presentations


 Bangladesh: A Strategy for Growth and Employment.>")


 Geometry (29%)>")


