Download presentation
Presentation is loading. Please wait.

1
Revenue Operations Institute for Attractions Managers IAAPA Operations and Safety MarketingLeadershipFinance Revenue Operations

2
2 Contents Industry Overview: What Is Revenue Operations? Revenue Theory: Why Is Revenue Operations Important? FunWorld Parks Revenue Operation Revenue Operations in Practice Skills Exercise – Case Study

3
Revenue Operations 3 Objectives Upon completion of this course, attendees will be able to: Describe the ways in which attraction revenue operations differ from high street retail Discuss the importance of revenue operations to an attractions total revenue Definition of terms: per capita, penetration, cost of goods, etc. Review the three major types of revenue operations Identify the key operational challenges for each area Describe pricing, layout and merchandising strategies to improve revenue operations results

4
Revenue Operations 4 Industry Overview What do we mean by revenue operations? All the non-gate revenue sources in a typical attraction Revenue types: Food & Beverage-In-park options, catering opportunities Retail-Merchandise Games of skill, videos, redemption Other (lockers, parking, rental [strollers, wheelchairs, etc.]) Revenue partners ( leased or concession operations) – Opportunity to diversify offerings and increase bottom line by leasing to established brand outlet for food or retail services
 Revenue partners ( leased or concession operations) – Opportunity to diversify offerings and increase bottom line by leasing to established brand outlet for food or retail services.")
5
Revenue Operations 5 Industry Overview (contd) What are the operating characteristics of these revenue areas in the attractions industry? Limited park season – Approx. Memorial Day to Labor Day Impulse purchases – One chance to capitalize; need to have right product available at the right time in the right location… Limited repeat business – Many guests come only once a season Season pass holders often do not spend much per visit (no need to bring home a memory) Effects on buying/pricing
 Effects on buying/pricing.")
6
Revenue Operations 6 Industry Overview (contd) What makes park retail different from traditional retail? Seasonality (limited opportunity for business) Attractions have one opportunity to make sale Majority of sales are at days end This is a difficult shift to staff and competes with guests desire to get home or to reserve last of disposable income Inventory commitments made months in advance of opening (difficult to change and limited time to update) Merchandise Planning-Categories/Pricing/Quantities/Imports v Domestic Need to turn inventory quickly -2X Goal (traditional retail 3+) Difficult to hold from one season to the next POS-Item (SKU) sales/Projections…
 Attractions have one opportunity to make sale Majority of sales are at days end This is a difficult shift to staff and competes with guests desire to get home or to reserve last of disposable income Inventory commitments made months in advance of opening (difficult to change and limited time to update) Merchandise Planning-Categories/Pricing/Quantities/Imports v Domestic Need to turn inventory quickly -2X Goal (traditional retail 3+) Difficult to hold from one season to the next POS-Item (SKU) sales/Projections….")
7
Revenue Operations 7 Industry Overview (contd) Characteristics of midway games or games of skill Important to entice guests interest through employee salesmanship, flash (merchandise display), and excitement of the area Play encourages play When one guest plays, more are drawn in Prize drives play, guest will play based on prize assortment, size and price Cash handling procedures & systems are different than traditional retail and must be managed carefully Midway games add incremental per cap to attractions which can be approximately 10% Redemption games are becoming increasingly more popular Videos are becoming more difficult
 Characteristics of midway games or games of skill Important to entice guests interest through employee salesmanship, flash (merchandise display), and excitement of the area Play encourages play When one guest plays, more are drawn in Prize drives play, guest will play based on prize assortment, size and price Cash handling procedures & systems are different than traditional retail and must be managed carefully Midway games add incremental per cap to attractions which can be approximately 10% Redemption games are becoming increasingly more popular Videos are becoming more difficult")
8
Revenue Operations 8 Revenue Theory Why is revenue operations important? All three types (F&B, retail, and games) are very profitable operations in and of themselves – They contribute significantly to the facilitys bottom line F&B/retail/games sales are critical to success – The industrys business formula is based on volume Funworld=36+% VS USA Parks=23% Revenue outlets are needed at the facility to meet guest demand – For food/drink, gifts/souvenirs, entertainment, variety A part of the park experience
 are very profitable operations in and of themselves – They contribute significantly to the facilitys bottom line F&B/retail/games sales are critical to success – The industrys business formula is based on volume Funworld=36+% VS USA Parks=23% Revenue outlets are needed at the facility to meet guest demand – For food/drink, gifts/souvenirs, entertainment, variety A part of the park experience.")
9
Revenue Operations 9 Revenue Theory (contd) Operations revenue and expense figures Potential revenue opportunities from the key revenue areas – Proportion of total income (All reporting amusement parks) 32.6% – Total % of income from all three revenue types, made up of: –Food & beverage: 19.2% –Retail: 7.1% –Games: 6.3% (2007 survey 9.8%)** Typical revenue and expense ratios: Globally, all in-park revenue* of amusement parks averages from 43% to 49% of the parks total income Globally, amusement park operations expenses average between 50% and 70% of the parks total income * Includes F&B, retail, and games revenue plus tenant/concessions, sponsorships, and other revenue. (no parking) Source: IAAPA, Managing Attractions for More Profit: An International Survey of Operational Performance, 2009
 Source: IAAPA, Managing Attractions for More Profit: An International Survey of Operational Performance,")
10
Revenue Operations 10 Revenue Theory (contd) Key terms in revenue operations Per capita (per caps) – Revenue divided by the number of visitors; Calculated for an individual location/facility, or sold item, and for the park as a whole, for a period (day, week, etc.) Importance: Levels the playing field; enables comparison of the sales on any item, or sales outlet, with any other Effective management tool –Sales per square foot…..sales per operating hour Cost of goods – Wholesale price retailer pays to obtain an item Importance: Directly impacts margin – Expense is taken directly from the bottom line Labor costs – Cost of the labor that was required to sell item Importance: Impacts margin, is important indicator of both insufficient labor (understaffed) and surplus labor (overstaffed)
 Key terms in revenue operations Per capita (per caps) – Revenue divided by the number of visitors; Calculated for an individual location/facility, or sold item, and for the park as a whole, for a period (day, week, etc.) Importance: Levels the playing field; enables comparison of the sales on any item, or sales outlet, with any other Effective management tool –Sales per square foot…..sales per operating hour Cost of goods – Wholesale price retailer pays to obtain an item Importance: Directly impacts margin – Expense is taken directly from the bottom line Labor costs – Cost of the labor that was required to sell item Importance: Impacts margin, is important indicator of both insufficient labor (understaffed) and surplus labor (overstaffed)")
11
Revenue Operations 11 How operations (in-park) revenue is analyzed To determine operations revenue, subtract the cost of goods and labor cost from sales revenue: Revenue derived from sales (minus sales tax) – Cost of goods =Gross margin – Labor cost -Supplies, equipment repairs etc. =Net/Operating profit The result is the net profit from revenue operations Revenue Theory (contd)
.")
12
Revenue Operations 12 Revenue Theory (contd) Average (Mean) cost of goods sold for each revenue operations area – Cost-of-sales ratios ( Includes product,packageing.freight,tax) As percentage of revenue produced in that area Source: IAAPA, Managing Attractions for More Profit: An International Survey of Operational Performance, 2004 Category Park LocationNumber of Guests TOTAL U.S. & Canada Europe All Other Countries 500,000 or Fewer 500,001 to 1,500,000 1,500,00 1 or More Open 200 Days Open > 200 Days Redemption Arcade Games16%20%25%20%23%20%17%23% Plush/Operator Games (2004) 25%27% 28%27% 24%26% Food and Beverage33%30%40%38%33%38%34% Merchandise (note variance)32%37%31%36%32%39%35%34%
 25%27% 28%27% 24%26% Food and Beverage33%30%40%38%33%38%34% Merchandise (note variance)32%37%31%36%32%39%35%34%.")
13
Revenue Operations 13 Revenue Theory (contd) Key metrics for all revenue operations Per caps – Amount spent per visitor Penetration – Sales/Checks-measured against total number of visitors in any given period Factors that influence the above two metrics Visitor mix –Tourists – More likely to buy souvenirs –Local repeat visitors – Less spending per trip –Group outings – School classes, seniors, etc.; patterns vary Weather Facilitys mix of offerings
 Key metrics for all revenue operations Per caps – Amount spent per visitor Penetration – Sales/Checks-measured against total number of visitors in any given period Factors that influence the above two metrics Visitor mix –Tourists – More likely to buy souvenirs –Local repeat visitors – Less spending per trip –Group outings – School classes, seniors, etc.; patterns vary Weather Facilitys mix of offerings")
14
Revenue Operations 14 FunWorld Parks Revenue Operation Revenue operations outlets at FunWorld 7 F&B outlets-3 Stands, 2 Sit Down Fast Food, 2 Full Service 12 carts Small catering operation- Picnic Grove-700 capacity 5 retail outlets-2 gift Shops, 2-Tee-Shirt Stores, General Store 2 games venues-22 Total Games

15
Revenue Operations 15 FunWorld Parks Revenue Operation (contd) Food & Beverage outlets* Types of F&B Relative advantages and disadvantages (from operations viewpoint) Food stands/carts (no seating) (12) –Pros/Cons Walk-up food & beverage outlets (3) pizza, snacks, etc. –Pros/Cons Sit-down fast food restaurants (2) –Pros/Cons Sit-down table service restaurants (2) –Pros/Cons * Note: FunWorld Park does not have branded food outlets.
 –Pros/Cons Sit-down table service restaurants (2) –Pros/Cons * Note: FunWorld Park does not have branded food outlets..")
16
Revenue Operations 16 FunWorld Parks Revenue Operation (contd) Food & Beverage outlets (contd) Key metrics and measures of success for F&B Per Capita/Average check Number of table turns per day (times a table is used by different party) Cost of Sales Labor cost Challenges for FunWorlds F&B operations manager Analyze sales information to determine food items that are selling and those that are not and modify orders accordingly Improve per caps/Margins
 Food & Beverage outlets (contd) Key metrics and measures of success for F&B Per Capita/Average check Number of table turns per day (times a table is used by different party) Cost of Sales Labor cost Challenges for FunWorlds F&B operations manager Analyze sales information to determine food items that are selling and those that are not and modify orders accordingly Improve per caps/Margins")
17
Revenue Operations 17 FunWorld Parks Revenue Operation (contd) Retail outlets Types of retail Relative advantages and disadvantages Carts Pros/Cons: Capture midway traffic, quick transaction time, ease of setup & tear down / high exposure to theft/inventory/cash control, weather, challenge to re- stock during business hours-Impulse items General gift store Pros/Cons: Specific, unique product mix, higher average transaction, upsell opportunities / drawing guests into the store, slower turn & higher risk on inventory/high number of SKUs (3) Souvenir/gift stores at exits of rides Pros/Cons: Forced traffic flow, relevant product mix, memory of the day impulse / lower spend per cap, limited opportunity to capture attention & sale (2) Photo booth Pros/Cons: Incremental spend, low inventory investment, opportunity for multiple location / equipment maintenance, new technologies/concession?
 Retail outlets Types of retail Relative advantages and disadvantages Carts Pros/Cons: Capture midway traffic, quick transaction time, ease of setup & tear down / high exposure to theft/inventory/cash control, weather, challenge to re- stock during business hours-Impulse items General gift store Pros/Cons: Specific, unique product mix, higher average transaction, upsell opportunities / drawing guests into the store, slower turn & higher risk on inventory/high number of SKUs (3) Souvenir/gift stores at exits of rides Pros/Cons: Forced traffic flow, relevant product mix, memory of the day impulse / lower spend per cap, limited opportunity to capture attention & sale (2) Photo booth Pros/Cons: Incremental spend, low inventory investment, opportunity for multiple location / equipment maintenance, new technologies/concession")
18
Revenue Operations 18 FunWorld Parks Revenue Operation Retail outlets (contd) Key metrics and measures of success for retail Per Capita/Gross Margins/Markdowns/Cost of goods Inventory control –POS Turns –Open to buy – Retail management tool Challenges for FunWorlds retail operations manager Merchandise Plan-need to make buying decisions months in advance – Anticipate styles and fads-Import/Domestic If items are not selling they must be unloaded quickly or theyll need to be written off -A reality….
 Key metrics and measures of success for retail Per Capita/Gross Margins/Markdowns/Cost of goods Inventory control –POS Turns –Open to buy – Retail management tool Challenges for FunWorlds retail operations manager Merchandise Plan-need to make buying decisions months in advance – Anticipate styles and fads-Import/Domestic If items are not selling they must be unloaded quickly or theyll need to be written off -A reality….")
19
Revenue Operations 19 FunWorld Parks Revenue Operation Games/arcade Types of games Relative advantages and disadvantages Single-player games (midway-type) –Pros/Cons Multi-player games (midway-type) –Pros/Cons Redemption centers (arcade game venue; points won earn tickets, which the player can accumulate to redeem for prizes at different value levels) –Relates especially to video games/arcades –Pros/Cons
 –Pros/Cons Multi-player games (midway-type) –Pros/Cons Redemption centers (arcade game venue; points won earn tickets, which the player can accumulate to redeem for prizes at different value levels) –Relates especially to video games/arcades –Pros/Cons")
20
Revenue Operations 20 FunWorld Parks Revenue Operation Games/arcade (contd) Key metrics and measures of success for games Virtually the same…New terms Gaffe (set-up), Give (cost of goods), Flash (merchandising) for the game; how many winners-How to control Challenges for FunWorlds games operations manager Purchasing challenges are similar to retail: Need to make decisions six months in advance as to what will be hot prizes- Popularity of prizes can be major driver of whether visitors play games or not-Outgoing staff helps (Hiring practices) Redemption centers – The redemption tickets equal cash; there must be an effective system to control them-Think Skeeball Videos-How many?/Mix?/Redemption Component?/Who owns?/Split?
 Key metrics and measures of success for games Virtually the same…New terms Gaffe (set-up), Give (cost of goods), Flash (merchandising) for the game; how many winners-How to control Challenges for FunWorlds games operations manager Purchasing challenges are similar to retail: Need to make decisions six months in advance as to what will be hot prizes- Popularity of prizes can be major driver of whether visitors play games or not-Outgoing staff helps (Hiring practices) Redemption centers – The redemption tickets equal cash; there must be an effective system to control them-Think Skeeball Videos-How many /Mix /Redemption Component /Who owns /Split")
21
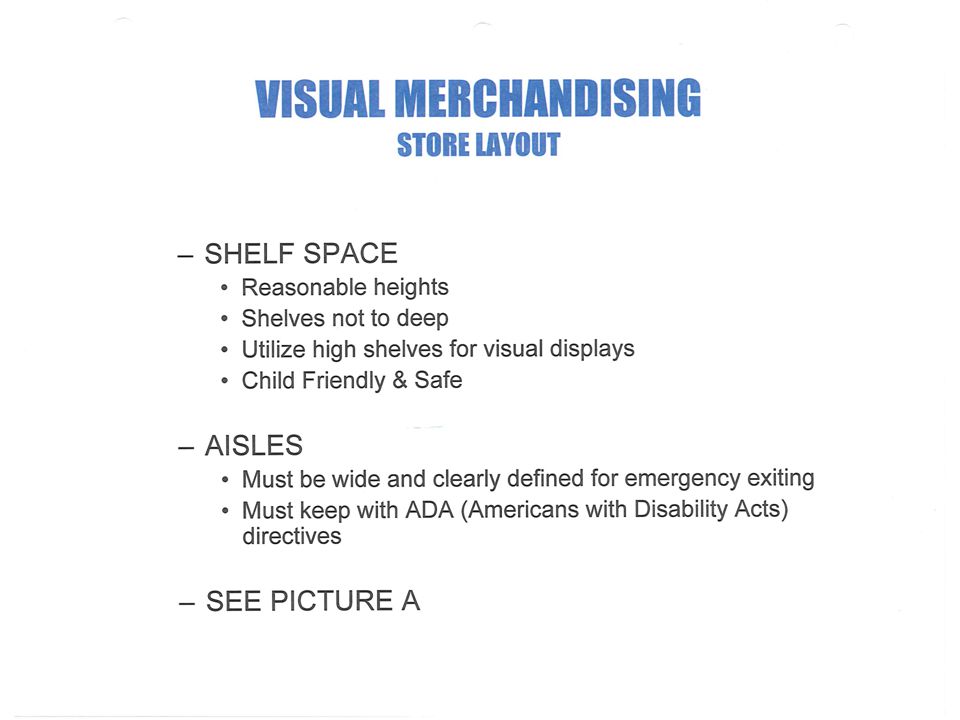
Revenue Operations 21 Practical factors affecting revenue operations Layout/placement of F&B, retail, and game areas ** Location of all types of outlets must preserve traffic flow –Must be integrated with the attraction design and layout –Outlets easily accessible from, but not impeding, main flow of traffic –Ride exit flow (recent trend: exiting a ride through a gift shop) Food – Offer convenient venues for all types of food needs –Quick drink stands, vending machines, snack shops –For popular restaurants, open location – Space for lines, in shade –Provide convenient cold drinks on hot days, and vice versa Retail – Expert visual merchandising, reflect theme/brand –Make it as easy as possible for people to spend money, but not feel theyre being pressured Revenue Operations in Practice
 Food – Offer convenient venues for all types of food needs –Quick drink stands, vending machines, snack shops –For popular restaurants, open location – Space for lines, in shade –Provide convenient cold drinks on hot days, and vice versa Retail – Expert visual merchandising, reflect theme/brand –Make it as easy as possible for people to spend money, but not feel theyre being pressured Revenue Operations in Practice")
22
Revenue Operations 22 Practical factors affecting revenue operations (contd) Layout/placement of F&B, retail, and game areas (contd) Games – Should be located in high traffic areas –Display the plush (prizes) outside – Appealing, draws interest Pricing strategies Products should be at prices relative to competitors (both in the park and on the street) and customer profile Product offerings should cover all price levels to meet the spending composition of all guests Trading guests up without trading them away – Focus on average retail size of transaction ($5-7) and increase units per transaction, while balancing the layering of price points Revenue Operations in Practice
 Layout/placement of F&B, retail, and game areas (contd) Games – Should be located in high traffic areas –Display the plush (prizes) outside – Appealing, draws interest Pricing strategies Products should be at prices relative to competitors (both in the park and on the street) and customer profile Product offerings should cover all price levels to meet the spending composition of all guests Trading guests up without trading them away – Focus on average retail size of transaction ($5-7) and increase units per transaction, while balancing the layering of price points Revenue Operations in Practice")
23
Revenue Operations 23 Practical factors affecting revenue operations (contd) Inventory control An attraction selling $5 million at retail is dealing with thousands of items, which need to be sold to be profitable Need for strong policy and procedures, good systems, and good management to move the merchandise Important to develop inventory and cash control procedures and physical inventory procedures Open to Buy report –Definition: The dollar amount of merchandise budgeted for a particular period that a buyer has not yet ordered –A management tool – Tells buyer what is selling and not selling, to allow decisions early in season of what to discount-TRENDS/PROJECTIONS Revenue Operations in Practice (contd)
 Inventory control An attraction selling $5 million at retail is dealing with thousands of items, which need to be sold to be profitable Need for strong policy and procedures, good systems, and good management to move the merchandise Important to develop inventory and cash control procedures and physical inventory procedures Open to Buy report –Definition: The dollar amount of merchandise budgeted for a particular period that a buyer has not yet ordered –A management tool – Tells buyer what is selling and not selling, to allow decisions early in season of what to discount-TRENDS/PROJECTIONS Revenue Operations in Practice (contd)")
24
Revenue Operations 24 Practical factors affecting revenue operations (contd) Inventory control (contd) Shrinkage/ loss prevention/ Cash Control – Cannot afford to ignore –Goal is not to eradicate it (which is impossible), but to get it down to a number that is manageable –Need to have enough controls to keep the honest people honest but not make the park an unpleasant place to work Employee training Upselling Employees – Well-trained in cash register, suggestive selling Guest contact – Individual sales to each customer; focus on individual sales, upselling, and transaction speed-Eye Contact/Smile The right employees are crucial in games – Fun, energetic, engaging, outgoing; they will make or break success of games Revenue Operations in Practice (contd)
 Inventory control (contd) Shrinkage/ loss prevention/ Cash Control – Cannot afford to ignore –Goal is not to eradicate it (which is impossible), but to get it down to a number that is manageable –Need to have enough controls to keep the honest people honest but not make the park an unpleasant place to work Employee training Upselling Employees – Well-trained in cash register, suggestive selling Guest contact – Individual sales to each customer; focus on individual sales, upselling, and transaction speed-Eye Contact/Smile The right employees are crucial in games – Fun, energetic, engaging, outgoing; they will make or break success of games Revenue Operations in Practice (contd)")
25
Revenue Operations 25 Creating new operations revenue sources Non-traditional revenue sources/opportunities: VIP tours, front-of-line access, birthday parties, sleepovers Mitigating the unpredictability of retail – Increase operations revenue by: Targeting outer-market visitors: Learn what demographics are being marketed and focus product mix to that market Leveraging group sales: Find out (from Group Sales Dept.) about parks group business and tailor food and retail products specifically to reach those groups Wooing repeat customers: Local visitors may respond to effective couponing and promotion of non-logo items (fudge, candy, etc.) Revenue Operations in Practice (contd)
 about parks group business and tailor food and retail products specifically to reach those groups Wooing repeat customers: Local visitors may respond to effective couponing and promotion of non-logo items (fudge, candy, etc.) Revenue Operations in Practice (contd)")
26
Revenue Operations 26 Skills Exercise Case Study FunWorld Parks Revenue Operations have shown consistent results, but each department has areas in which it can improve... Identify each areas: Major strengths and weaknesses New operating strategies you would employ to improve performance Any capital investments you would propose to improve the bottom line

Similar presentations