Download presentation
Presentation is loading. Please wait.

1
What’s happening with Jobcentre vacancies
Paul Bivand Inclusion

2
Survey vacancies flat, JCP up

3
How does that compare to new JSA claims?
Still talking about 30-hour vacancies

4
Turning new vacancies and claims into a single ratio

5
Drilling down more deeply...
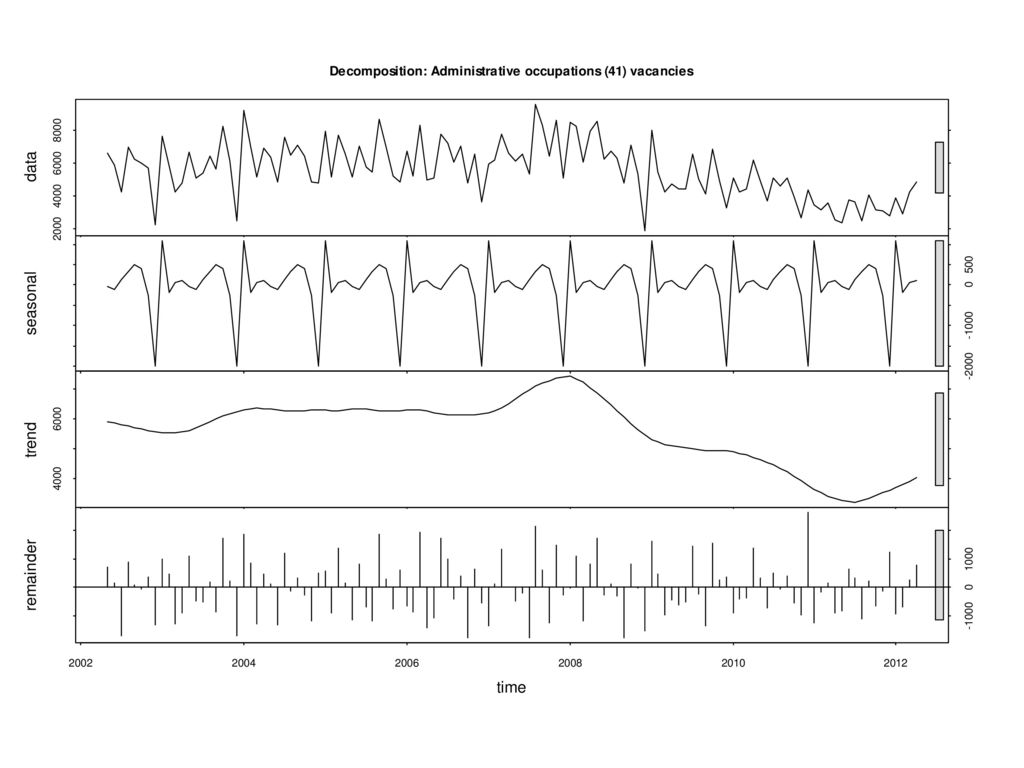
We study 26 groups of jobs covering all occupations that are not managerial, professional or associate professional We analyse the seasonal patterns We analyse the trends And we compare with new JSA claims – because some jobs are higher turnover than others – this corrects for that

6
An example ...

7
Comparing that to new JSA claims

8
Administrative occupations

9
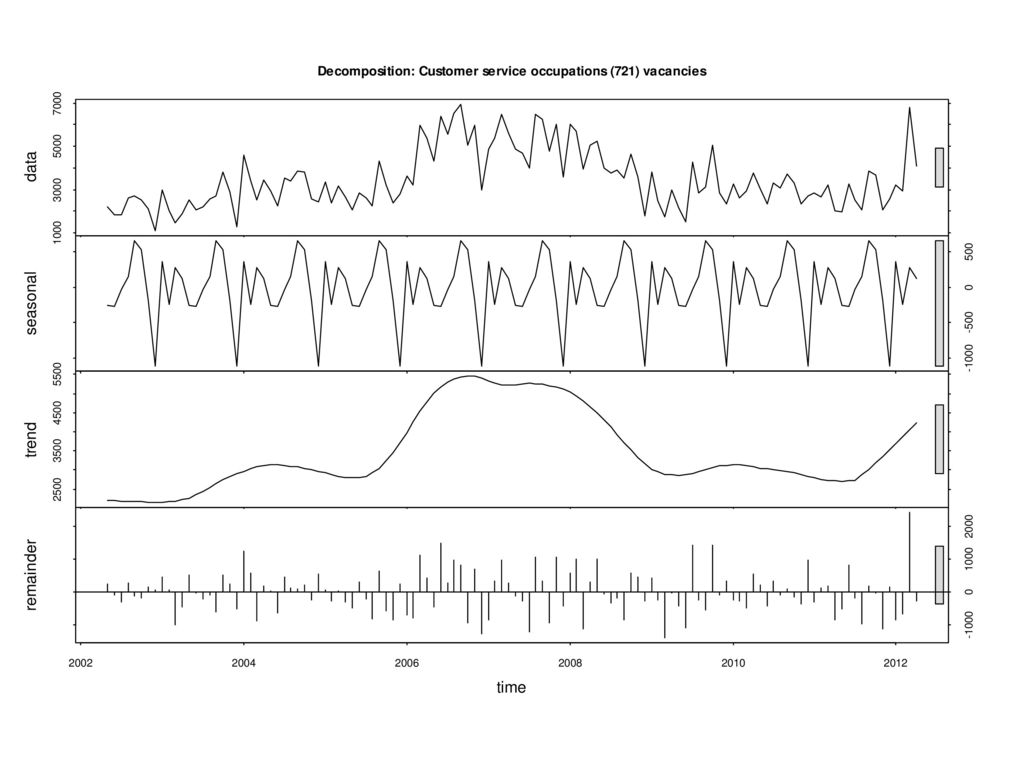
Customer service recovering

10
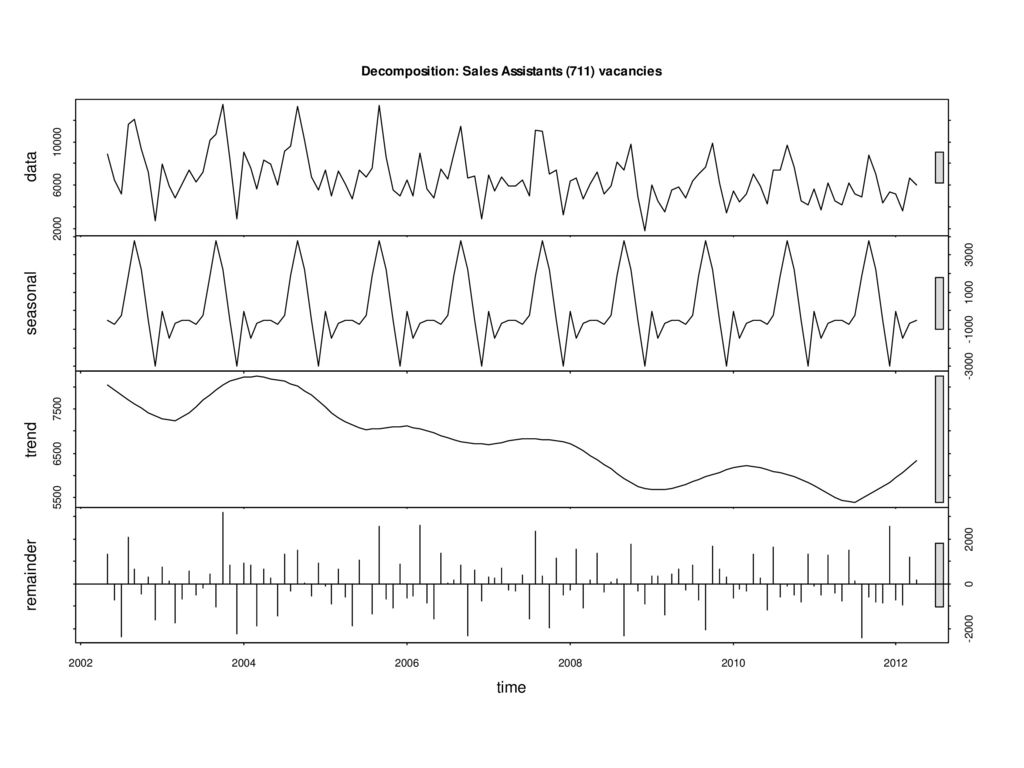
Sales assistants – not (but may be changing names)
")
11
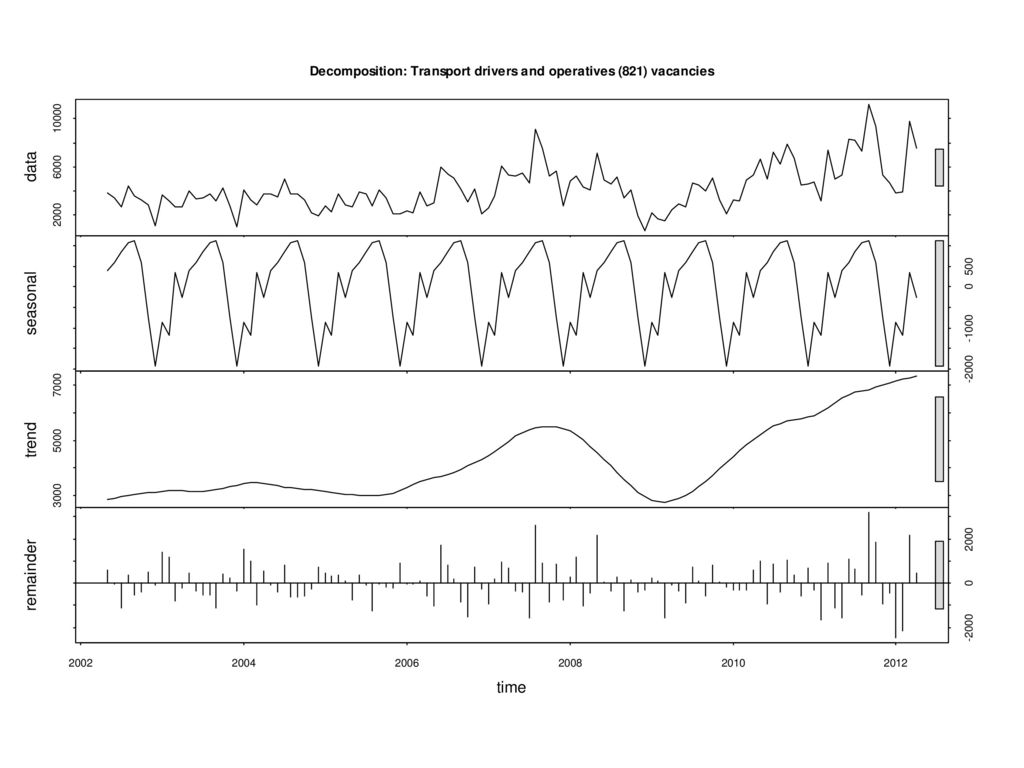
But some areas looking better - drivers

12
Looking at the much of the labour market makes your eyes ache.
Date 911 : Elementary Agricultural Occupations 912 : Elementary Construction Occupations 913 : Elementary Process Plant Occupations 914 : Elementary Goods Storage Occupations 921 : Elementary Administration Occupations 922 : Elementary Personal Services Occupations 923 : Elementary Cleaning Occupations 924 : Elementary Security Occupations 925 : Elementary Sales Occupations 811 : Process Operatives 812 : Plant And Machine Operatives 813 : Assemblers And Routine Operatives 814 : Construction Operatives 821 : Transport Drivers And Operatives 822 : Mobile Machine Drivers And Operatives 711 : Sales Assistants And Retail Cashiers 712 : Sales Related Occupations 721 : Customer Service Occupations 41 : Administrative Occupations 42 : Secretarial and Related Occupations 51 : Skilled Agricultural Trades 52 : Skilled Metal and Electronic Trades 53 : Skilled Construction and Building Trades 54 : Textiles, Printing and Other Skilled Trades 61 : Caring Personal Service Occupations 62 : Leisure and Other Personal Service Occupations May 2008 0.7 1.0 0.6 6.5 2.1 3.4 5.0 7.2 1.5 2.0 1.8 1.4 2.5 17.3 4.0 1.6 2.6 1.2 2.7 3.6 1.3 June 2008 0.8 0.9 6.3 3.3 4.5 6.6 1.7 1.1 2.3 15.2 3.5 1.9 2.4 July 2008 0.5 5.9 3.1 4.3 14.0 3.2 2.2 August 2008 5.2 3.9 6.1 12.4 2.9 September 2008 4.1 3.0 3.7 11.0 0.4 October 2008 5.5 11.1 November 2008 5.1 2.8 10.5 December 2008 0.3 4.7 January 2009 4.4 4.8 9.0 February 2009 8.5 March 2009 3.8 7.8 April 2009 8.6 May 2009 8.7 June 2009 10.2 July 2009 9.5 August 2009 10.9 September 2009 10.1 October 2009 4.6 11.2 November 2009 December 2009 January 2010 February 2010 12.1 March 2010 5.6 13.4 April 2010 6.7 14.9 May 2010 7.6 16.4 June 2010 6.8 18.3 July 2010 6.2 19.9 August 2010 19.5 0.2 September 2010 18.4 October 2010 6.4 17.9 November 2010 26.6 December 2010 7.4 26.1 January 2011 5.7 22.5 February 2011 5.4 13.1 March 2011 5.3 14.6 April 2011 16.1 May 2011 June 2011 14.1 July 2011 12.3 August 2011 September 2011 October 2011 10.6 4.2 14.3 November 2011 13.5 16.6 December 2011 15.5 18.1 January 2012 12.9 21.8 February 2012 19.2 March 2012 12.2 18.9 April 2012 11.9 5.8 14.8 May 2012 15.7 Looking at the much of the labour market makes your eyes ache. We’ve got time down the left – where the red and yellow spreads across is the recession. Some occupation groups have not come back. Some, however, have. There are stories about change within sectors that are useful to know here. In Sales, there are changes to odd, difficult to classify, sales related jobs. Customer services just back in the green. Semi-skilled manufacturing and transport mostly green. Some skilled trades doing well but not others. Administrative and secretarial still stuck in recession. More details in the packs

13
The regional picture Region Latest Rank Last Month Change on month
Last Month Change on month Same Month last year Change on year East 1.55 4 1.57 -0.01 1.18 0.38 East Midlands 1.73 2 1.59 0.14 1.14 0.59 London 1.02 10 0.95 0.07 0.67 0.35 North East 11 0.97 0.05 0.82 0.20 North West 1.36 6 1.32 0.04 1.00 0.37 Scotland 1.05 9 1.03 0.02 0.80 0.25 South East 1.78 1 1.71 0.60 South West 1.69 3 1.66 0.03 1.28 0.41 Wales 1.20 7 1.17 0.17 West Midlands 1.52 5 0.00 0.34 Yorkshire and The Humber 8 1.15 0.94 0.23 Highest number or largest rise These are based on seasonally adjusted figures Lowest number or largest fall

14
Colour-coded by qualifications of entrants - median

15
How do we do this? Jobcentre notified vacancies from NOMIS – standardised to weeks a month R function stl() to decompose using loess for trend, “periodic” means unchanging seasonal factors Result smoothed with 3-month moving average The Occupation/Earnings/qualifications is ASHE for Occupation/earnings/number in group and LFS for qualifications of recent job starters
 to decompose using loess for trend, periodic means unchanging seasonal factors. Result smoothed with 3-month moving average. The Occupation/Earnings/qualifications is ASHE for Occupation/earnings/number in group and LFS for qualifications of recent job starters.")
21
JSA claimant inflows Similar methods for people with a usual occupation in the group Improvements possible. Would be useful if ONS could share X12 spec files for claimant flows – 4/5 weeks are same, public holidays. Vacancy figures offset from claimants by one week so public holidays differ

22
Is the analysis useful? Provides useful view of trends
But likely to be prone to ‘blips’ even with three-month moving average Occupations rather than sectors as c. 50% of Jobcentre vacancies in SIC (2003) 74 – Other Business Activities - including recruitment agencies, contract cleaning, security guarding
 74 – Other Business Activities - including recruitment agencies, contract cleaning, security guarding.")
23
Problems ahead... The data we have includes several changes to Jobcentre processes Our users – with active engagement with Jobcentre Plus – are in a position to query JCP staff From November, the vacancies platform moves to Monster UK – likely to be break in all series

Similar presentations


 Overview and Training Session 24 June 2008 North East.>")
8.008.44 75th percentile12.5012.30 90th percentile22.6619.38.>")


