Download presentation
Presentation is loading. Please wait.

1
Jim Dunn Ag Economist Pennsylvania State University
Feed Outlook Jim Dunn Ag Economist Pennsylvania State University

2
Sources of Information USDA

3
What these are called USDA Economics, Statistics and Market Information System (ESMIS) Field Crops Outlooks, Yearbooks, and Estimates Feed Outlook WASDE

4
Other useful links Oil Crops Outlook
Livestock, Dairy, and Poultry Outlook Milk Production Feed grains database Livestock, Dairy, and Poultry Outlook: Tables

5
Issues for Feed Economy
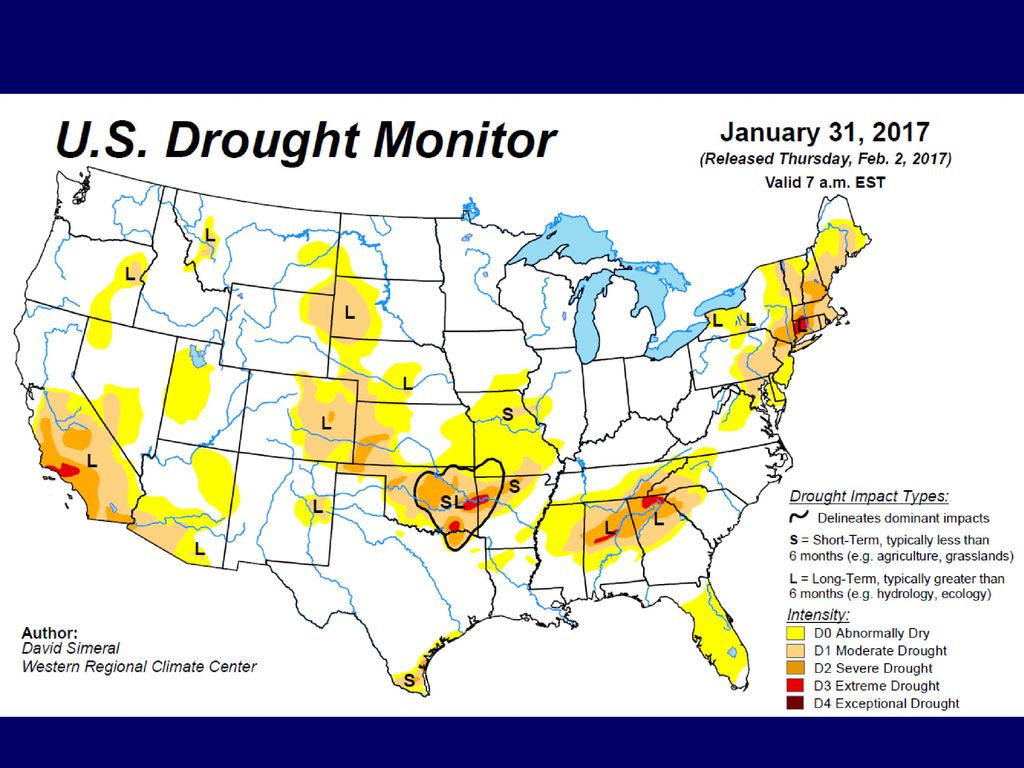
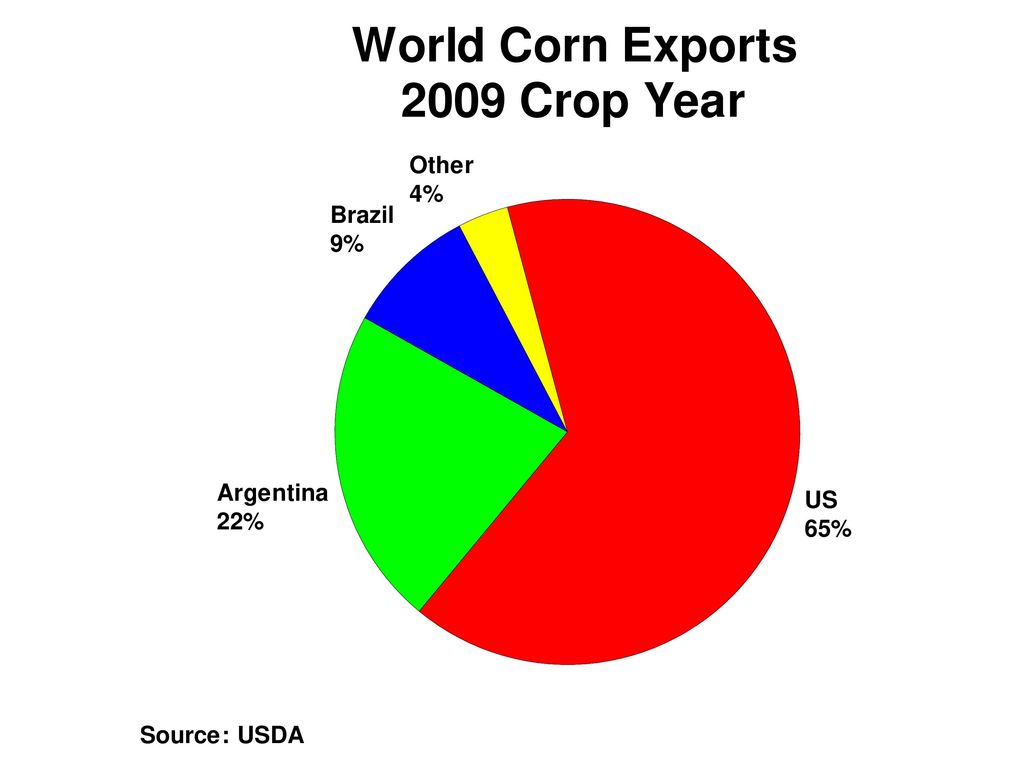
Large 2015 & 2016 US crops Brazil & Argentina Falling land prices Expensive dollar Chinese economy Russian Embargo Weather

6
Ethanol Demand falling because of better fuel economy
Not the issue it was in past Smaller portion of corn crop Talk of dropping mandate In election Rep King from Iowa wasn’t pushing it World opposition to fuel from food building

7
Corn Notes Chinese economy slumping
China trying to increase hog production South American crop will be okay

9
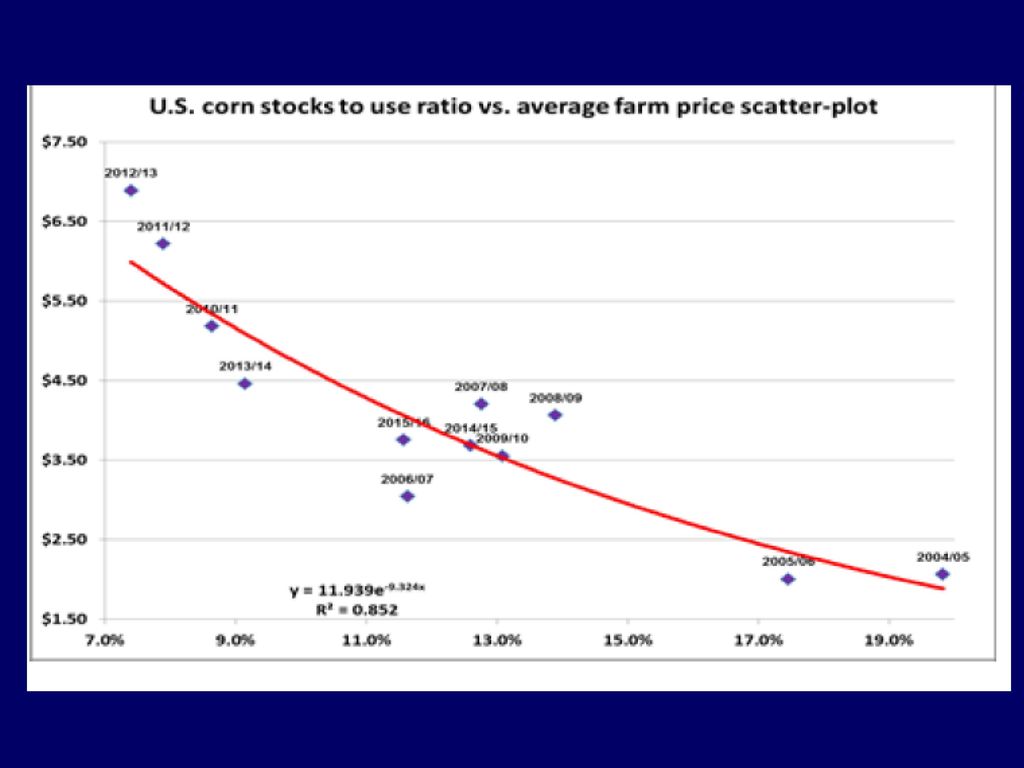
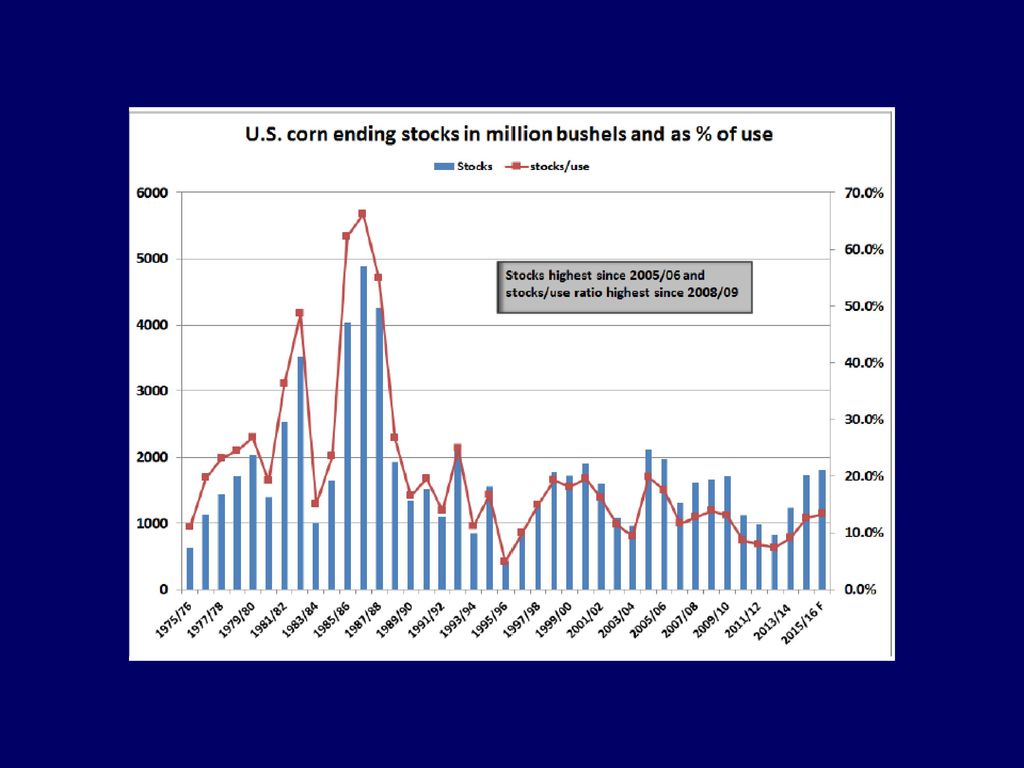
Corn Supply Bil. Bu. Year Beg stocks Production Supply 2012/13 0.99
10.78 11.93 2013/14 0.82 13.92 14.78 2014/15 1.23 14.22 15.48 2015/16 1.73 13.60 15.37 2016/17 1.74 15.15 16.94 Source: USDA

10
Corn Usage bil. bu Year Feed Food Fuel Exports Total 2012/13 4.33 1.40
4.64 0.73 11.18 2013/14 5.03 1.37 5.13 1.92 13.45 2014/15 5.32 1.36 5.21 1.73 13.48 2015/16 5.30 1.89 13.57 2016/17 5.60 1.43 5.33 2.26 14.58 Source: USDA

11
Corn Usage Crop 2004 2010 2015 2016 Feed 57.8% 36.7% 39.1% 38.4% Food
12.8% 10.8% 10.1% 9.4% Exports 17.1% 14.2% 12.5% 16.1% Ethanol 12.4% 38.5% 38.3% 36.2%

13
Other mostly Russia and Ukraine

14
Corn Futures Price (CBOT)
Market data is the property of Chicago Mercantile Exchange (CME).Access to this website and use of this market data is subject to the following: (a) Market data is for the recipients own personal use and may not be redistributed without permission of CME, which may depend on execution of an agreement and payment of the applicable fee; (b) CME and its licensors reserve all Intellectual Property Rights to market data; (c) CME and TradingCharts disclaims all liability for market data and use thereof, and any and all losses, damages or claims arising from use of market data; (d) CME and TradingCharts may suspend or terminate receipt of market data by any party if CME has reason to believe market data is being misused or misrepresented. It is also a condition of access to this website that you agree to not copy, disseminate, capture, reverse engineer or otherwise use information provided on this site for any other purpose except for the direct display in Internet browser of the end user only, and only in the format provided. These pages © TradingCharts.com, Inc.
.Access to this website and use of this market data is subject to the following: (a) Market data is for the recipients own personal use and may not be redistributed without permission of CME, which may depend on execution of an agreement and payment of the applicable fee; (b) CME and its licensors reserve all Intellectual Property Rights to market data; (c) CME and TradingCharts disclaims all liability for market data and use thereof, and any and all losses, damages or claims arising from use of market data; (d) CME and TradingCharts may suspend or terminate receipt of market data by any party if CME has reason to believe market data is being misused or misrepresented. It is also a condition of access to this website that you agree to not copy, disseminate, capture, reverse engineer or otherwise use information provided on this site for any other purpose except for the direct display in Internet browser of the end user only, and only in the format provided. These pages © TradingCharts.com, Inc.")
16
Russian Corn Exports

17
Ukrainian Corn Exports

18
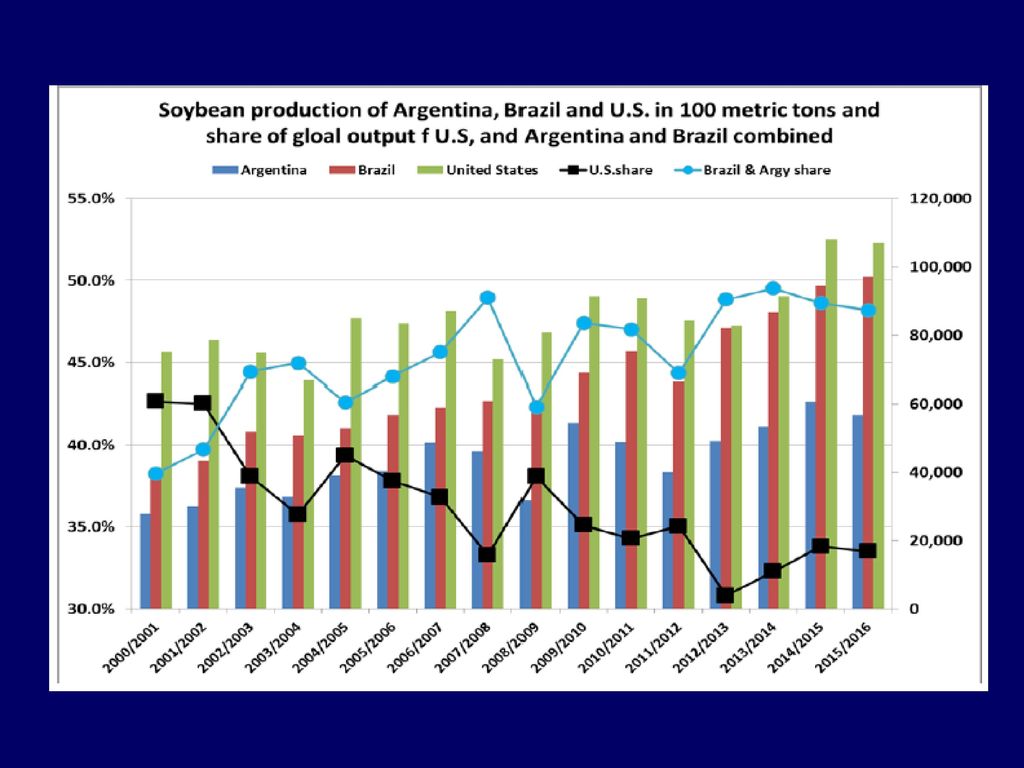
Soybean Notes South American crop is good – up 4% from last year, esp. Brazil China may be buying again World supply is up 8% US exports will probably struggle

21
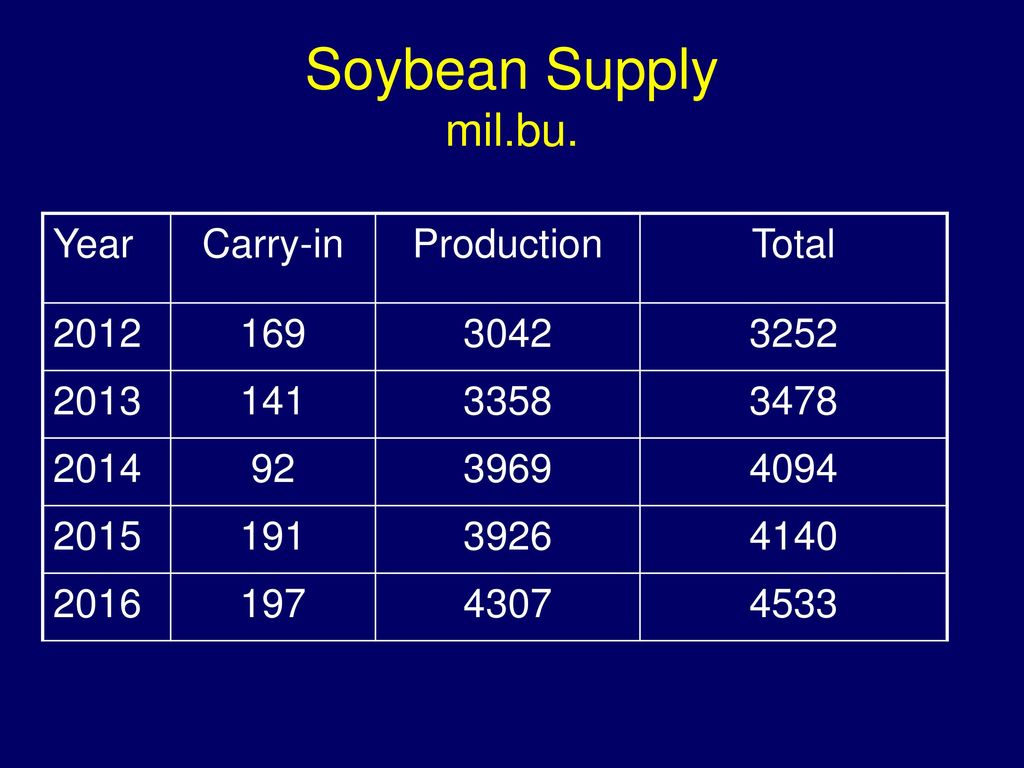
Soybean Supply mil.bu. Year Carry-in Production Total 2012 169 3042
3252 2013 141 3358 3478 2014 92 3969 4094 2015 191 3926 4140 2016 197 4307 4533
22
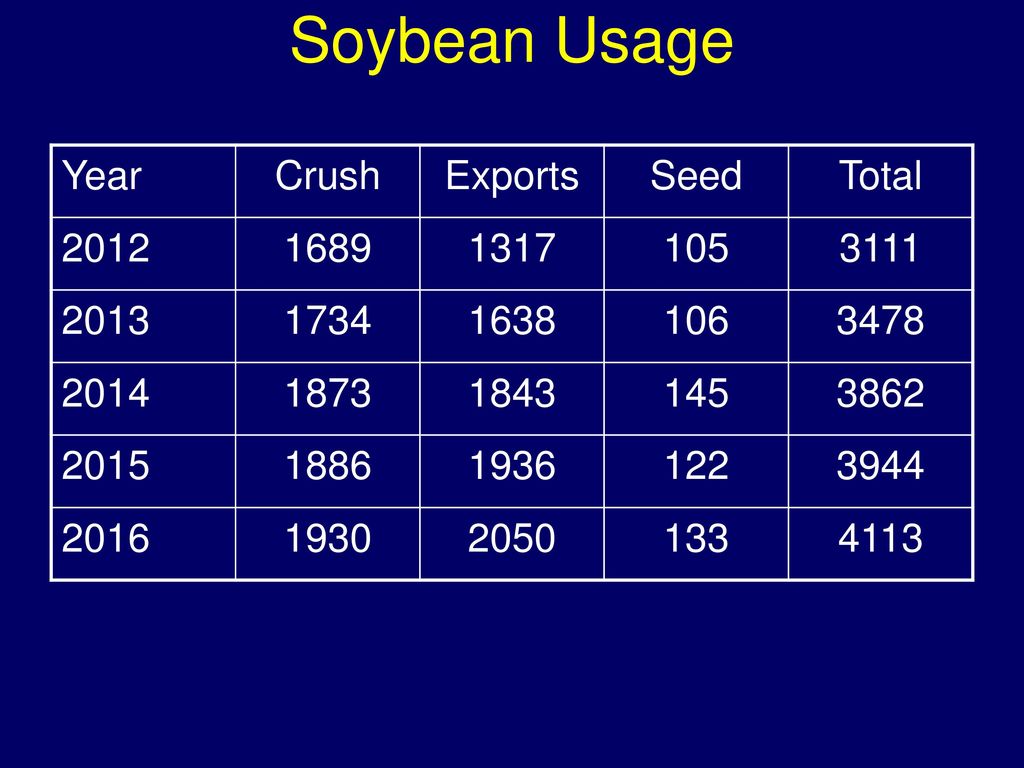
Soybean Usage Year Crush Exports Seed Total 2012 1689 1317 105 3111
2013 1734 1638 106 3478 2014 1873 1843 145 3862 2015 1886 1936 122 3944 2016 1930 2050 133 4113
23
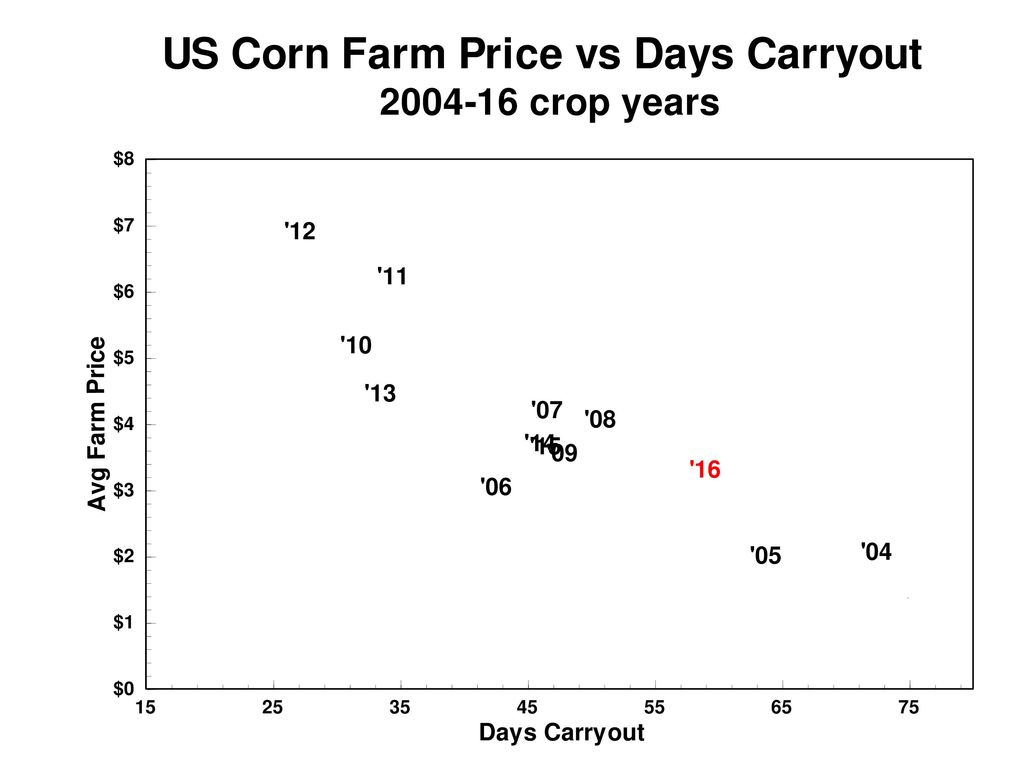
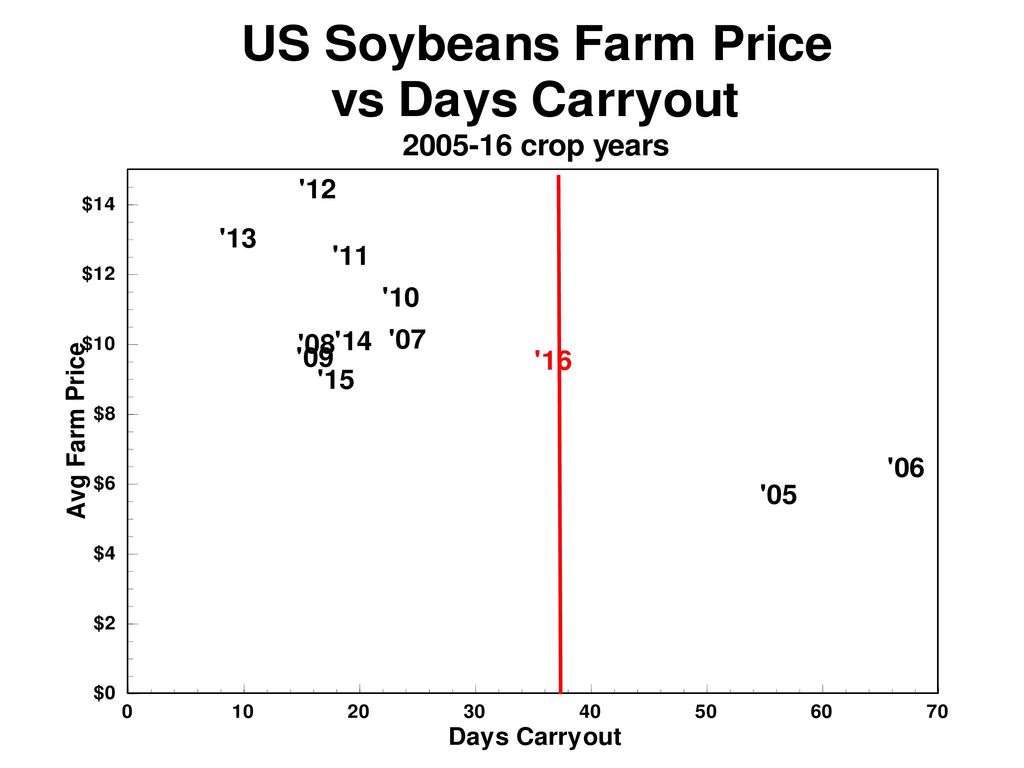
Soybean Carryout & Price
Year Carryout mil. bu. Price Days Use of carryout 2012 141 $14.40 16 2013 92 $13.00 9.5 2014 191 $10.10 19.5 2015 197 $8.80 45.1 2016 420 9.50 36.8

25
Soybean Futures

26
Corn futures prices 2/7/17 Month Price (cts/bu.) March 17 368 May 17
376 July 17 383 Sept 17 390 Dec 17 396

29
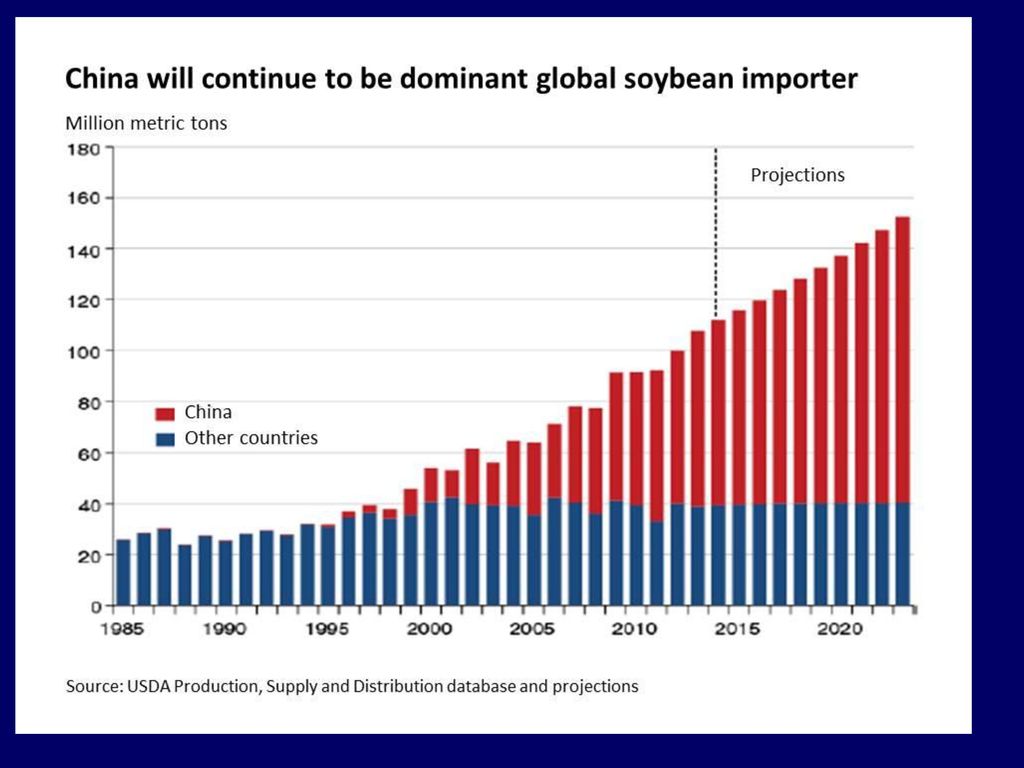
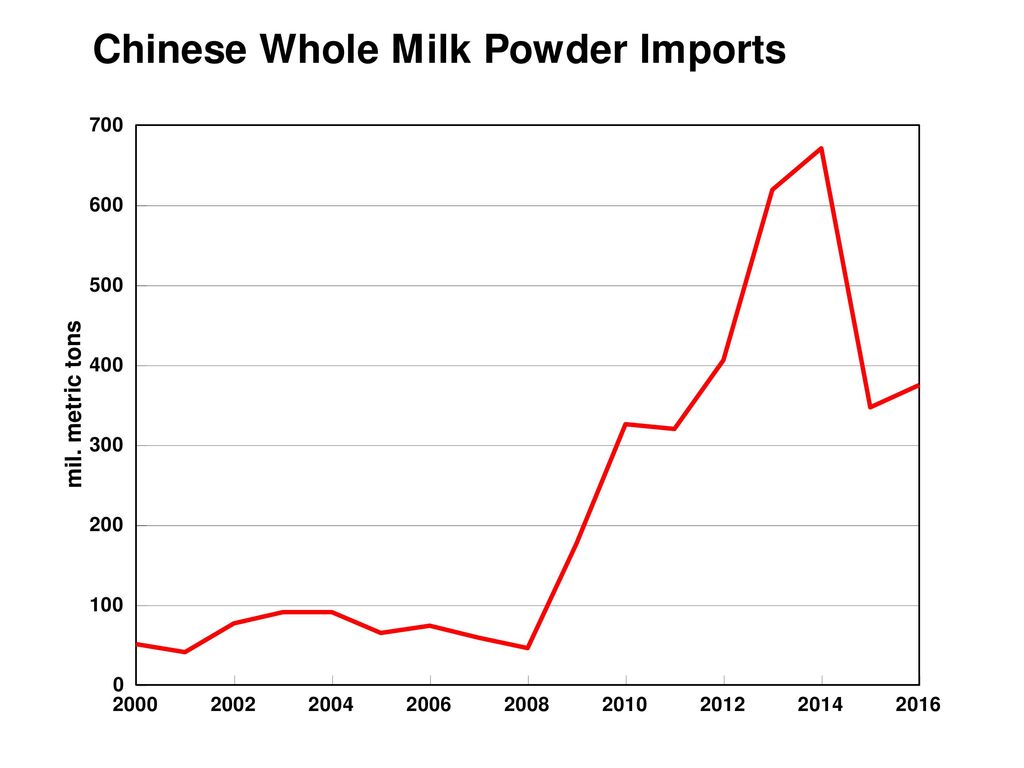
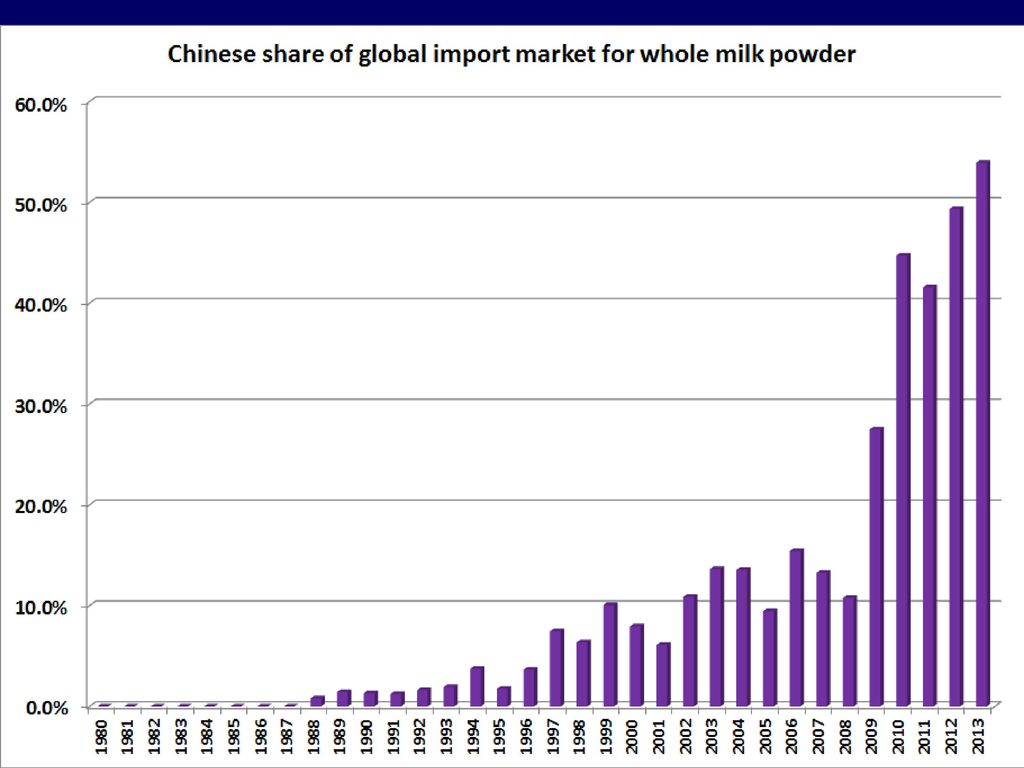
China Meat consumption grew nearly ten-fold to 71 million metric tons since 1975 Just announced it is scaling back its annual grain production targets to put a greater emphasis on quality rather than quantity Big effect on imports of feed and animal products – already the big player Chinese per capita meat consumption has doubled since 1992 to 52.5 kilograms (114 lbs) US at about 211 lbs.
 US at about 211 lbs.")
30
Soybean futures prices 2/7/17
Month Price (cts/bu.) March 17 1043 May 17 1053 July 17 1061 Sept 17 1038 Nov 17 1019
 March May July Sept Nov")
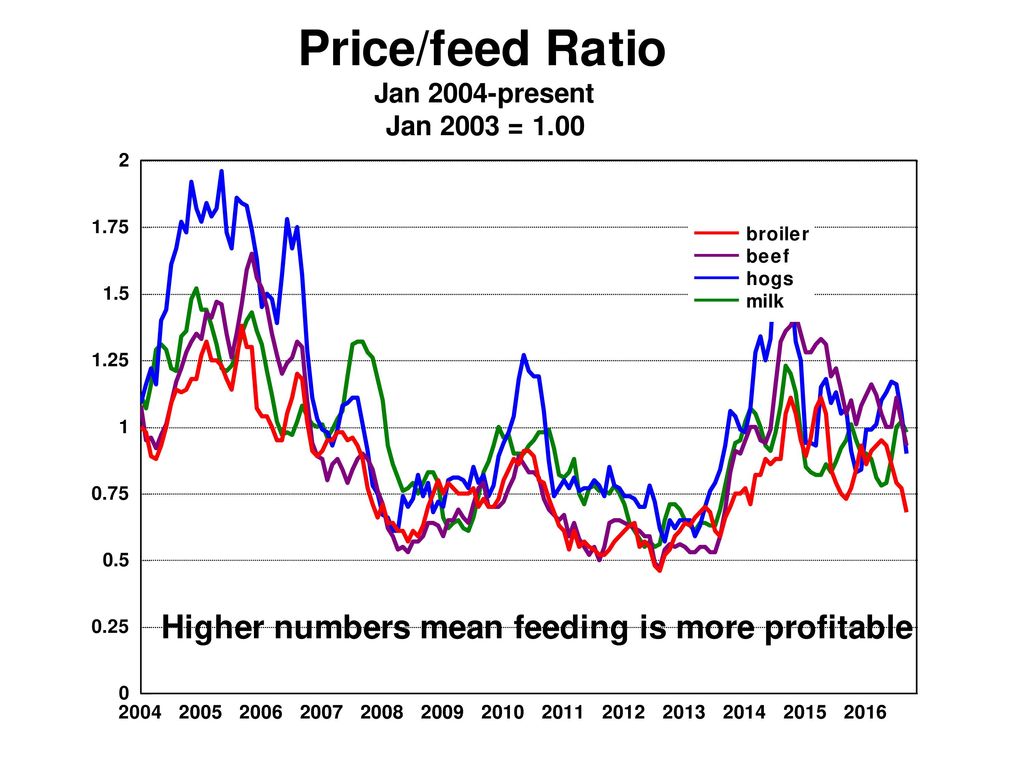
34
Cattle Market Prices high through most of 2017
In November, average retail choice-beef prices were a near record $6.31/lb. – demand lower

35
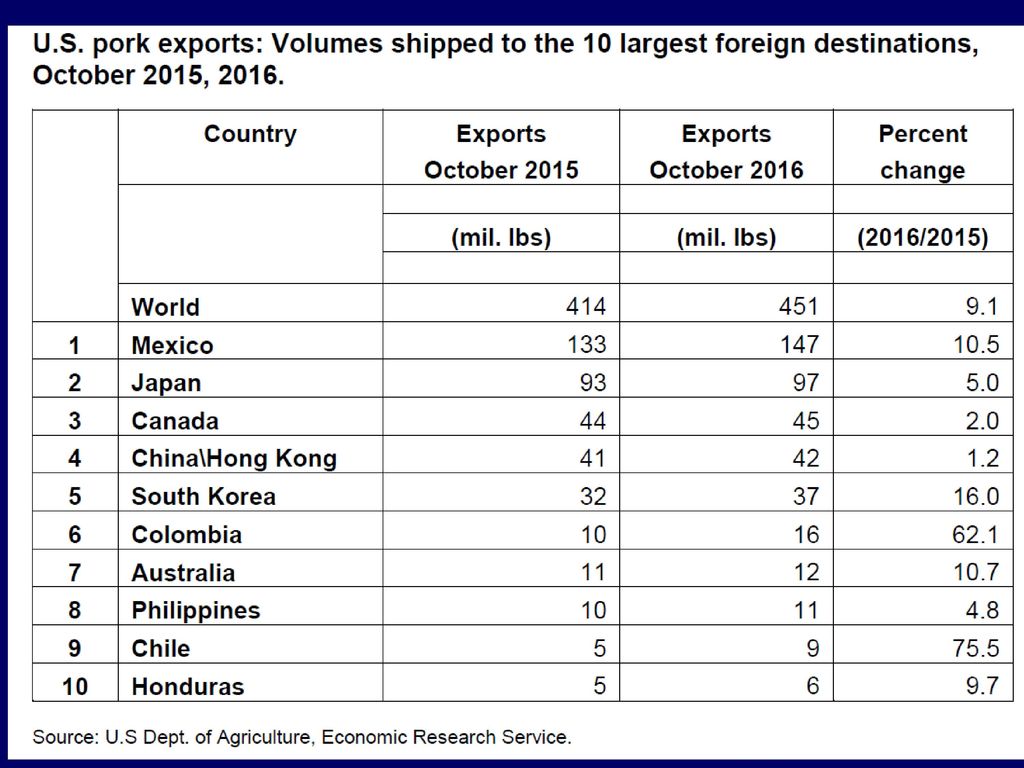
Hog notes Hog market struggling Grain prices low
Dollar is hurting exports Pressure about practices - animal rights Modern facilities better than traditional in my view

36
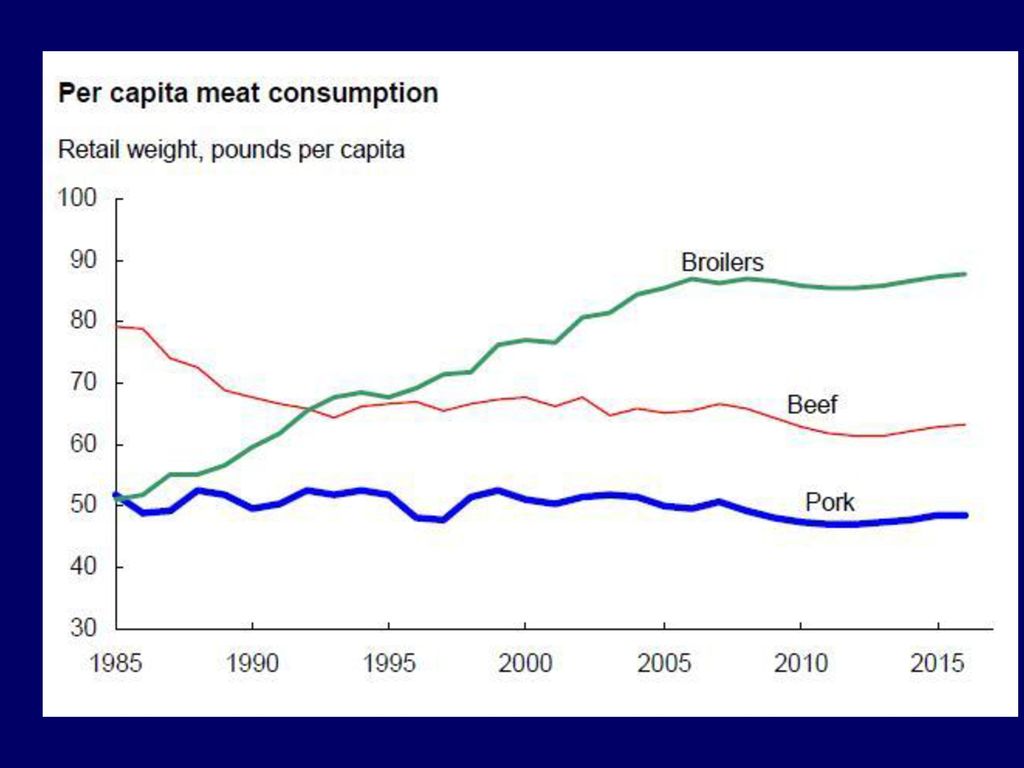
Poultry Notes Eggs and Broilers cheapest form of protein
Margins better Exports important and weakness in world economy affects price

47
Concluding Questions Lower feed prices help animal agriculture
Will feed prices stay low? Corn & soybean meal will Hay depends on our weather Will we really keep cutting per capita meat consumption?

Similar presentations