Download presentation
Presentation is loading. Please wait.

1
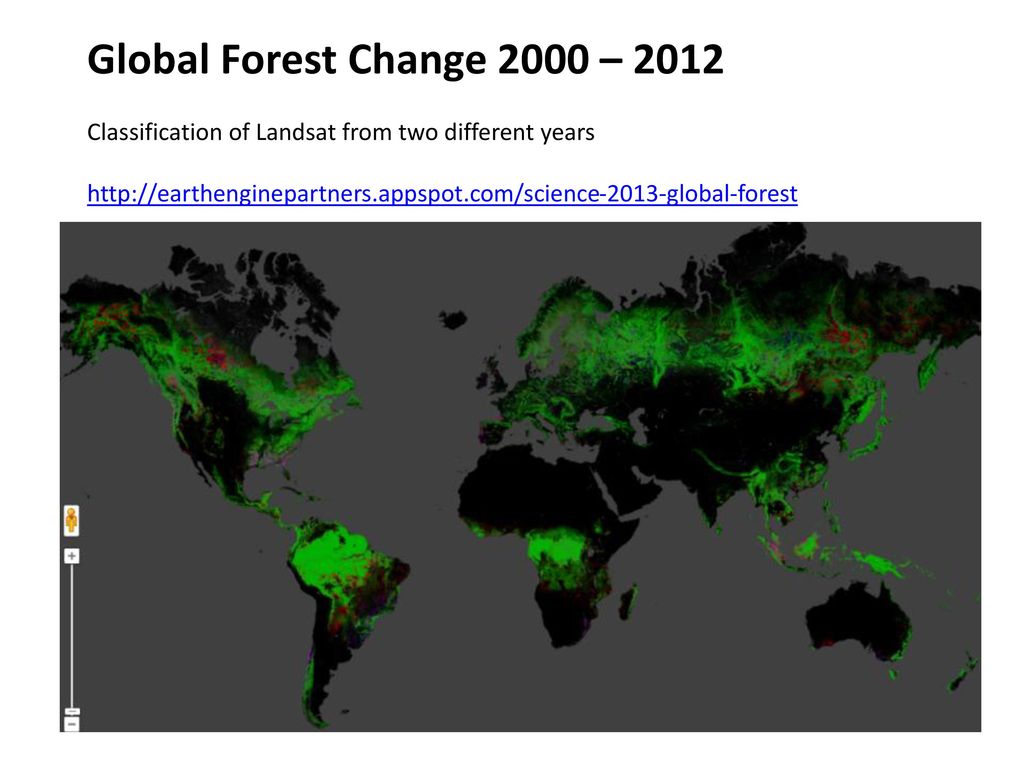
Global Forest Change 2000 – 2012 Classification of Landsat from two different years
2
Global warming

3
2010 tied with 2005 as the warmest year since global records began in 1880

4
Global Change monitoring
Minimum arctic ice cover Sept (yellow line = median ) Remotely sensed imagery is suitable for monitoring events and changes, with regular orbits
 Remotely sensed imagery is suitable for monitoring events and changes, with regular orbits.")
5
ice predicted to disappear 2030
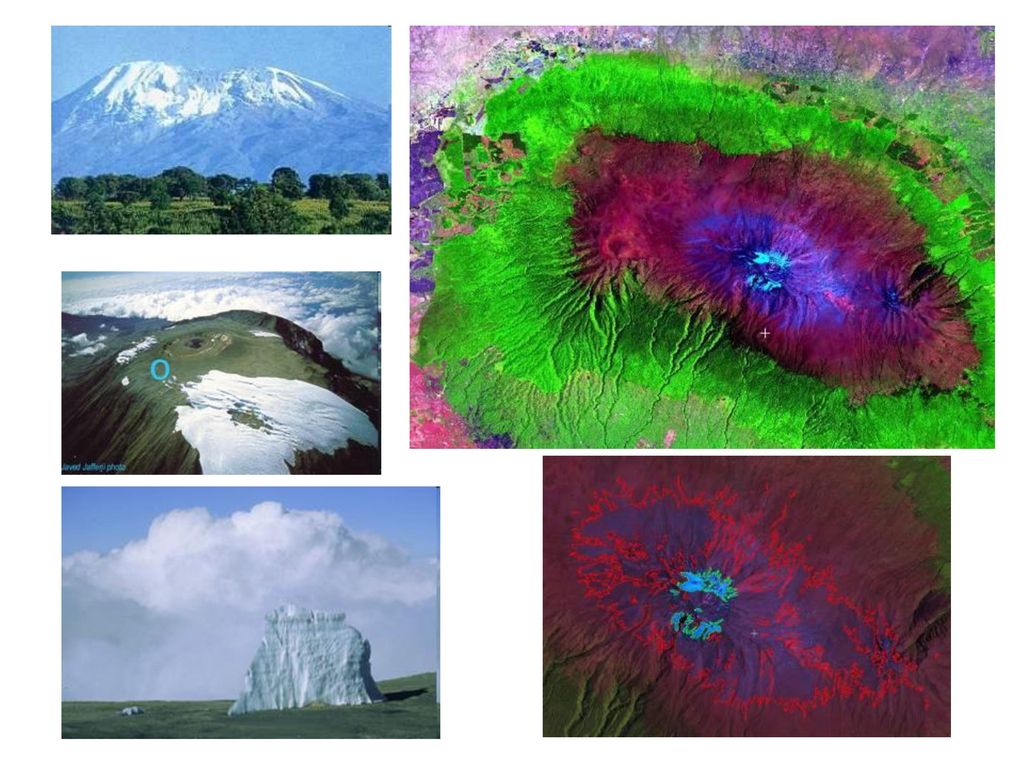
Kilimanjaro: 1993 and 2000: ice predicted to disappear 2030 Causes ? Global warming b. Lower precipitation c. Intensified land use

7
Illecillewaet Glacier, Glacier NP
1898

8
Capricorn Creek Landslide (Mount Meager)
Image taken September 14, 1988.

9
Capricorn Creek Landslide (Mount Meager)
Image taken September 6, 2014.

10
TERRA satellite 1999 Includes two sensors: MODIS and ASTER
MODIS- bands and applications (250 / 500 / 1000m) MODIS- sensing for global change research: Sample images:
 MODIS- sensing for global change research: Sample images:")
11
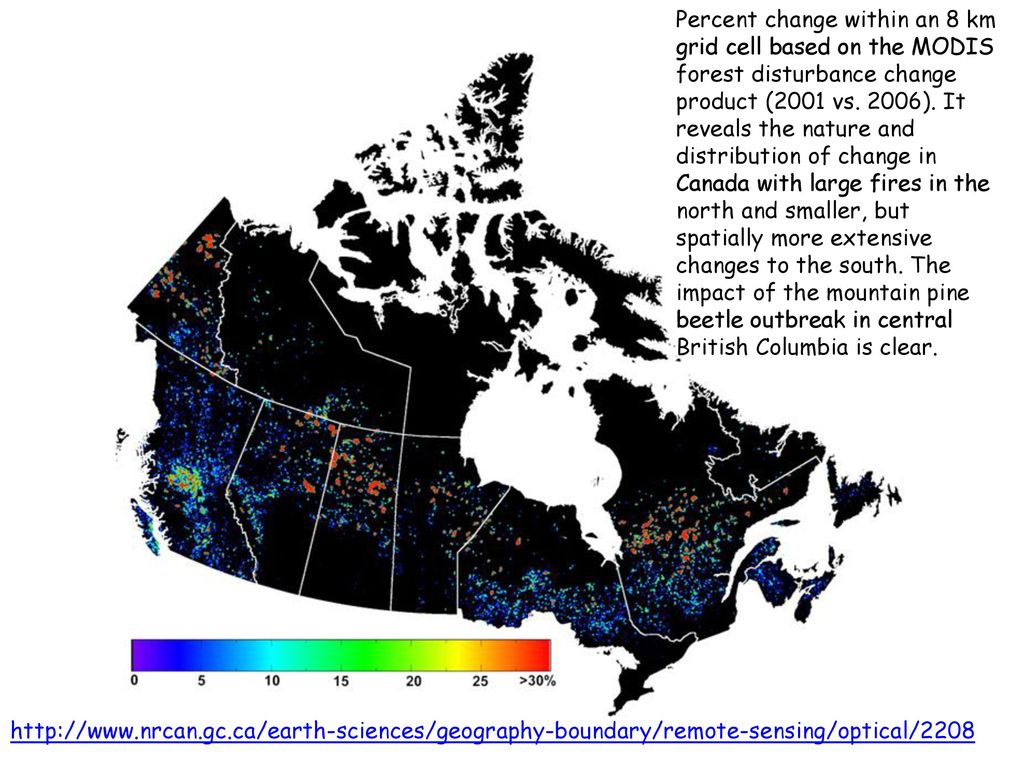
Percent change within an 8 km grid cell based on the MODIS forest disturbance change product (2001 vs. 2006). It reveals the nature and distribution of change in Canada with large fires in the north and smaller, but spatially more extensive changes to the south. The impact of the mountain pine beetle outbreak in central British Columbia is clear.
12
Mountain legacy project http://explore.mountainlegacy.ca

13
3D Visualisation of past and future change created from air photos, images and mapping
Glaciers and vegetation Glacier National Park (Montana) Animation:
 Animation:")
14
These images from the Advanced Land Imager (ALI) on NASA’s Earth Observing-1 (EO-1) satellite show Jakobshavn Glacier in July, 2001 and 2010.

15
The Glacier that sunk the Titanic … along with some British arrogance

16
Venice 2000-13: http://earthobservatory. nasa. gov/IOTD/view. php
Columbia Glacier:

17
Urban growth: Fort Worth 1974-1989-2003

18
Deforestation, Brazil 1986-2000

19
Three Gorges Dam, 2001-2003 http://asterweb. jpl. nasa
near Sandouping

20
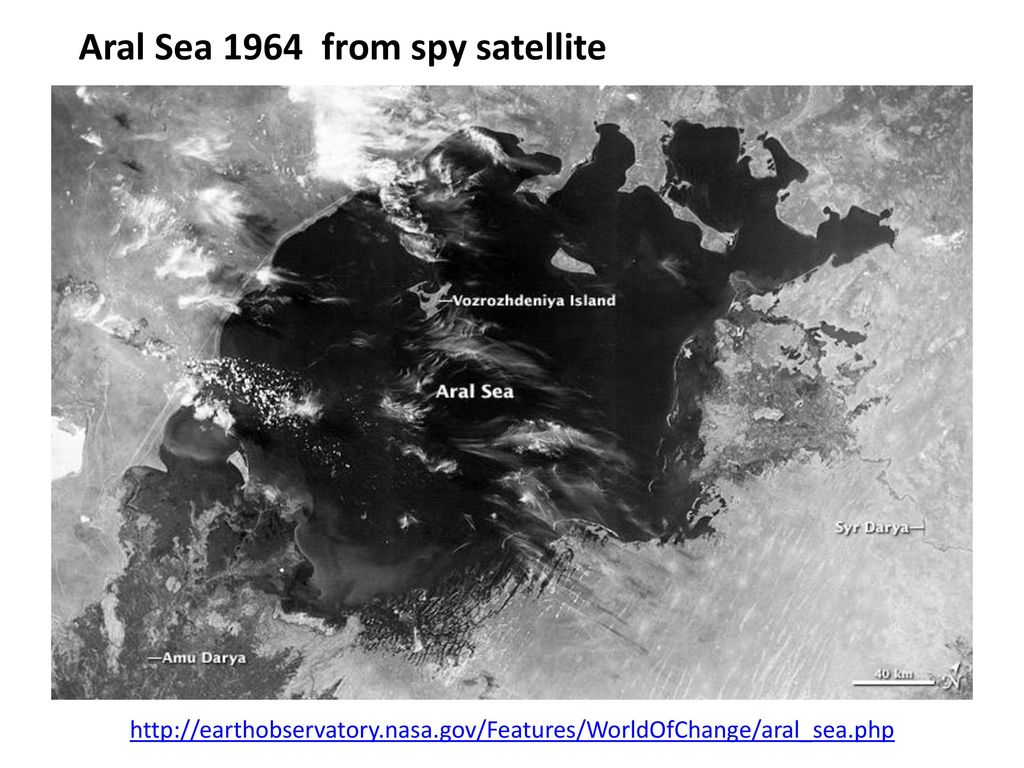
Aral Sea 1964 from spy satellite
21
Google Earth Time Lapse 1984-2012
29 years of Landsat images – 29 complete mosaics Visible bands only 53,000 images – 900 Terabytes of data 2 million hours total processing on 66,000 computers Parsed into 10 x 10 km areas

Similar presentations


 to very.>")
 – Air Quality.>")


: Fundamentals of Satellite Remote Sensing, Taylor and Francis Emilio Chuvieco and Alfredo Huete Fundamentals of Satellite Remote.>")