Download presentation
Presentation is loading. Please wait.

1
Modeling Digital Remote Sensing Presented by Rob Snyder

2
Scientists use remote sensors to detect different frequencies of electromagnetic radiation.

3
Satellites can detect a wide range of frequencies of electromagnetic radiation reflected or emitted from Earth’s surface. http://rst.gsfc.nasa.gov/Intro/Part2_1.html

4
Low resolution microwave instruments on satellites in polar orbits detect polar sea ice. Ice is represented as the color white in each 25 x 25 km pixel on this map. The ice layer is superimposed on a color satellite image. Total polar sea ice extent is calculated by adding the area of all pixels with ice concentrations of at least 15 percent. Source: http://earthobservatory.nasa.gov/Features/SeaIce/page2.phphttp://earthobservatory.nasa.gov/Features/SeaIce/page2.php

5
Low-flying aircraft flying carrying gamma radiation detectors fly across snow covered regions.

6
Detection of gamma radiation can determine the water content of snow cover on a large scale. Natural terrestrial gamma radiation is emitted from potassium, uranium, and thorium radioisotopes in the upper eight inches of soil. Snow cover blocks the terrestrial radiation signal in varying degrees. The difference between radiation measurements made over bare ground and snow covered ground is used to calculate snow water equivalents. Gamma radiation levels are calibrated using snow samples collected at different sites at ground level.

7
NOAA uses gamma ray detection data to produce snow water equivalent maps. Source: http://www.nohrsc.noaa.gov/nsa/http://www.nohrsc.noaa.gov/nsa/ Maps like this are used to predict river flooding due to rapid snow melt.

8
Reflected radio wave data can be used to generate “false color images” of precipitation and air circulation. Source: http://www.erh.noaa.gov/box/sigevents/jun01_2011_radarimages.phphttp://www.erh.noaa.gov/box/sigevents/jun01_2011_radarimages.php NOAA weather radar monitored Western Massachusetts tornadoes on June 1 st.

9
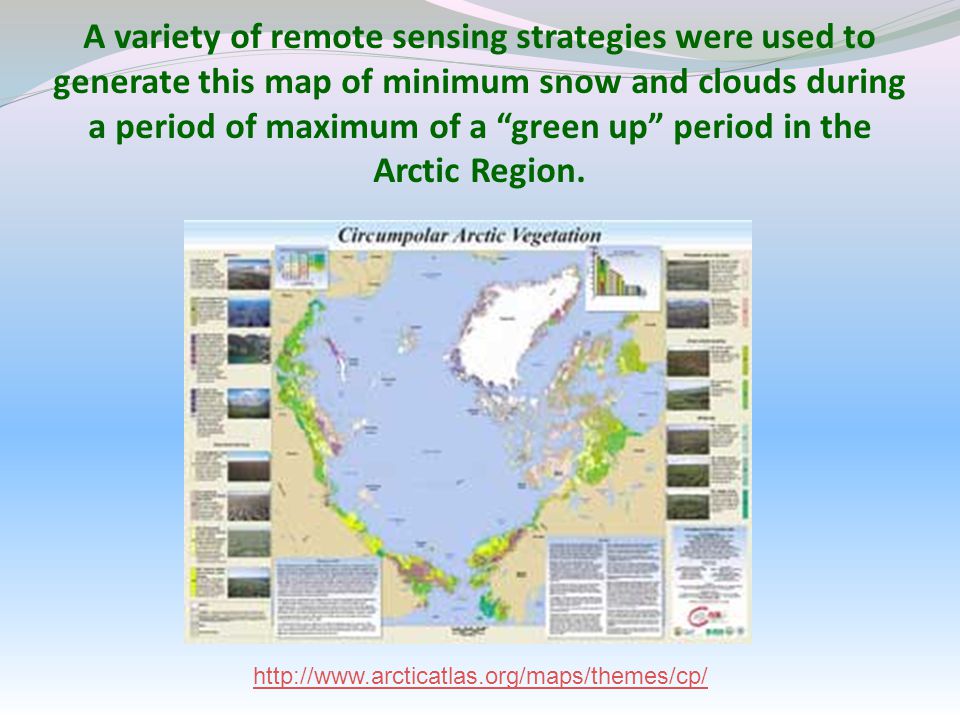
A variety of remote sensing strategies were used to generate this map of minimum snow and clouds during a period of maximum of a “green up” period in the Arctic Region. http://www.arcticatlas.org/maps/themes/cp/
10
Students can use a camera to model the process of the remote sensing of: Snow cover across North America Snow cover across North America Seasonal changes in vegetation Seasonal changes in vegetation Melting sea ice Melting sea ice Damage from a forest fire Damage from a forest fire The expansion of a city The expansion of a city

11
Students can use photographs of different colors of paper to model remote. The photograph can be uploaded onto a computer and analyzed with Analyzing Digital Images (ADI) software.
 software..")
12
A charge coupled-device (CCD) is located inside many digital cameras. A CCD has three types of detectors that detect light in the red, green, and blue visible portions of the electromagnetic spectrum.

13
ADI software has a “line tool” that draws a line across the different colors in a photograph.

14
ADI software can also produce a graph that reveals changes in intensities of red, green, and blue colors as the line crossed different colors in the photograph. Students could choose to work with several colors of paper that have distinctly different RGB signals.

15
This group of students chose to use blue, green, and white paper to represent the springtime “green- up” along the shore of an Arctic lake.

16
Each group would draw a number of parallel lines across the photograph.

17
An ADI graph of RGB intensities along a line can be used to determine the extent of each color along the line. The total length of the line is multiplied by percentage of the length attributed to each color.

18
Each group would compile the data in a format that can be used by another group to reconstruct what was mapped. Compiled data could then be traded among groups.

19
A Data Table can be constructed to indicate the distance of each color along the line Line Color and Distance 1Blue = 20 cmGreen = 19 cmWhite = 8.5 cm 2 etc, etc This example provides the colors that were used.

20
Another data table might only indicate RGB intensities for colors used by a group of students. Color 1Red = 38%Green = 36%Blue = 55% Color 2Red = 42%Green = 55%Blue = 40% Color 3Red = 93%Green = 85%Blue = 85% How would a group determine what colors were used?

21
Students can also design experiments to determine the resolution of a camera as remote sensor. Is there a third set of RGB squares?

22
Resources on the DIGITAL web site include: This PowerPoint. Students documents include strategies for modeling the remote sensing process and sample data tables. A teacher’s guide include STEM contexts and applicable national and state learning standards.

Similar presentations


 Collecting data directly at the site of scientific interest Ground stations on Earth.>")


 which was also the beginning.>")
