Download presentation
Presentation is loading. Please wait.

1
Pathophysiology of Brain & Body - USSJJQ-20-3 Introduction 2015/16

2
Staff Dr Rosie Jones (Bristol U/S’mead H) Dr Bahareh Vahabi (UWE) Dr Lynne Lawrance (UWE) Me (Dave Lush)
 Dr Bahareh Vahabi (UWE) Dr Lynne Lawrance (UWE) Me (Dave Lush)")
3
Support http://www.rags.profile.ac.uk/DL/ (link also in Blackboard) @UWE_JJQ Exams drawn from question-bank Tutorial support for exam ‘Skim-feedback’ of draft answers, if possible

4
Delivery Patterns ‘The half-flipped classroom’ HCS students Sem 1: 2h lecture + 1h ‘tutorial’ on previously- viewed 2h screencast non-HCS students Sem 1: 2h lecture Sem 2: 1h ‘tutorial’ on previously-viewed 2h screencast

5
Assessment 60% Exam (3 from 6Q, 3h) HCS – Jan; non-HCS - May 40% CW (2 essays) HCS - (weeks 15 and 19) – TBC non-HCS - (weeks 19 and 33) – TBC
 HCS – Jan; non-HCS - May 40% CW (2 essays) HCS - (weeks 15 and 19) – TBC non-HCS - (weeks 19 and 33) – TBC")
6
Pathophysiology “The study of the nature of suffering” “Life is hard, then you die.” “It’s not that I’m afraid to die. I just don’t want to be there when it happens.” “Live each day as if it’s your last, because one day you will be right.” “I don’t want to live forever, I just want to live to see the end of the DFS sale.”

7
Proposed Syllabus Lectures (Sem 1) Intro: Global View Neuroanatomy CNS Disorders 1 CNS Disorders 2 Drugs of Abuse 1 Drugs of Abuse 2 Dementias 1 Drugs of Abuse 3 Coursework tutorial? Respiratory Infections Dementias 2 Inborn Errors Screencasts/tutorials (Sem 1 or 2) Blood Pressure Regulation Hypertension Atherosclerosis Coronary Heart Disease/Stroke Heart Failure Diabetes 1 Diabetes 2 Respiratory: COPD Respiratory: Asthma Renal Failure Review?
 Blood Pressure Regulation Hypertension Atherosclerosis Coronary Heart Disease/Stroke Heart Failure Diabetes 1 Diabetes 2 Respiratory: COPD Respiratory: Asthma Renal Failure Review .")
8
Death rate… http://www.indexmundi.com/g/g.aspx?v=25&c=xx&l=en

9
Birth rate… http://www.indexmundi.com/g/g.aspx?v=25&c=xx&l=en

10
HEALTH STATISTICS AND INFORMATION SYSTEMS 10 | Deaths and Distribution of Age at Death, World, 2012 0-4 years: 6.6 million (12%) 30-69 years: 19.9 million (36%) 5-14 years: 1.4 million (3%) 70 years and over: 25.1 million (45%) Total number of deaths: 55.9 million 15-29 years: 2.9 million (5%) http://www.who.int/entity/healthinfo/global_burden_disease/GHE_key_FiguresTables.ppt?ua=1
 years: 19.9 million (36%) 5-14 years: 1.4 million (3%) 70 years and over: 25.1 million (45%) Total number of deaths: 55.9 million years: 2.9 million (5%) ua=1")
11
How everyone dies (56m in 2012)… http://www.who.int/mediacentre/factsheets/fs310/en/
…")
12
How we die (high income)… http://www.who.int/mediacentre/factsheets/fs310/en/
…")
13
How others die (low income)… http://www.who.int/mediacentre/factsheets/fs310/en/
…")
14
How we got to die differently (20 th cent) http://www.ons.gov.uk/o ns/rel/hsq/health- statistics-quarterly/no-- 18--summer- 2003/twentieth-century- mortality-trends-in- england-and-wales.pdf
 ns/rel/hsq/health- statistics-quarterly/no summer- 2003/twentieth-century- mortality-trends-in- england-and-wales.pdf")
15
How we got to die differently (20 th cent) http://www.ons.gov.uk/ons/rel/hsq/health-statistics-quarterly/no--18--summer- 2003/twentieth-century-mortality-trends-in-england-and-wales.pdf
 /twentieth-century-mortality-trends-in-england-and-wales.pdf")
16
Death by broad cause/region/year… http://apps.who.int/gho/data/view.wrapper.MGHEREGIONv?lang=en

17
Death by broad cause/region, 2000 Injuries Noncommunicable conditions Communicable diseases, maternal and perinatal conditions and nutritional deficiencies AFR EMREURSEARWPR AMR 25 50 75 % Source: WHO, World Health Report 2001

18
Death by broad cause/region, 2000 Injuries Noncommunicable conditions Communicable diseases, maternal and perinatal conditions and nutritional deficiencies AFR EMREURSEARWPR AMR 25 50 75 % Source: WHO, World Health Report 2001

19
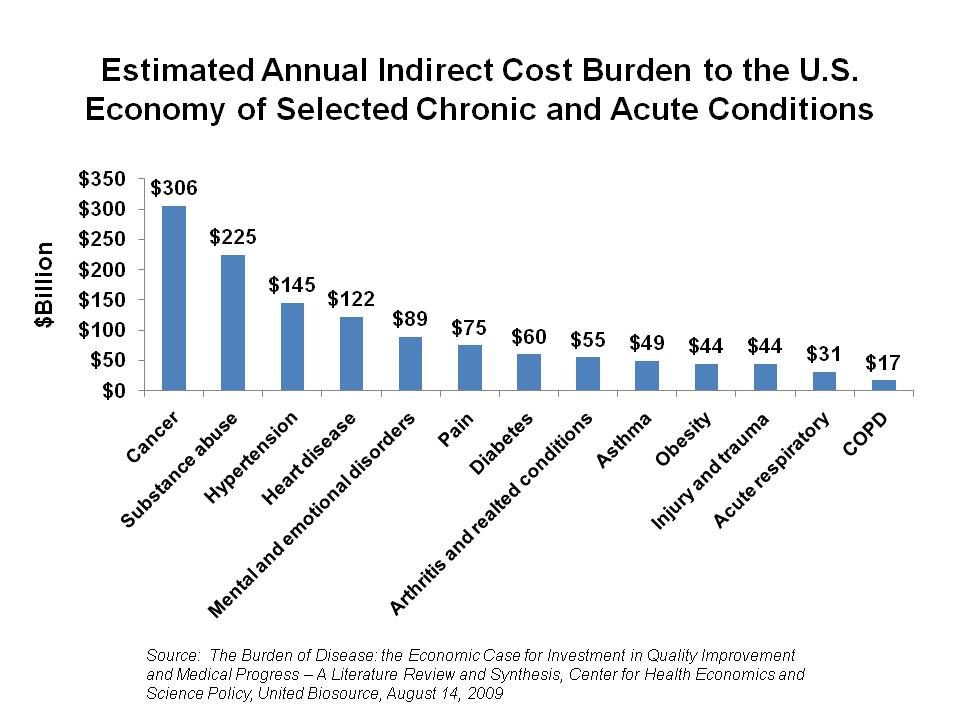
The ‘Burden’ of Disease The high death toll associated with disease is not the whole story At any one time, hundreds of millions of people worldwide are… requiring treatment recovering permanently disabled Developing world – communicable disease Developed world – diseases of affluence Beyond the burden of personal suffering, society also ‘suffers’ Economic impact of repeated episodes of illness and long-term disability is substantial

20
Global Burden of Disease (WHO) Comprehensive and comparable assessment of mortality and loss of health due to diseases, injuries and risk factors for all regions of the world. Assessed using the disability-adjusted life year (DALY), a time-based measure that combines years of life lost (YLL) due to premature mortality years of ‘healthy’ life lost due to time lived in states of less than full health, but not dead
, a time-based measure that combines years of life lost (YLL) due to premature mortality years of ‘healthy’ life lost due to time lived in states of less than full health, but not dead.")
21
http://www.who.int/gho/mortality_burden_disease/regions/mbd_006.jpg?ua=1

22
http://apps.who.int/iris/bitstream/10665/112738/1/9789240692671_eng.pdf?ua=1

23
Health Statistics and Informatics Comparison of the proportional distribution of deaths and YLL by leading cause of death, 2004

25
Health Statistics and Informatics Leading Causes of Mortality and Burden of Disease world, 2004 % 1.Ischaemic heart disease 12.2 2.Cerebrovascular disease 9.7 3.Lower respiratory infections 7.1 4.COPD 5.1 5.Diarrhoeal diseases 3.7 6.HIV/AIDS 3.5 7.Tuberculosis 2.5 8.Trachea, bronchus, lung cancers 2.3 9.Road traffic accidents 2.2 10.Prematurity, low birth weight 2.0 % 1.Lower respiratory infections 6.2 2.Diarrhoeal diseases 4.8 3.Depression4.3 4.Ischaemic heart disease 4.1 5.HIV/AIDS3.8 6.Cerebrovascular disease 3.1 7.Prematurity, low birth weight 2.9 8.Birth asphyxia, birth trauma 2.7 9.Road traffic accidents 2.7 10.Neonatal infections and other 2.7 MortalityDALYs

26
Risk Factors and % Mortality Maternal and Childhood Under-nutrition derived from http://www.who.int/entity/healthinfo/global_burden_disease/CRA_Dth_inc_2004.xls?ua=1 http://www.who.int/entity/healthinfo/global_burden_disease/CRA_Dth_inc_2004.xls?ua=1

27
Risk Factors and % Mortality Other nutrition-related risk factors & physical activity

28
Risk Factors and % Mortality Addictive substances

29
Risk Factors and % Mortality Environmental risks

30
Risk Factors and % Mortality Unsafe sex

31
Mortality in Developed Countries Inactivity, obesity, glucose, cholesterol, blood pressure, tobacco, air pollution Major determinants relate to Eating, Drinking and Moving Diet and physical activity key determinants of public health in developed countries! Long-term influence chronic conditions In developed countries chronic diseases of affluence >> communicable diseases eg cardiovascular disease…

32
CVD Deaths by Region, 2000 (WHO) Strokes Heart attacks AFR EMREURSEARWPR AMR 10 20 30 % Deaths Source: WHO, World Health Report 2001
 Strokes Heart attacks AFR EMREURSEARWPR AMR % Deaths Source: WHO, World Health Report 2001")
33
Developing Countries Circa 7 billion people in world 5.75 billion live in developing countries Disease does not recognise national borders, but… Pattern of disease influenced by… Geographical/Environmental factors Socio-political factors (inc GDP) Population age distributions
 Population age distributions")
34
Population Age Distributions Developing countries are ‘young’ increased early mortality high YLL

35
HEALTH STATISTICS AND INFORMATION SYSTEMS 35 | Distribution of Age at Death by WHO Region and World Bank Income Categories, 2012 42% 69% http://www.who.int/entity/healthinfo/global_burden_disease/GHE_key_FiguresTables.ppt?ua=1

36
Revisit - (How we got to die differently) http://www.ons.gov.uk/ons/rel/hsq/health-statistics-quarterly/no--18--summer- 2003/twentieth-century-mortality-trends-in-england-and-wales.pdf
 /twentieth-century-mortality-trends-in-england-and-wales.pdf")
37
Socio-political: Health & Wealth 1/3 of World population live on <$1 per day more than 2 billion people 1/3 children are malnourished 1/5 not fully immunised by their first birthday 1/3 lack access to essential drugs Mass population movements disrupt healthcare 2014, UNHCR 50m forced displacements Densely populated cities with unsafe water and poor sanitation Generally do not apply to developed world so what drives mortality in developed countries?

38
Lifestyle & Mortality in Developed Countries Major determinants relate to Eating, Drinking and Moving – ie Lifestyle mainly diet and physical (in)activity Up to 80 % of coronary heart disease and up to 90 % of type 2 diabetes ‘avoidable’ through changing lifestyle factors? About 1/3rd of cancers might be prevented by healthy eating? maintaining normal weight? physical activity throughout the life span? Control of communicable diseases plus time needed to develop chronic disease different age distribution of disease burden…

39
Health Statistics and Informatics Age distribution of burden of disease by income group, 2004

40
Adult Mortality by Cause & Region, 2004 http://www.who.int/healthinfo/global_burden_disease/GBD_report_2004update_part2.pdf?ua=1

41
Child Mortality by Cause & Region, 2004

42
The Role of Communicable Diseases Worldwide, infections are biggest killers of children/young adults (WHO) ~13 million deaths per year 1,500 die per hour 1/2 under five years old Also, chronic diseases (inc cancers) linked to infection (not necessarily chronic)
 ~13 million deaths per year 1,500 die per hour 1/2 under five years old Also, chronic diseases (inc cancers) linked to infection (not necessarily chronic)")
43
Communicable Diseases in Developed Countries Under-vaccination outbreaks 1996 polio epidemic in Greece and Albania MMR avoidance in UK Increased drug resistance eg TB Emergence of new pathogenic strains eg bird flu Air travel/immigration facilitate transport of infections eg Ebola A different picture in developing countries…

44
Health Statistics and Informatics Distribution of child deaths for selected causes by selected WHO region, 2004

45
Childhood (<5yrs) Deaths – Trends http://www.who.int/immunization/diseases/tetanus/lancet-2012-global-child-mortality.pdf?ua=1
 Deaths – Trends ua=1")
46
Communicable Disease – Major Culprits Six diseases cause 90% of infectious disease deaths (all ages) HIV Pneumonia Tuberculosis Diarrhoeal disease Malaria Measles
 HIV Pneumonia Tuberculosis Diarrhoeal disease Malaria Measles")
47
HIV Human Immunodeficiency Virus (HIV) Attacks cells of the immune system increased susceptible to other infections Major cause of death is TB Estimated 34 million people living with AIDS does that include HIV positive? 23.5 million people in Africa are infected 3x increase in China and E Europe since 2000 Circa 2.5 million new infections and 1.7 million deaths from HIV (2011) http://www.unaids.org/en/media/unaids/contentassets/documents/epidemiology/2012/gr2012/201 21120_UNAIDS_Global_Report_2012_with_annexes_en.pdf
 _UNAIDS_Global_Report_2012_with_annexes_en.pdf.")
48
Pneumonia The leading cause of child death worldwide children of low birth weight those with immune systems damaged by malnutrition etc Many causes are treatable or preventable Virtually all childhood deaths from pneumonia occur in developing countries 2,000,000 vs 1,000 http://www.who.int/mediacentre/factsheets/fs331/en/ http://whqlibdoc.who.int/publications/2006/9280640489_eng.pdf?ua=1

49
Tuberculosis Spread in droplets coughing, sneezing, speaking, kissing, spitting Someone with active TB may infect 10-15 people per year “At risk” populations… areas where TB is common drug users health-care workers (inc drug-care) People who are immunosuppressed
 People who are immunosuppressed")
50
Diarrhoea > 2 million deaths per year, mostly children lower than before (now saved by oral rehydration therapy) Leads to rapid fluid loss and death Colitis, pneumonia, sepsis, hypoglycaemia, hypokalaemia 1.5 billion bouts of illness a year in children alone Multiple causes… viruses (eg rotavirus), bacteria (eg campylobacter, salmonella, cholera, shigella) parasites (eg. Entamoeba) Cholera and dysentery (shigella) affect adults as well as children Typhoid and rotavirus mainly affect children Burden is highest in areas with poor sanitation
 Cholera and dysentery (shigella) affect adults as well as children Typhoid and rotavirus mainly affect children Burden is highest in areas with poor sanitation.")
51
Malaria Vector borne infectious disease Transmitted by female Anopheles mosquito Caused by protozoan parasites Very common infectious disease No vaccine available Treated with derivatives of quinine or artemisinin drug resistance, worryingly, is increasing Estimated 216 million episodes in 2010 81% in African region Estimated 655,000 deaths in 2010 90% in Africa 86% children < 5 years

52
Measles (Rubeola) Possibly the most contagious human disease 2008: 164,000 deaths Prior to 1980, ~2,600,000 deaths (before global vaccination push) Rubeola virus directly responsible for more child deaths than any other single microorganism (but didn’t I say pneumonia biggest child killer?) Also causes blindness, deafness, brain and lung damage, stunted growth and development Societal ‘burden’
 Possibly the most contagious human disease 2008: 164,000 deaths Prior to 1980, ~2,600,000 deaths (before global vaccination push) Rubeola virus directly responsible for more child deaths than any other single microorganism (but didn’t I say pneumonia biggest child killer ) Also causes blindness, deafness, brain and lung damage, stunted growth and development Societal ‘burden’")
53
Global Trends

54
Health Statistics and Informatics Global projections for selected causes, 2004 to 2030 Updated from Mathers and Loncar, PLoS Medicine, 2006 Cancers Stroke Perinatal Road traffic accidents HIV/AIDS TB Malaria Acute respiratory infections Ischaemic HD

55
Health Statistics and Informatics Projected deaths by cause and income, 2004 to 2030 HIV, TB, malaria Other infectious Mat//peri/nutritional CVD Cancers Other NCD Road traffic accidents Other unintentional Intentional injuries

56
Health Statistics and Informatics Ten leading causes of burden of disease, world, 2004 and 2030

57
Prevalence of Diabetes in Adults (millions of people, by WHO Region) Source: World Health Report, 1997
 Source: World Health Report, 1997")
58
So, a good time to be alive? Yes! 3000 BC - 18 years 275 BC - 26 years 1900 AD - 49 years 1980 AD - 76 years 2002 AD - 85 years 2020 AD - ?? years

59
Female Life Expectancy; selected countries

Similar presentations


 Disease- a disordered or incorrectly functioning organ, part, structure, or system of.>")


