Download presentation
Presentation is loading. Please wait.

1
Great Graphs!!!!! Or … How to Impress Math and Science Teachers Or … How to Impress Math and Science Teachers

2
Bar or Line? / One of the first things one needs to do when graphing is decide whether to make a bar graph or a line graph.

3
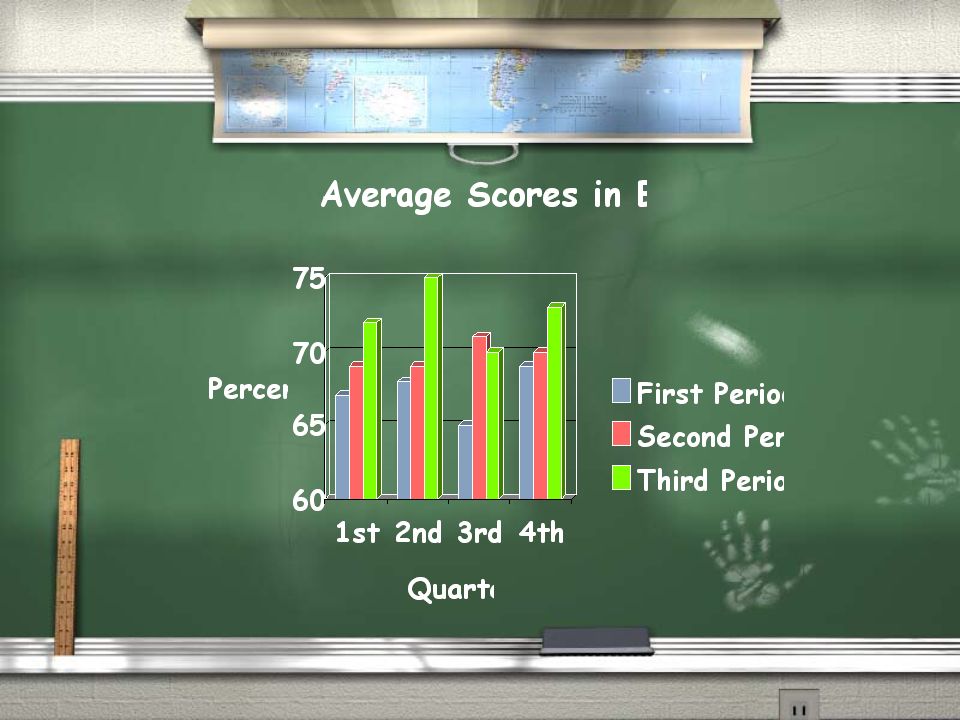
Bar Graphs are used for comparing

4
Line graphs are used for showing trends

5
Line graphs also show relationships

6
Remember / TAILS / DRY / MIX / TAILS / DRY / MIX

7
TAILS / T is for Title

9
TAILS / A is for Axis

11
TAILS / I is for Interval

13
TAILS / L is for Label

15
TAILS / S is for Scale

17
Remember that A was for Axis??? When figuring out what goes on which axis remember: DRY MIX When figuring out what goes on which axis remember: DRY MIX

18
DRY / DRY means that the: / Dependent or / Responding variable belongs on the / Y-axis / DRY means that the: / Dependent or / Responding variable belongs on the / Y-axis

20
MIX / MIX means that the: / Manipulated or / Independent variable belongs on the / X-axis / MIX means that the: / Manipulated or / Independent variable belongs on the / X-axis

Similar presentations


>")


 If time is present, it is usually ALWAYS.>")

 Horizontal D – dependent R – responding.>")


