Download presentation
Presentation is loading. Please wait.

1
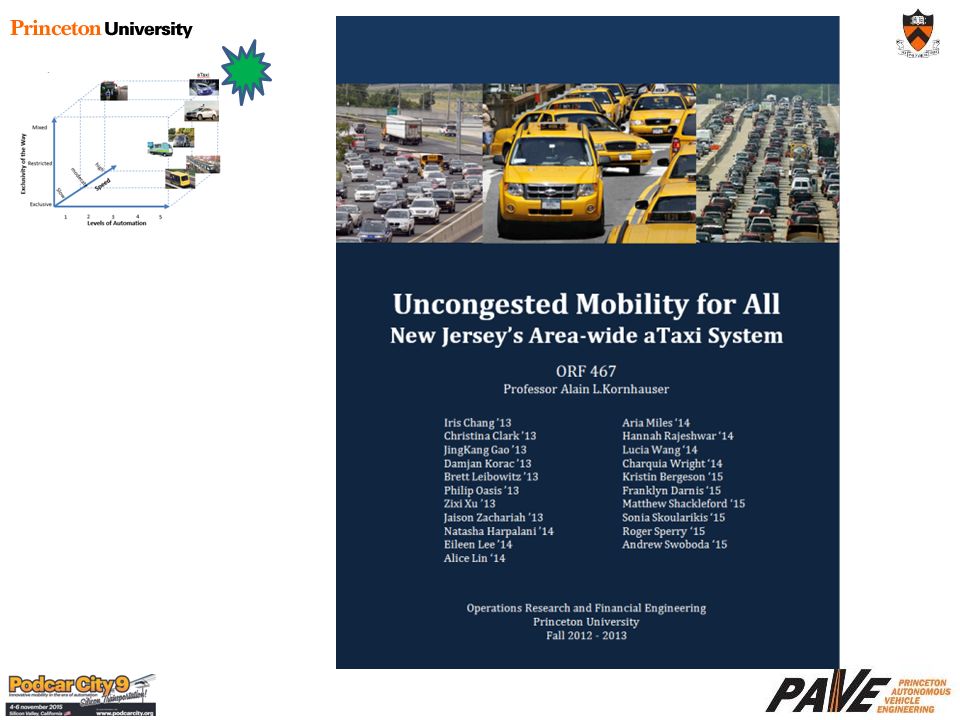
by Alain L. Kornhauser, PhD Professor, Operations Research & Financial Engineering Director, Program in Transportation Faculty Chair, PAVE (Princeton Autonomous Vehicle Engineering) Princeton University Board Chair, Advanced TRansit Association Presented at Podcar City 9 Silicon Valley, CA November 6, 2015 Driverless Transit on Guideways and Roads
 Princeton University Board Chair, Advanced TRansit Association Presented at Podcar City 9 Silicon Valley, CA November 6, 2015 Driverless Transit on Guideways and Roads.")
2
Levels of Automation 1 2 3 4 5 Exclusivity of the Way Speed Slow moderate high Exclusive Mixed Restricted Scope of Vehicle Automation

3
Levels of Automation 1 2 3 4 5 Exclusivity of the Way Speed Slow moderate high Exclusive Mixed Restricted Scope of Vehicle Automation aTaxi

4
The Business Case

5
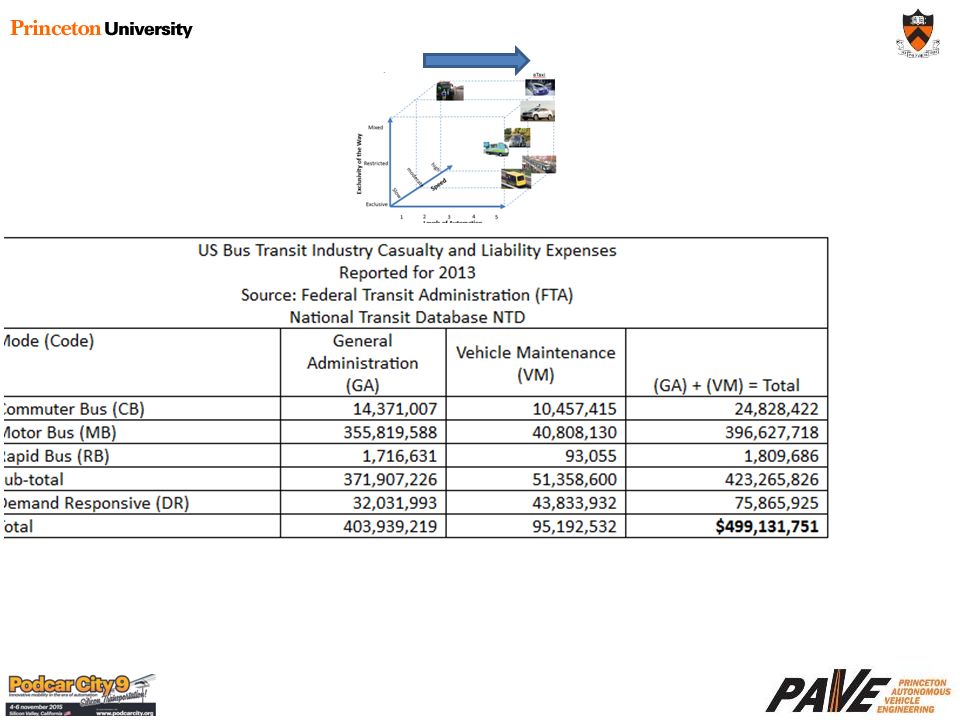
Terrible News! Claims are going through the roof!

6
2011 Nationwide Bus Casualty and Liability Expense Source FTA NTD Casualty and Liability Amount Vehicle- related $483,076,010. Total Buses 59,871 Sub-Total Casualty and Liability Amount Per Bus $8,069/Bus/Year

8
Key Business Model Cost of Active Collision Avoidance < Present Value {Expected Liability Savings over life of bus}

9
Liability Savings pay Cash for the Technology, and… “half” of the following come for FREE!

10
Think About… +

11
+ + Enormous Extended Reach

12
Think About… + Inexpensive Guideway + Inexpensive vehicles Great way to get started

13
Think About… + + Enormous Extended Reach

15
By walking to a station/aTaxiStand – At what point does a walk distance make the aTaxi trip unattractive relative to one’s personal car? – ¼ mile ( 5 minute) max Like using an Elevator! “NJ Transit aTaxis” Service Model Elevator
 max Like using an Elevator. NJ Transit aTaxis Service Model Elevator.")
16
By walking to a station/aTaxiStand – A what point does a walk distance makes the aTaxi trip unattractive relative to one’s personal car? – ¼ mile ( 5 minute) max By using the rail system for some trips – Trips with at least one trip-end within a short walk to a train station. – Trips to/from NYC or PHL Spatial Aggregation
 max By using the rail system for some trips – Trips with at least one trip-end within a short walk to a train station. – Trips to/from NYC or PHL Spatial Aggregation.")
17
By walking to a station/aTaxiStand – A what point does a walk distance makes the aTaxi trip unattractive relative to one’s personal car? – ¼ mile ( 5 minute) max By using the rail system for some trips – Trips with at least one trip end within a short walk to a train station. – Trips to/from NYC or PHL By sharing rides with others that are basically going in my direction – No trip has more than 20% circuity added to its trip time. Spatial Aggregation
 max By using the rail system for some trips – Trips with at least one trip end within a short walk to a train station. – Trips to/from NYC or PHL By sharing rides with others that are basically going in my direction – No trip has more than 20% circuity added to its trip time. Spatial Aggregation.")
18
Pixelation of New Jersey NJ State Grid Zoomed-In Grid of Mercer

19
Stands are conveniently located about ½ mile appart Stands are conveniently located about ½ mile appart xPixel = floor{108.907 * (longitude + 75.6)} yPixel = floor{138.2 * (latitude – 38.9)) xPixel = floor{108.907 * (longitude + 75.6)} yPixel = floor{138.2 * (latitude – 38.9))
} yPixel = floor{138.2 * (latitude – 38.9)) xPixel = floor{ * (longitude )} yPixel = floor{138.2 * (latitude – 38.9))")
20
O O D P1P1 An aTaxiTrip

21
P1P1 O Common Destination (CD) CD=1p: Pixel -> Pixel (p->p) Ride-sharing Common Destination (CD) CD=1p: Pixel -> Pixel (p->p) Ride-sharing TripMiles = L TripMiles = 2L TripMiles = 3L
 CD=1p: Pixel -> Pixel (p->p) Ride-sharing Common Destination (CD) CD=1p: Pixel -> Pixel (p->p) Ride-sharing TripMiles = L TripMiles = 2L TripMiles = 3L")
22
P1P1 O PersonMiles = 3L aTaxiMiles = L AVO = PersonMiles/aTaxiMiles = 3 PersonMiles = 3L aTaxiMiles = L AVO = PersonMiles/aTaxiMiles = 3

23
NJ Transit Train Station “Consumer-shed” NJ Transit Train Station “Consumer-shed”

24
D a PersonTrip from NYC (or PHL or any Pixel containing a Train station) a PersonTrip from NYC (or PHL or any Pixel containing a Train station) NYC O Princeton Train Station NJ Transit Rail Line to NYC, next Departure aTaxiTrip An aTaxiTrip {oYpixel, oXpixel, TrainArrivalTime, dYpixel, dXpixel, Exected: dTime} An aTaxiTrip {oYpixel, oXpixel, TrainArrivalTime, dYpixel, dXpixel, Exected: dTime}
 a PersonTrip from NYC (or PHL or any Pixel containing a Train station) NYC O Princeton Train Station NJ Transit Rail Line to NYC, next Departure aTaxiTrip An aTaxiTrip {oYpixel, oXpixel, TrainArrivalTime, dYpixel, dXpixel, Exected: dTime} An aTaxiTrip {oYpixel, oXpixel, TrainArrivalTime, dYpixel, dXpixel, Exected: dTime}")
25
P2P2 P1P1 O CD= 2p: Pixel ->2Pixels Ride-sharing

26
P1P1 P3P3 O P2P2 CD= 3p: Pixel ->3Pixels Ride-sharing; P 2 New

27
Elevator Analogy of an aTaxi Stand Temporal Aggregation Departure Delay: DD = 300 Seconds Elevator Analogy of an aTaxi Stand Temporal Aggregation Departure Delay: DD = 300 Seconds Kornhauser Obrien Johnson 40 sec Henderson Lin 1:34 Popkin 3:47

28
Samuels 4:50 Henderson Lin Young 0:34 Popkin 2:17 Elevator Analogy of an aTaxi Stand 60 seconds later Elevator Analogy of an aTaxi Stand 60 seconds later Christie Maddow 4:12

29
“Last Mile” Impact on NJ Transit Rail (Today: 281,576, +537% ! )
")
30
Typical Daily NJ-wide AVO CD: Common Destinations; DD: Departure Delay (in Seconds) Typical Daily NJ-wide AVO CD: Common Destinations; DD: Departure Delay (in Seconds)
 Typical Daily NJ-wide AVO CD: Common Destinations; DD: Departure Delay (in Seconds)")
31
Typical Daily NJ-wide AVO CD: Common Destinations; DD: Departure Delay (in Seconds) Typical Daily NJ-wide AVO CD: Common Destinations; DD: Departure Delay (in Seconds)
 Typical Daily NJ-wide AVO CD: Common Destinations; DD: Departure Delay (in Seconds)")
32
Typical Daily NJ-wide AVO CD: Common Destinations; DD: Departure Delay (in Seconds) Typical Daily NJ-wide AVO CD: Common Destinations; DD: Departure Delay (in Seconds)
 Typical Daily NJ-wide AVO CD: Common Destinations; DD: Departure Delay (in Seconds)")
33
Typical Daily NJ-wide AVO CD: Common Destinations; DD: Departure Delay (in Seconds) Typical Daily NJ-wide AVO CD: Common Destinations; DD: Departure Delay (in Seconds)
 Typical Daily NJ-wide AVO CD: Common Destinations; DD: Departure Delay (in Seconds)")
34
Typical Daily NJ-wide AVO CD: Common Destinations; DD: Departure Delay (in Seconds) Typical Daily NJ-wide AVO CD: Common Destinations; DD: Departure Delay (in Seconds)
 Typical Daily NJ-wide AVO CD: Common Destinations; DD: Departure Delay (in Seconds)")
35
Typical Daily NJ-wide AVO CD: Common Destinations; DD: Departure Delay (in Seconds) Typical Daily NJ-wide AVO CD: Common Destinations; DD: Departure Delay (in Seconds)
 Typical Daily NJ-wide AVO CD: Common Destinations; DD: Departure Delay (in Seconds)")
36
Mercer County Pixel {200,103} Princeton ItemValue Activity Locations 57 Employment1,336 Population1,062 School Enrollment 0 Work School Home (Block Centroid ) Pixel Centroid
 Pixel Centroid")
37
2-pax aTaxis 15-pax aTaxis 6-pax aTaxis

38
What about the whole country?

39
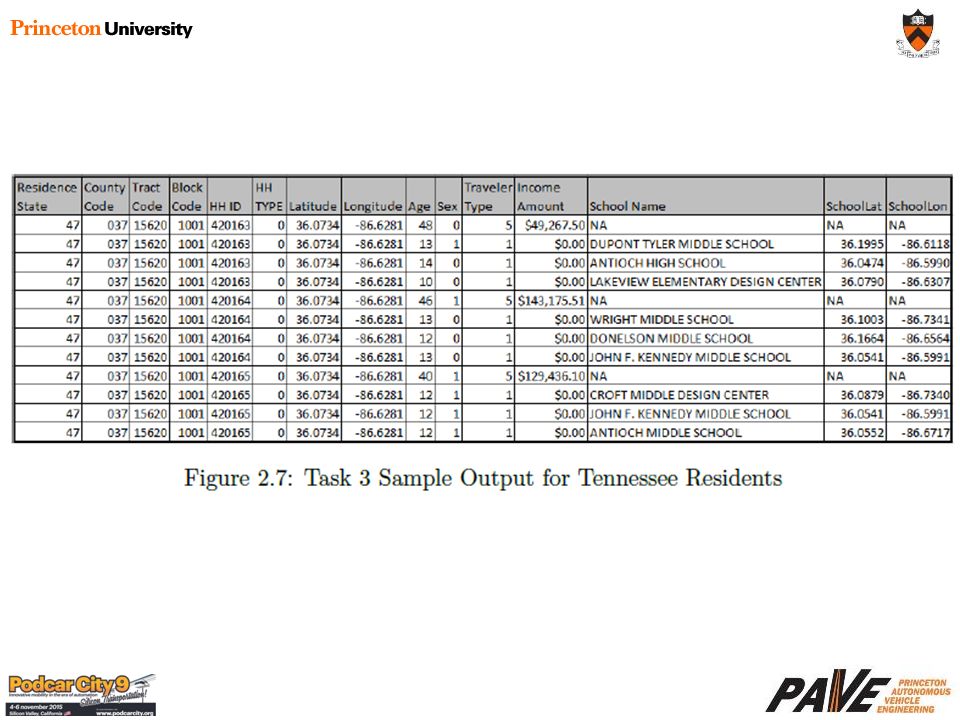
Public Schools in the US

40
Nation-Wide Businesses RankState Sales VolumeNo. Businesses 1California$1,8891,579,342 2Texas$2,115999,331 3Florida$1,702895,586 4New York$1,822837,773 5Pennsylvania$2,134550,678 9New Jersey$1,919428,596 45Washington DC$1,31749,488 47Rhode Island$1,81446,503 48North Dakota$1,97844,518 49Delaware$2,10841,296 50Vermont$1,55439,230 51Wyoming$1,67935,881 13.6 Million Businesses {Name, address, Sales, #employees}

41
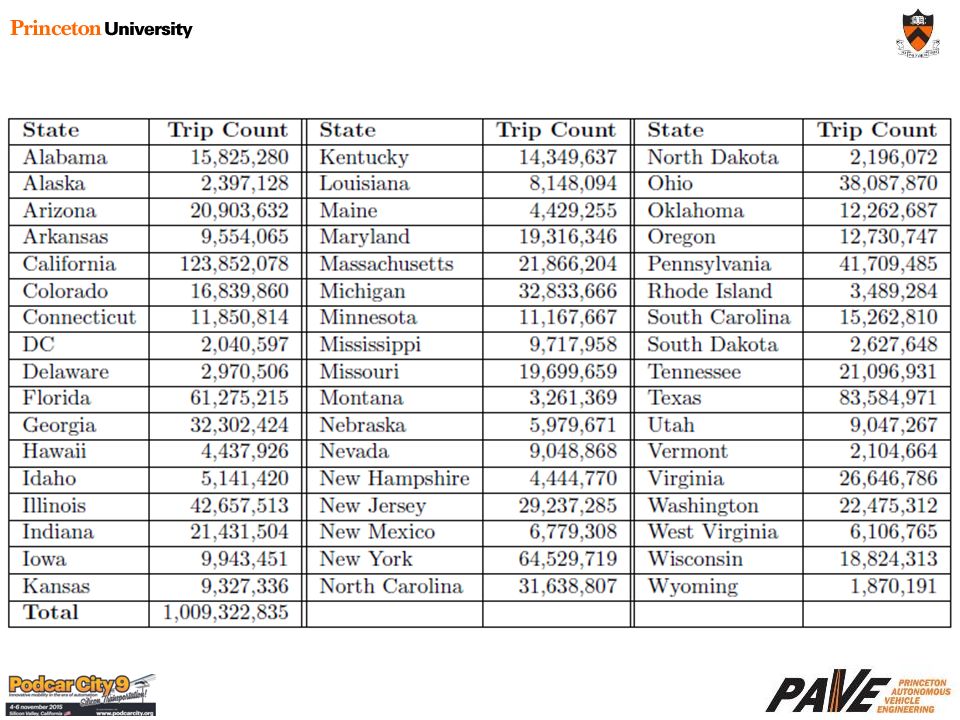
US_PersonTrip file will have.. 308,745,538 records – One for each person in US_Resident file Specifying 1,009,332,835 Daily Person Trips – Each characterized by a precise {oLat, oLon, oTime, dLat, dLon, Est_dTime} Will Perform Nationwide aTaxi AVO analysis Results ????

42
Thank You alaink@princeton.edu www.SmartDrivingCar.com Discussion!

47
Manhattan (New York County) Simulated population of 1,585,873 residents 8,085,055 trips originatewithin Manhattan 52,759,156 person-trip miles for Manhattan oTrips 3,010,666 unique travelers (1,424,793 non- resident travelers – Commuters) Mean Trip Length = 6.53 miles; Median Trip Length = 3.31 miles Interesting differences between commuter and resident population traveling through Manhattan
 Simulated population of 1,585,873 residents 8,085,055 trips originatewithin Manhattan 52,759,156 person-trip miles for Manhattan oTrips 3,010,666 unique travelers (1,424,793 non- resident travelers – Commuters) Mean Trip Length = 6.53 miles; Median Trip Length = 3.31 miles Interesting differences between commuter and resident population traveling through Manhattan")
48
Trip Files are Available If You want to Play

49
Thank You alaink@princeton.edu www.SmartDrivingCar.com Discussion!

Similar presentations


: 130 Census Blocks: 8,751 Hudson Population: 634,266 Area (square.>")


