Download presentation
Presentation is loading. Please wait.

1
Efforts to Advance SmartDrivingCars In New Jersey
by Alain L. Kornhauser, PhD Professor, Operations Research & Financial Engineering Director, Program in Transportation Faculty Chair, PAVE (Princeton Autonomous Vehicle Engineering) And Chenyi Chen PhD Student, Operations Research & Financial Engineering Princeton University Presented at 3rd Symposium on Connected & Autonomous Vehicles Albany, NY Nov. 5, 2014
 And. Chenyi Chen. PhD Student, Operations Research & Financial Engineering. Princeton University. Presented at. 3rd Symposium on Connected & Autonomous Vehicles. Albany, NY. Nov. 5,")
2
Outline (what I’m involved with )
Still Waiting (Federal Transit $5M grant: Transit Bus Collision Avoidance) Effort to Establish “Center for Research, Certification & Commercialization of Automated Fort Monmouth” Deep Learning for Self-Driving Cars (Chenyi Chen’s Dissertation, in prep.) Prospect 13 (PAVE’s efforts to develop a vision-based Self-driving car) Continued Analysis of autonomousTaxis Co-Founder Soterea Inc. “Plug & Play” Anti-Collision Technologies for All
 Effort to Establish Center for Research, Certification & Commercialization of Automated Fort Monmouth Deep Learning for Self-Driving Cars (Chenyi Chen’s Dissertation, in prep.) Prospect 13 (PAVE’s efforts to develop a vision-based Self-driving car) Continued Analysis of autonomousTaxis. Co-Founder Soterea Inc. Plug & Play Anti-Collision Technologies for All.")
3
Outline (what I’m involved with )
Still Waiting (Federal Transit $5M grant: Transit Bus Collision Avoidance)
")
4
Terrible News! Claims are going through the roof!

5
2011 Nationwide Bus Casualty and Liability Expense
2011 Nationwide Bus Casualty and Liability Expense Source FTA NTD Casualty and Liability Amount Vehicle-related $483,076,010. Total Buses 59,871 Sub-Total Casualty and Liability Amount Per Bus $8,069/Bus/Year

6
The Cost of Installing an Active Collision Avoidance System on a Bus Could be Recovered in as Little as One Year Through Reductions in Casualty and Liability Claims

7
The Initial Project: SmartDriving Technology for Buses
Focused on Research, Certification and Commercialization of SmartDriving Technology for Buses Team: Princeton University (with American Public Transit Association (APTA), Greater Cleveland Transit, and insurance pools from WA, CA, OH & VA) Pending $5M Grant from Federal Transit Administration We have grown tired of waiting for FTA so we’ve started the project without FTA but added Munich Re
, Greater Cleveland Transit, and insurance pools from WA, CA, OH & VA) Pending $5M Grant from. Federal Transit Administration. We have grown tired of waiting for FTA. so we’ve started the project without FTA but added Munich Re.")
8
Outline (what I’m involved with )
Still Waiting (Federal Transit $5M grant: Transit Bus Collision Avoidance) Effort to Establish “Center for Research, Certification & Commercialization of Automated Fort Monmouth”
 Effort to Establish Center for Research, Certification & Commercialization of Automated Fort Monmouth")
9
Why New Jersey? Observation: Action Item:
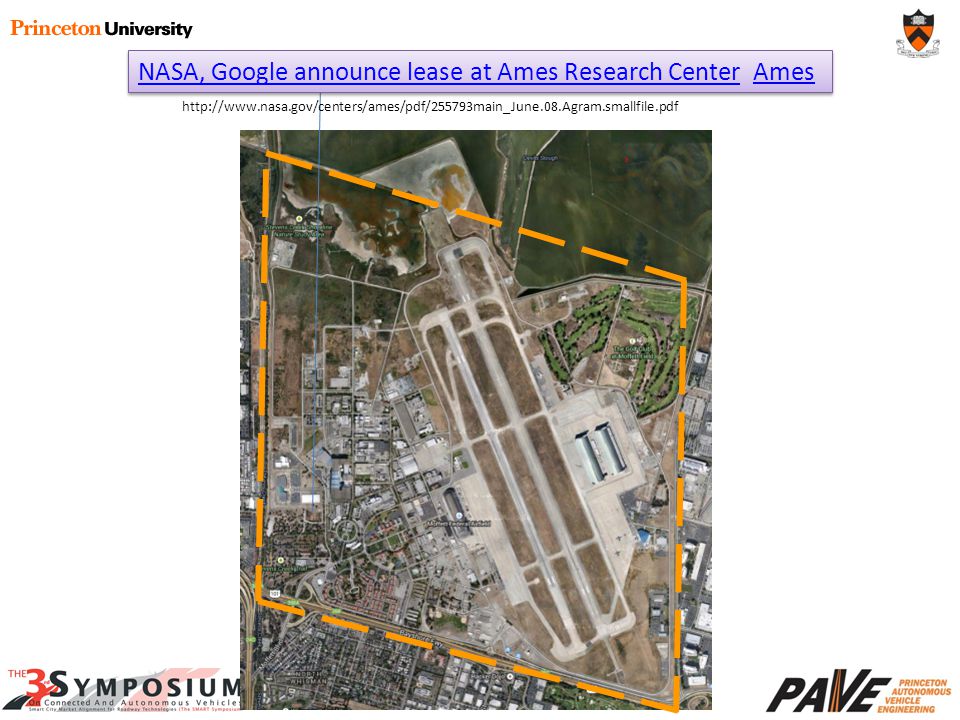
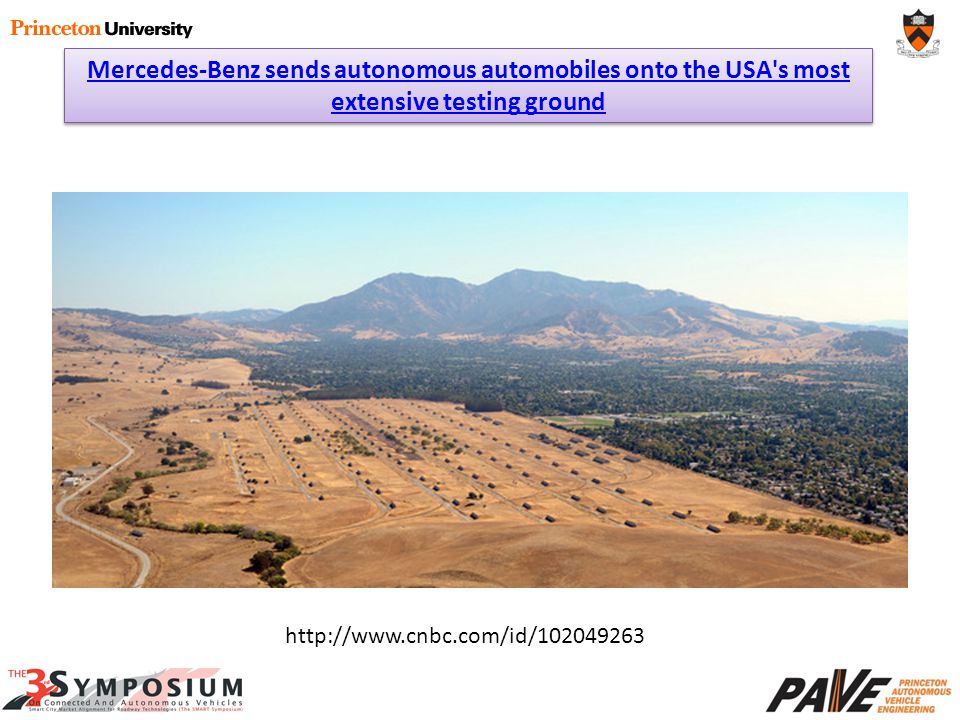
Other States are have begun to jump on this… California & Google’s Self-Driving Car Initiative Turned to focus investment on intelligence automation of the individual vehicle letting the infrastructure to be optimized for the conventional driver.. Brilliant!! Enables “Start small; grow fast” Florida: Automated car takes test drive on Selmon Expressway Michigan: University of Michigan to build $6.5M track to test automated cars in Ann Arbor Texas TTI Developing New Automated and Connected Transportation Test Bed California NASA, Google announce lease at Ames Research Center Ames Action Item: Get New Jersey and the NJ/NY/PA Region involved by Leveraging the Ft. Monmouth Facility. Create the Job, Improve mobility safety and the environment. Create the specifications and certifications for Automated Collision Avoidance Technology and eventually driverless vehicles.

10
NASA, Google announce lease at Ames Research Center Ames
11
Mercedes-Benz sends autonomous automobiles onto the USA's most extensive testing ground
12
Why Fort Monmouth? Observation: Action Item:
Ft Monmouth may well be one of the most hospitable sites for those with a Vested Interest in SmartDrivingTechnology to advance their intentions. Action Item: Create a Testing & Certification Environment for use by Those with a Vested Interest to collaboratively transition their products from Research to Full Commercialization

13
The Team The McAfee Center and The Fort’s Roadways The “Visionaries”
FMERA: Vision for World-Class Advanced Technology The Fort Princeton University: Facilitating FMERA’s Vision with a World-Class Center for Research, Certification and Commercialization of SmartDrivingCars (&Trucks & Buses) (RCCS) (pronounced “R Sis”) The “Coaching Staff” CARTS Corporation for Autonomous Roadway & Transit Systems The “Players” to be “Drafted” Automakers Suppliers Facilitators Insurance Universities Public Sector Mercedes Benz (HQ-NJ) Continental Bertram Capital NJ Manufacturers Princeton NJ DMV BMW (HQ-NJ) Bosch Verizon Munich Re Monmouth NJ Transit Subaru (HQ-NJ) Delphi AT&T Ins. Inst. for Hwy Safety CCNY Reg. 2 URC NJ DoT Ford Texas Inst DCH AutoGroup State Farm NJIT NJTPA+DVRPC Volvo autonomouStuff Qualcomm Progressive U of Maryland FHWA+FTA Jaguar MobilEye VisLab Geico Rutgers Monmouth County The “Venue” The McAfee Center and The Fort’s Roadways
 (RCCS) (pronounced R Sis ) The Coaching Staff CARTS. Corporation for Autonomous Roadway & Transit Systems. The Players to be Drafted Automakers. Suppliers. Facilitators. Insurance. Universities. Public Sector. Mercedes Benz (HQ-NJ) Continental. Bertram Capital. NJ Manufacturers. Princeton. NJ DMV. BMW (HQ-NJ) Bosch. Verizon. Munich Re. Monmouth. NJ Transit. Subaru (HQ-NJ) Delphi. AT&T. Ins. Inst. for Hwy Safety. CCNY Reg. 2 URC. NJ DoT. Ford. Texas Inst. DCH AutoGroup. State Farm. NJIT. NJTPA+DVRPC. Volvo. autonomouStuff. Qualcomm. Progressive. U of Maryland. FHWA+FTA. Jaguar. MobilEye. VisLab. Geico. Rutgers. Monmouth County. The Venue The McAfee Center and The Fort’s Roadways.")
14
Center’s Activity Matrix
Modal Dimension Sector Dimension Commercialization Certification Research Transit Cars Trucks Center’s Activity Matrix

15
Center for Research of SmartDrivingCars (CRS)
Princeton University Center for Research of SmartDrivingCars (CRS) at Fort Monmouth McAfee Complex 1250’ x 865’ ~ 25.8 acres Vehicle Bays McAfee Office Building ~ 100,000sf Support Buildings
 at Fort Monmouth. McAfee Complex. 1250’ x 865’ ~ 25.8 acres. Vehicle Bays. McAfee Office Building. ~ 100,000sf. Support Buildings.")
16
Center for Research of SmartDrivingCars (CRS) at Fort Monmouth
Princeton University Center for Research of SmartDrivingCars (CRS) at Fort Monmouth Exclusive Use Roadways Area ~ 60 acres Vehicle Bays McAfee Office Building ~ 100,000sf Support Buildings
 at Fort Monmouth. Exclusive Use Roadways Area. ~ 60 acres. Vehicle Bays. McAfee Office Building. ~ 100,000sf. Support Buildings.")
17
Center for Research of SmartDrivingCars (CRS)
Princeton University Center for Research of SmartDrivingCars (CRS) at Fort Monmouth Mixed Use Roadways ½ The Fort ~ 1 sq. mile Exclusive Use Roadways
 at Fort Monmouth. Mixed Use Roadways. ½ The Fort ~ 1 sq. mile. Exclusive Use Roadways.")
18
Near-term Schedule/ Milestones
Date Item Notes May 7, 2014 Creation of Prospectus May 14, 2014 Meeting with the FMERA Staff & Committees Week of June 2 Meeting of Potential Founding Members MB, BMW, Subaru, Verizon, Volvo, NJM, Munich Re, NJ DoT Later in June Public Announcement of Center’s existence Monday, June 30 Launch of the Membership Recruiting beginning with the creation of a plan Tuesday, July 15 Major Unveiling & recruiting TRB Automated Vehicle Conference Cocktail SF Airport Hyatt Friday Oct 3 Inaugural Automated Vehicle Summit McAfee Center, Fort Monmouth

19
Outline (what I’m involved with )
Still Waiting (Federal Transit $5M grant: Transit Bus Collision Avoidance) Effort to Establish “Center for Research, Certification & Commercialization of Automated Fort Monmouth” Deep Learning for Self-Driving Cars (Chenyi Chen’s Dissertation, in prep.)
 Effort to Establish Center for Research, Certification & Commercialization of Automated Fort Monmouth Deep Learning for Self-Driving Cars (Chenyi Chen’s Dissertation, in prep.)")
20
Deep Convolutional Neural Network (CNN)
Convolutional layers Fully connected layers …… Deep feature: {4096x1}, floats (4 bytes) Parallel computing Output: {14x1}, floats (4 bytes) Input image: {210x280x3}, int8 (1 byte) Figure: modified of Alex Krizhevsky, Ilya Sutskever, Geoffrey E. Hinton
 Parallel computing. Output: {14x1}, floats (4 bytes) Input image: {210x280x3}, int8 (1 byte) Figure: modified of Alex Krizhevsky, Ilya Sutskever, Geoffrey E. Hinton.")
21
Outline (what I’m involved with )
Still Waiting (Federal Transit $5M grant: Transit Bus Collision Avoidance) Effort to Establish “Center for Research, Certification & Commercialization of Automated Fort Monmouth” Deep Learning for Self-Driving Cars (Chenyi Chen’s Dissertation, in prep.) Prospect 13 (PAVE’s efforts to develop a vision-based Self-driving car)
 Effort to Establish Center for Research, Certification & Commercialization of Automated Fort Monmouth Deep Learning for Self-Driving Cars (Chenyi Chen’s Dissertation, in prep.) Prospect 13 (PAVE’s efforts to develop a vision-based Self-driving car)")
22
Outline (what I’m involved with )
Still Waiting (Federal Transit $5M grant: Transit Bus Collision Avoidance) Effort to Establish “Center for Research, Certification & Commercialization of Automated Fort Monmouth” Deep Learning for Self-Driving Cars (Chenyi Chen’s Dissertation, in prep.) Prospect 13 (PAVE’s efforts to develop a vision-based Self-driving car) Continued Analysis of autonomousTaxis
 Effort to Establish Center for Research, Certification & Commercialization of Automated Fort Monmouth Deep Learning for Self-Driving Cars (Chenyi Chen’s Dissertation, in prep.) Prospect 13 (PAVE’s efforts to develop a vision-based Self-driving car) Continued Analysis of autonomousTaxis.")
24
Preliminary Statement of Policy Concerning Automated Vehicles
What the Levels Deliver: Levels 1 -> 2: Increased Safety, Comfort & Convenience Primarily an Insurance Discount Play Levels 3: Increased Pleasure, Safety, Comfort & Convenience An Enormous Consumer Play Level 4 (Driverless Repositioning) : Pleasure, Mobility, Efficiency, Equity Revolutionizes “Mass Transit” by Greatly Extending the Trips that can be “zero” cost of Labor. (That was always the biggest “value” of PRT; zero labor cost for even zero-occupant trips) A Corporate Utility/Fleet Play
 : Pleasure, Mobility, Efficiency, Equity. Revolutionizes Mass Transit by Greatly Extending the Trips that can be zero cost of Labor. (That was always the biggest value of PRT; zero labor cost for even zero-occupant trips) A Corporate Utility/Fleet Play.")
25
All about Ride-sharing
What about Level 4 Implications on Energy, Congestion, Environment? Assuming Planners Don’t Change Land-Use hasn’t changed Trip ends don’t change! Assume Trip Distribution Doesn’t Change Then it is only Mode Split. Do I: Walk? Ride alone? Ride with someone? All about Ride-sharing

27
Synthesize from available data:
“every” NJ Traveler on a typical day NJ_Resident file Containing appropriate demographic and spatial characteristics that reflect trip making “every” trip that each Traveler is likely to make on a typical day. NJ_PersonTrip file Containing appropriate spatial and temporal characteristics for each trip

28
Bergen County @ Block Level
Population Census Blocks Median Pop/ Block Average Pop/Block BER 907,128 11,116 58 81.6

29
Assigning a Daily Activity (Trip) Tour to Each Person
 Tour to Each Person")
30
NJ_PersonTrip file 9,054,849 records
All Trips Home County Trips TripMiles AverageTM # Miles ATL 936,585 27,723,931 29.6 BER 3,075,434 40,006,145 13.0 BUC 250,006 9,725,080 38.9 BUR 1,525,713 37,274,682 24.4 CAM 1,746,906 27,523,679 15.8 CAP 333,690 11,026,874 33.0 CUM 532,897 18,766,986 35.2 ESS 2,663,517 29,307,439 11.0 GLO 980,302 23,790,798 24.3 HUD 2,153,677 18,580,585 8.6 HUN 437,598 13,044,440 29.8 MER 1,248,183 22,410,297 18.0 MID 2,753,142 47,579,551 17.3 MON 2,144,477 50,862,651 23.7 MOR 1,677,161 33,746,360 20.1 NOR 12,534 900,434 71.8 NYC 215,915 4,131,764 19.1 OCE 1,964,014 63,174,466 32.2 PAS 1,704,184 22,641,201 13.3 PHL 46,468 1,367,405 29.4 ROC 81,740 2,163,311 26.5 SAL 225,725 8,239,593 36.5 SOM 1,099,927 21,799,647 19.8 SOU 34,493 2,468,016 71.6 SUS 508,674 16,572,792 32.6 UNI 1,824,093 21,860,031 12.0 WAR 371,169 13,012,489 35.1 WES 16,304 477,950 29.3 Total 32,862,668 590,178,597 19.3 9,054,849 records One for each person in NJ_Resident file Specifying 32,862,668 Daily Person Trips Each characterized by a precise {oLat, oLon, oTime, dLat, dLon, Est_dTime}

31
NJ_PersonTrip file

32
Kinds of RideSharing “AVO < 1” RideSharing “Organized” RideSharing
“Daddy, take me to school.” (Lots today) “Organized” RideSharing Corporate commuter carpools (Very few today) “Tag-along” RideSharing One person decides: “I’m going to the store. Wanna come along”. Other: “Sure”. (Lots today) There exists a personal correlation between ride-sharers “Casual” RideSharing Chance meeting of a strange that wants to go in my direction at the time I want to go “Slug”, “Hitch hiker”
 Organized RideSharing. Corporate commuter carpools (Very few today) Tag-along RideSharing. One person decides: I’m going to the store. Wanna come along . Other: Sure . (Lots today) There exists a personal correlation between ride-sharers. Casual RideSharing. Chance meeting of a strange that wants to go in my direction at the time I want to go. Slug , Hitch hiker")
33
aTaxis and RideSharing
“AVO < 1” RideSharing Eliminate the “Empty Back-haul”; AVO Plus “Organized” RideSharing Diverted to aTaxis “Tag-along” RideSharing Only Primary trip maker modeled, “Tag-alongs” are assumed same after as before. “Casual” RideSharing This is the opportunity of aTaxis How much spatial and temporal aggregation is required to create significant casual ride-sharing opportunities.

34
Spatial Aggregation By walking to a station/aTaxiStand
At what point does a walk distance makes the aTaxi trip unattractive relative to one’s personal car? ¼ mile ( 5 minute) max Like using an Elevator! Elevator
 max. Like using an Elevator! Elevator.")
35
What about Level 4 Implications on Energy, Congestion, Environment
What about Level 4 Implications on Energy, Congestion, Environment? Assuming Planners Don’t Change No Change in Today’s Walking, Bicycling and Rail trips Today’s Automobile trips become aTaxi or aTaxi+Rail trips with hopefully LOTS of Ride-sharing opportunities

36
Pixelation of New Jersey
Zoomed-In Grid of Mercer NJ State Grid
![]()
37
Pixelating the State with half-mile Pixels
xPixel = floor{ * (longitude )} yPixel = floor{138.2 * (latitude – 38.9))
![]()
38
An aTaxiTrip An aTaxiTrip a PersonTrip
{oYpixel, oXpixel, oTime (Hr:Min:Sec) , } An aTaxiTrip {oYpixel, oXpixel, oTime (Hr:Min:Sec) ,dYpixel, dXpixel, Exected: dTime} a PersonTrip {oLat, oLon, oTime (Hr:Min:Sec) ,dLat, dLon, Exected: dTime} P1 D O O
 , } An aTaxiTrip. {oYpixel, oXpixel, oTime (Hr:Min:Sec) ,dYpixel, dXpixel, Exected: dTime} a PersonTrip. {oLat, oLon, oTime (Hr:Min:Sec) ,dLat, dLon, Exected: dTime} P1. D. O. O.")
39
Common Destination (CD)
CD=1p: Pixel -> Pixel (p->p) Ride-sharing P1 O TripMiles = 2L TripMiles = 3L TripMiles = L
 Ride-sharing. P1. O. TripMiles = 2L. TripMiles = 3L. TripMiles = L.")
40
P1 O PersonMiles = 3L aTaxiMiles = L AVO = PersonMiles/aTaxiMiles = 3

41
Elevator Analogy of an aTaxi Stand Departure Delay: DD = 300 Seconds
Temporal Aggregation Departure Delay: DD = 300 Seconds Kornhauser Obrien Johnson 40 sec Popkin 3:47 Henderson Lin 1:34

42
Elevator Analogy of an aTaxi Stand
60 seconds later Christie Maddow 4:12 Henderson Lin Young 0:34 Samuels 4:50 Popkin 2:17

43
Spatial Aggregation By walking to a station/aTaxiStand
A what point does a walk distance makes the aTaxi trip unattractive relative to one’s personal car? ¼ mile ( 5 minute) max By using the rail system for some trips Trips with at least one trip-end within a short walk to a train station. Trips to/from NYC or PHL
 max. By using the rail system for some trips. Trips with at least one trip-end within a short walk to a train station. Trips to/from NYC or PHL.")
44
An aTaxiTrip a PersonTrip from NYC
{oYpixel, oXpixel, TrainArrivalTime, dYpixel, dXpixel, Exected: dTime} a PersonTrip from NYC (or PHL or any Pixel containing a Train station) NYC NJ Transit Rail Line to NYC, next Departure D O Princeton Train Station aTaxiTrip
 NYC. NJ Transit Rail Line to NYC, next Departure. D. O. Princeton Train Station. aTaxiTrip.")
45
Spatial Aggregation By walking to a station/aTaxiStand
A what point does a walk distance makes the aTaxi trip unattractive relative to one’s personal car? ¼ mile ( 5 minute) max By using the rail system for some trips Trips with at least one trip end within a short walk to a train station. Trips to/from NYC or PHL By sharing rides with others that are basically going in my direction No trip has more than 20% circuity added to its trip time.
 max. By using the rail system for some trips. Trips with at least one trip end within a short walk to a train station. Trips to/from NYC or PHL. By sharing rides with others that are basically going in my direction. No trip has more than 20% circuity added to its trip time.")
46
CD= 3p: Pixel ->3Pixels Ride-sharing
O P2
![]()
47
CD= 3p: Pixel ->3Pixels Ride-sharing
O
![]()
48
What about Level 4 Implications on Energy, Congestion, Environment?
I just need a Trip File for some Local {Precise O, Precise oTime, Precise D} For All Trips! “Precise” Location: Within a Very Short Walk ~ Parking Space -> Front Door (Properly account for accessibility differences: conventionalAuto v aTaxi) “Precise” oTime : “to the second” (Properly account for how long one must wait around to ride with someone else)
 Precise oTime : to the second (Properly account for how long one must wait around to ride with someone else)")
49
Trip Synthesizer (Activity-Based)
Project Overview Trip Synthesizer (Activity-Based) Motivation – Publicly available TRAVEL Data do NOT contain: Spatial precision Where are people leaving from? Where are people going? Temporal precision At what time are they travelling? There is no data telling us when people are leaving their house, when they are coming back, where they are going in between
 Motivation – Publicly available TRAVEL Data do NOT contain: Spatial precision. Where are people leaving from Where are people going Temporal precision. At what time are they travelling There is no data telling us when people are leaving their house, when they are coming back, where they are going in between.")
50
Creating the NJ_Resident file
for “every” NJ Traveler on a typical day NJ_Resident file Start with Publically available data:

52
NJ Transit Train Station “Consumer-shed”

53
“Pixelated” New Jersey
(“1/2 mile square; 0.25mi2) aTaxi Concept – (PRT) Model Personal Rapid Transit Model aTaxi Concept – SPT Model Smart Para Transit Transit Model Ref:
![]()
54
New Jersey Summary Data
Item Value Area (mi2) 8,061 # of Pixels Generating at Least One O_Trip 21,643 Area of Pixels (mi2) 5,411 % of Open Space 32.9% # of Pixels Generating 95% of O_Trips 9,519 # of Pixels Generating 50% of O_Trips 1,310 # of Intra-Pixel Trips 447,102 # of O_Walk Trips 1,943,803 # of All O_Trips 32,862,668 Avg. All O_TripLength (miles) 19.6 # of O_aTaxi Trips 30,471,763 Avg. O_aTaxiTripLength (miles) 20.7 Median O_aTaxiTripLength (miles) 12.5 95% O_aTaxiTripLength (miles) 38.0
 8,061. # of Pixels Generating at Least One O_Trip. 21,643. Area of Pixels (mi2) 5,411. % of Open Space. 32.9% # of Pixels Generating 95% of O_Trips. 9,519. # of Pixels Generating 50% of O_Trips. 1,310. # of Intra-Pixel Trips. 447,102. # of O_Walk Trips. 1,943,803. # of All O_Trips. 32,862,668. Avg. All O_TripLength (miles) # of O_aTaxi Trips. 30,471,763. Avg. O_aTaxiTripLength (miles) Median O_aTaxiTripLength (miles) % O_aTaxiTripLength (miles)")
57
State-wide automatedTaxi (aTaxi)
Serves essentially all NJ travel demand (32M trips/day) Shared ridership potential: Slide 98
 Shared ridership potential: Slide 98.")
58
State-wide automatedTaxi (aTaxi)
Serves essentially all NJ travel demand (32M trips/day) Shared ridership potential:
 Shared ridership potential:")
59
State-wide automatedTaxi (aTaxi)
Fleet size (Instantaneous Repositioning)
")
60
http://orfe. princeton
c

61
Results

62
Results

63
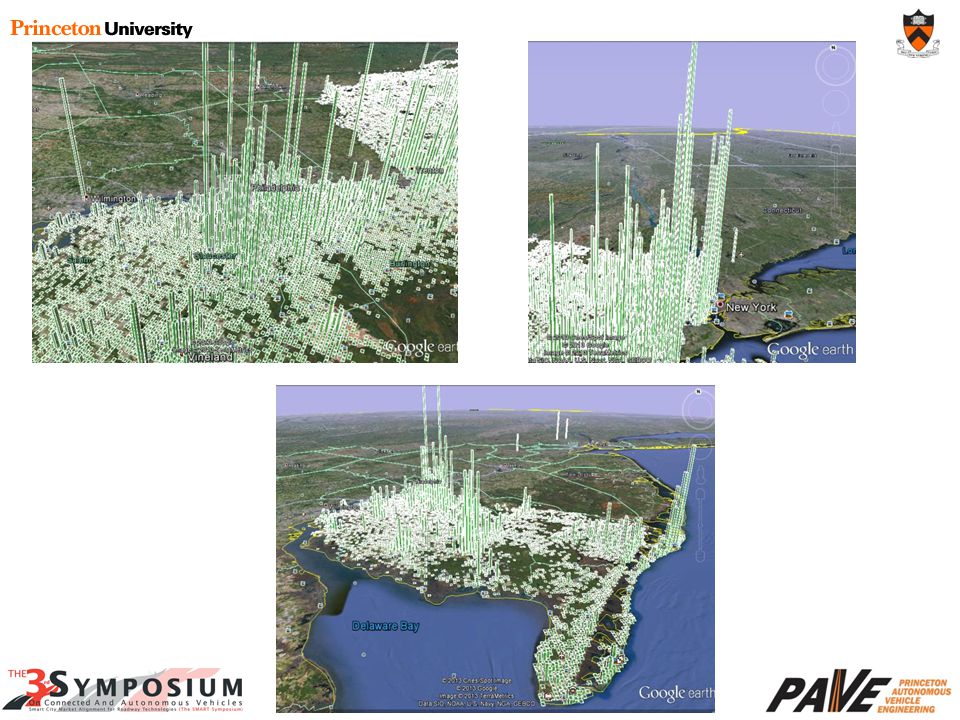
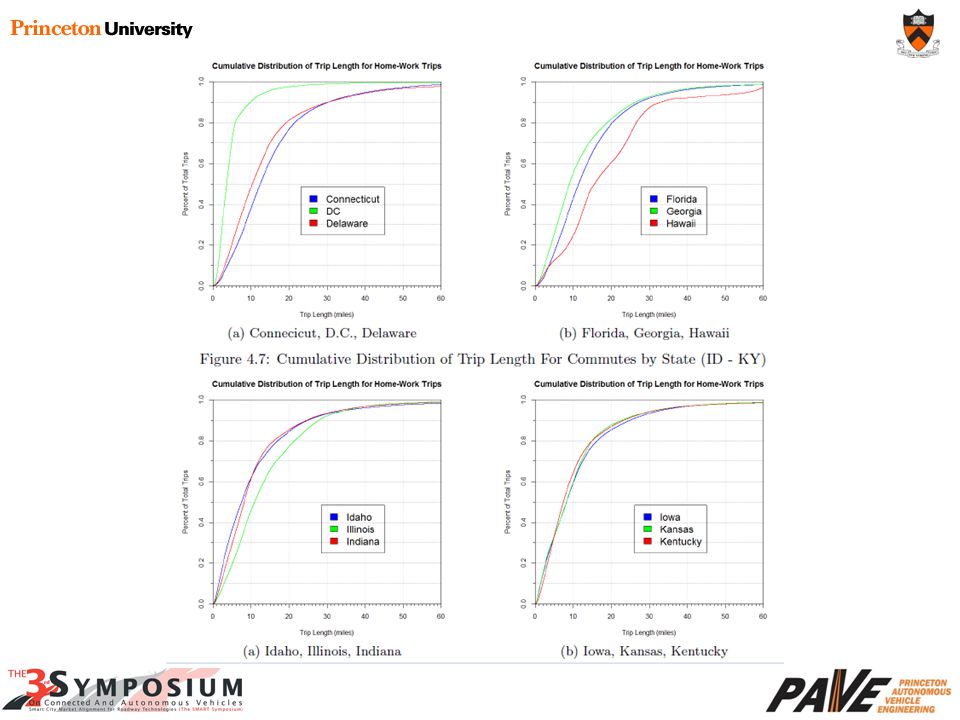
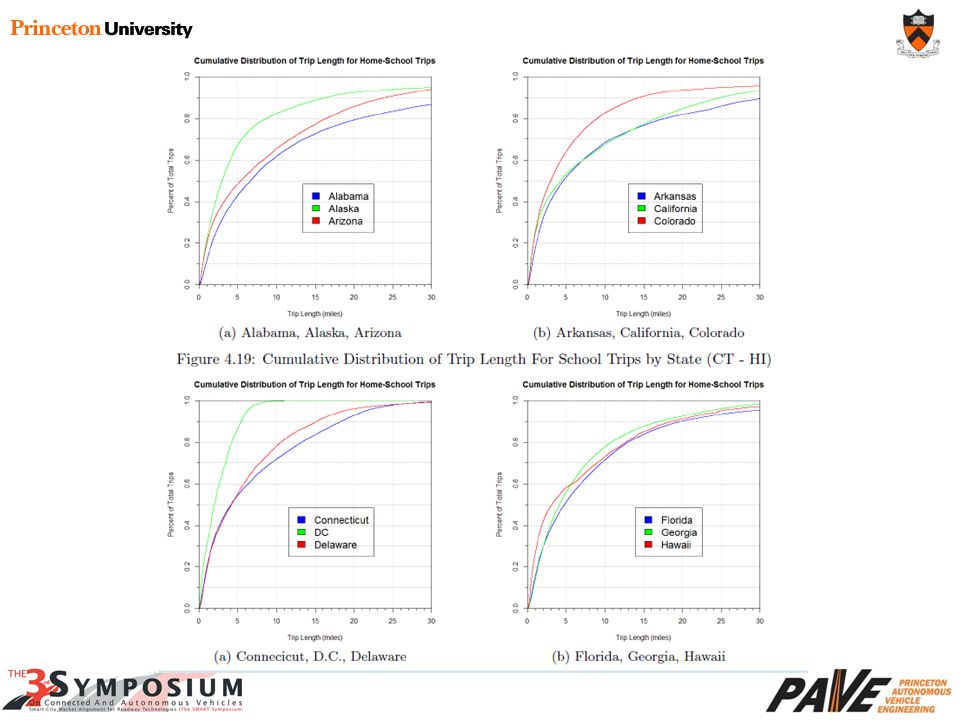
What about the whole country?

64
Public Schools in the US

65
Nation-Wide Businesses
Rank State Sales Volume No. Businesses 1 California $1,889 1,579,342 2 Texas $2,115 999,331 3 Florida $1,702 895,586 4 New York $1,822 837,773 5 Pennsylvania $2,134 550,678 9 New Jersey $1,919 428,596 45 Washington DC $1,317 49,488 47 Rhode Island $1,814 46,503 48 North Dakota $1,978 44,518 49 Delaware $2,108 41,296 50 Vermont $1,554 39,230 51 Wyoming $1,679 35,881 13.6 Million Businesses {Name, address, Sales, #employees} US Businesses: 13.6Million US Employees: 240 Million (with Luke's 50M students, 12% Unemployment) US Patrons: 330 Million (!!!) US Sales Volume: 30Billion
 US Patrons: 330 Million (!!!) US Sales Volume: 30Billion.")
66
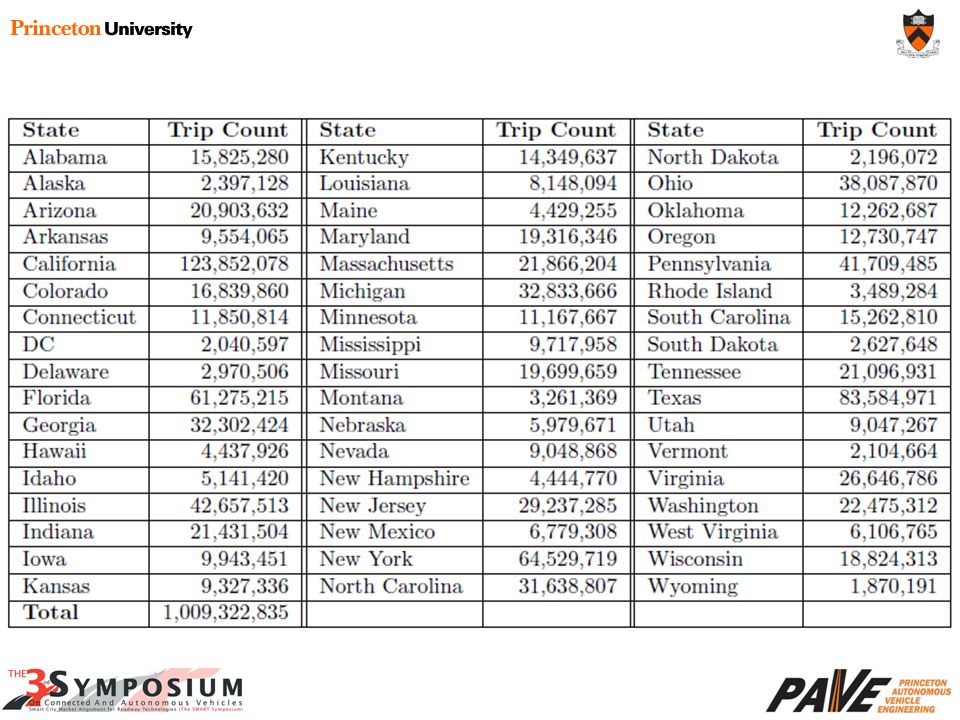
US_PersonTrip file will have..
308,745,538 records One for each person in US_Resident file Specifying 1,009,332,835 Daily Person Trips Each characterized by a precise {oLat, oLon, oTime, dLat, dLon, Est_dTime} Will Perform Nationwide aTaxi AVO analysis Results ????

71
Manhattan (New York County)
Simulated population of 1,585,873 residents 8,085,055 trips originate within Manhattan 52,759,156 person-trip miles for Manhattan oTrips 3,010,666 unique travelers (1,424,793 non-resident travelers – Commuters) Mean Trip Length = 6.53 miles; Median Trip Length = 3.31 miles Interesting differences between commuter and resident population traveling through Manhattan
 Mean Trip Length = 6.53 miles; Median Trip Length = 3.31 miles. Interesting differences between commuter and resident population traveling through Manhattan.")
72
Trip Files are Available If You want to Play

73
Outline (what I’m involved with )
Still Waiting (Federal Transit $5M grant: Transit Bus Collision Avoidance) Effort to Establish “Center for Research, Certification & Commercialization of Automated Fort Monmouth” Deep Learning for Self-Driving Cars (Chenyi Chen’s Dissertation, in prep.) Prospect 13 (PAVE’s efforts to develop a vision-based Self-driving car) Continued Analysis of autonomousTaxis Co-Founder Soterea Inc. “Plug & Play” Anti-Collision Technologies for All
 Effort to Establish Center for Research, Certification & Commercialization of Automated Fort Monmouth Deep Learning for Self-Driving Cars (Chenyi Chen’s Dissertation, in prep.) Prospect 13 (PAVE’s efforts to develop a vision-based Self-driving car) Continued Analysis of autonomousTaxis. Co-Founder Soterea Inc. Plug & Play Anti-Collision Technologies for All.")
75
Initial Focus is China Expect to have 1st Product Launch by July 2015 Initial Focus on Trucks, Then Buses, Finally Cars.

76
Discussion! Thank You

Similar presentations


 Professor, Operations Research.>")


>")
 Professor, Operations Research.>")


: 130 Census Blocks: 8,751 Hudson Population: 634,266 Area (square.>")


