Download presentation
Presentation is loading. Please wait.

1
by Alain L. Kornhauser, PhD Professor, Operations Research & Financial Engineering Director, Program in Transportation Faculty Chair, PAVE (Princeton Autonomous Vehicle Engineering) Princeton University Presented at PAVE – Summer Workshop Princeton, NJ August 4-6, 2014 The Darwinian Evolution of SmartDrivingCars
 Princeton University Presented at PAVE – Summer Workshop Princeton, NJ August 4-6, 2014 The Darwinian Evolution of SmartDrivingCars.")
4
AHS: Automated Highway Systems: 1939 - “Waterloo” may well be the word “System” 1997

5
APM: Automated People Mover: 1968 - “Waterloo” limited to serve “Few to Few” demand

6
PRT: Personal Rapid Transit: 1968 - Attempt to serve “Many to Many” but “Waterloo” may well be the word “Personal” & Exclusive Guideway? Attempt to serve “Many to Many” but “Waterloo” may well be the word “Personal” & Exclusive Guideway?

7
V2V: Connected Vehicles: 1997 - “Waterloo” may well be: Zero value until market penetration is high “Waterloo” may well be: Zero value until market penetration is high

8
SDC: SmartDrivingCars: 2004 - “Waterloo” may well be: Government & Bureaucracy Real beauty is in its “autonomy”: Benefits are derived by each equipped vehicle all by itself” Real beauty is in its “autonomy”: Benefits are derived by each equipped vehicle all by itself” CityMobil2

9
Preliminary Statement of Policy Concerning Driverless Cars Level 0 (No automation) The human is in complete and sole control of safety-critical functions (brake, throttle, steering) at all times. Level 1 (Function-specific automation) The human has complete authority, but cedes limited control of certain functions to the vehicle in certain normal driving or crash imminent situations. Example: electronic stability control Level 2 (Combined function automation) Automation of at least two control functions designed to work in harmony (e.g., adaptive cruise control and lane centering) in certain driving situations. Enables hands-off-wheel and foot-off-pedal operation. Driver still responsible for monitoring and safe operation and expected to be available at all times to resume control of the vehicle. Example: adaptive cruise control in conjunction with lane centering Level 3 (Limited self-driving) Vehicle controls all safety functions under certain traffic and environmental conditions. Human can cede monitoring authority to vehicle, which must alert driver if conditions require transition to driver control. Driver expected to be available for occasional control. Example: Google car Level 4 (Full self-driving automation) Vehicle controls all safety functions and monitors conditions for the entire trip. The human provides destination or navigation input but is not expected to be available for control during the trip. Vehicle may operate while unoccupied. Responsibility for safe operation rests solely on the automated system SmartDrivingCars & Trucks What is a SmartDrivingCar?
 The human has complete authority, but cedes limited control of certain functions to the vehicle in certain normal driving or crash imminent situations. Example: electronic stability control Level 2 (Combined function automation) Automation of at least two control functions designed to work in harmony (e.g., adaptive cruise control and lane centering) in certain driving situations. Enables hands-off-wheel and foot-off-pedal operation. Driver still responsible for monitoring and safe operation and expected to be available at all times to resume control of the vehicle. Example: adaptive cruise control in conjunction with lane centering Level 3 (Limited self-driving) Vehicle controls all safety functions under certain traffic and environmental conditions. Human can cede monitoring authority to vehicle, which must alert driver if conditions require transition to driver control. Driver expected to be available for occasional control. Example: Google car Level 4 (Full self-driving automation) Vehicle controls all safety functions and monitors conditions for the entire trip. The human provides destination or navigation input but is not expected to be available for control during the trip. Vehicle may operate while unoccupied. Responsibility for safe operation rests solely on the automated system SmartDrivingCars & Trucks What is a SmartDrivingCar .")
10
Level“Less”Value PropositionMarket ForceSocietal Implications Preliminary Statement of Policy Concerning Driverless Cars

11
What is a SmartDrivingCar? Level“Less”Value PropositionMarket ForceSocietal Implications 0 “55 Chevy” Zero Preliminary Statement of Policy Concerning Driverless Cars

12
What is a SmartDrivingCar? Level“Less”Value PropositionMarket ForceSocietal Implications 0 “55 Chevy” Zero 1 “Cruise Control” InfinitesimalSome ComfortInfinitesimal Preliminary Statement of Policy Concerning Driverless Cars

13
What is a SmartDrivingCar? Level“Less”Value PropositionMarket ForceSocietal Implications 0 “55 Chevy” Zero 1 “Cruise Control” InfinitesimalSome ComfortInfinitesimal 2 “Collision Avoidance & Lane Centering” InfinitesimalMuch Safety (but Consumers don’t pay for Safety) Needs help From “Flo & the Gecko” (Insurance incentivizes adoption) “50%” fewer accidents; less severity-> 50% less insurance $ liability Preliminary Statement of Policy Concerning Driverless Cars
 Needs help From Flo & the Gecko (Insurance incentivizes adoption) 50% fewer accidents; less severity-> 50% less insurance $ liability Preliminary Statement of Policy Concerning Driverless Cars.")
14
What is a SmartDrivingCar? Level“Less”Value PropositionMarket ForceSocietal Implications 0 “55 Chevy” Zero 1 “Cruise Control” InfinitesimalSome ComfortInfinitesimal 2 “Collision Avoidance & Lane Centering” InfinitesimalMuch Safety (but Consumers don’t pay for Safety) Needs help From “Flo & the Gecko” (Insurance incentivizes adoption) “50%” fewer accidents; less severity-> 50% less insurance $ liability 3 “Texting Machine” SomeLiberation (some of the time/places) ; more Safety Consumers Pull, TravelTainment Industry Push Increased car sales, many fewer insurance claims, slight + in VMT Preliminary Statement of Policy Concerning Driverless Cars
 Needs help From Flo & the Gecko (Insurance incentivizes adoption) 50% fewer accidents; less severity-> 50% less insurance $ liability 3 Texting Machine SomeLiberation (some of the time/places) ; more Safety Consumers Pull, TravelTainment Industry Push Increased car sales, many fewer insurance claims, slight + in VMT Preliminary Statement of Policy Concerning Driverless Cars.")
15
What is a SmartDrivingCar? Level“Less”Value PropositionMarket ForceSocietal Implications 0 “55 Chevy” Zero 1 “Cruise Control” InfinitesimalSome ComfortInfinitesimal 2 “Collision Avoidance & Lane Centering” InfinitesimalMuch Safety (but Consumers don’t pay for Safety) Needs help From “Flo & the Gecko” (Insurance incentivizes adoption) “50%” fewer accidents; less severity-> 50% less insurance $ liability 3 “Texting Machine” SomeLiberation (some of the time/places) ; more Safety Consumers Pull, TravelTainment Industry Push Increased car sales, many fewer insurance claims, slight + in VMT 4 “aTaxi “ AlwaysChauffeured, Buy Mobility “by the Drink” rather than “by the Bottle” Profitable Business Opportunity for Utilities/Transit Companies Personal Car becomes “Bling” not instrument of personal mobility, VMT ?; Comm. Design ? Energy, Congestion, Environment? Preliminary Statement of Policy Concerning Driverless Cars
 Needs help From Flo & the Gecko (Insurance incentivizes adoption) 50% fewer accidents; less severity-> 50% less insurance $ liability 3 Texting Machine SomeLiberation (some of the time/places) ; more Safety Consumers Pull, TravelTainment Industry Push Increased car sales, many fewer insurance claims, slight + in VMT 4 aTaxi AlwaysChauffeured, Buy Mobility by the Drink rather than by the Bottle Profitable Business Opportunity for Utilities/Transit Companies Personal Car becomes Bling not instrument of personal mobility, VMT ; Comm. Design . Energy, Congestion, Environment. Preliminary Statement of Policy Concerning Driverless Cars.")
16
What the Levels Deliver: Levels 1 -> 2: Increased Safety, Comfort & Convenience Level 4 (Driverless Repositioning) : Pleasure, Mobility, Efficiency, Equity Revolutionizes “Mass Transit” by Greatly Extending the Trips that can be served @ “zero” cost of Labor. (That was always the biggest “value” of PRT; zero labor cost for even zero-occupant trips) Level 4 (Driverless Repositioning) : Pleasure, Mobility, Efficiency, Equity Revolutionizes “Mass Transit” by Greatly Extending the Trips that can be served @ “zero” cost of Labor. (That was always the biggest “value” of PRT; zero labor cost for even zero-occupant trips) Primarily an Insurance Discount Play A Corporate Utility/Fleet Play Levels 3: Increased Pleasure, Safety, Comfort & Convenience An Enormous Consumer Play Preliminary Statement of Policy Concerning Driverless Cars
 Level 4 (Driverless Repositioning) : Pleasure, Mobility, Efficiency, Equity Revolutionizes Mass Transit by Greatly Extending the Trips that can be zero cost of Labor. (That was always the biggest value of PRT; zero labor cost for even zero-occupant trips) Primarily an Insurance Discount Play A Corporate Utility/Fleet Play Levels 3: Increased Pleasure, Safety, Comfort & Convenience An Enormous Consumer Play Preliminary Statement of Policy Concerning Driverless Cars.")
19
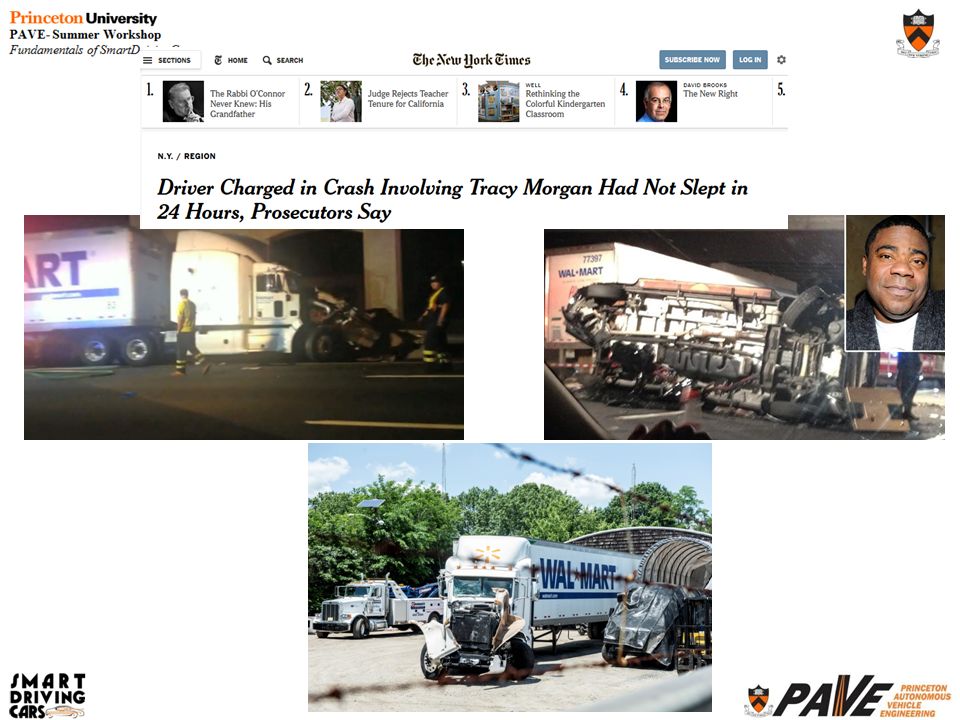
Hmmm... this is enormously tragic because existing collision avoidance technology could have likely avoided this accident altogether even if Mr. Roper had not slept for 48 hours or was in complete compliance with all "hours of service regulations". Even if Mr. Roper had not slept for 24 hours, tougher hours of service regulations would not have prevented this accident. What would have prevented this accident would have been the availability of collision avoidance technology on this truck. If Walmart somehow feels indisposed by this accident and wants to react constructively, Walmart should contribute to the advancement of collision avoidance technology and insist that all trucks moving their goods be equipped with such technology! In fact, calling this an accident may well be a misnomer; maybe we should call it irresponsibility on Walmart’s part for not insisting that the trucks serving their stores have this technology. The cost of this technology may well evolve to be more than offset by the reduction in truck insurance expense. In other words, Walmart would not be indisposed and save money. That doesn’t sound like an accident to me. It sounds like fiduciary (and societal) irresponsibility on the part of Walmart. Of course, Walmart is not the only business that relies on long haul truckers to supply goods to its stores. The Tracy Morgan collision should be a wake up call for businesses that rely on large trucks on US roads every day driven by drivers operating under pressure on deadlines. Now that collision avoidance technology is available, Walmart and other business should insist that their logistics partners use trucks equipped with this technology. They will save money in the long run and lives in the short and long runs. Alain
 irresponsibility on the part of Walmart. Of course, Walmart is not the only business that relies on long haul truckers to supply goods to its stores. The Tracy Morgan collision should be a wake up call for businesses that rely on large trucks on US roads every day driven by drivers operating under pressure on deadlines. Now that collision avoidance technology is available, Walmart and other business should insist that their logistics partners use trucks equipped with this technology. They will save money in the long run and lives in the short and long runs. Alain.")
20
Thank You alaink@princeton.edu www.SmartDrivingCar.com Discussion!

21
What About Buses?

22
Use Autonomous Collision Avoidance Technology to Address a BIG CURRENT Transit Problem

23
Good News! Travel by Bus is getting safer!

24
Good News! Injuries have been trending down!

25
Terrible News! Claims are going through the roof!

26
Casualty and Liability Claims are a Huge Drain on the Industry For the 10 year period 2002-2011, more than $4.1 Billion was spent on casualty and liability claims For many self-insured transit agencies these expenses are direct “out-of-pocket”

27
2011 Nationwide Bus Casualty and Liability Expense Source FTA NTD Casualty and Liability Amount Vehicle- related $483,076,010. Total Buses 59,871 Sub-Total Casualty and Liability Amount Per Bus $8,069/Bus/Year

28
The Cost of Installing an Active Collision Avoidance System on a Bus Could be Recovered in as Little as One Year Through Reductions in Casualty and Liability Claims

29
Why New Jersey? Observation: In 2 Years, NJ Transit will initiate a new Bus Replacement Cycle (That will extend for about 15 years) Action Item: – Ensure that the Procurement Specifications include “Level 2” SmartDriving Technologies
 Action Item: – Ensure that the Procurement Specifications include Level 2 SmartDriving Technologies.")
30
Near-term Opportunity for a Substantive Extension of Autonomous Transit Specific: General Mobility for Fort Monmouth Redevelopment – Currently: Decommissioned Ft. Monmouth is vacant. Ft. Monmouth Economic Revitalization Authority (FMERA) is redeveloping the 3 sq. mile “city”FMERAredeveloping Focus is on attracting high-tech industry The “Fort” needs a mobility system. FMERA is receptive to incorporating an innovative mobility system Because it is being redeveloped as a “new town” it can accommodate itself to be an ideal site for testing more advanced driverless systems.
 is redeveloping the 3 sq. mile city FMERAredeveloping Focus is on attracting high-tech industry The Fort needs a mobility system. FMERA is receptive to incorporating an innovative mobility system Because it is being redeveloped as a new town it can accommodate itself to be an ideal site for testing more advanced driverless systems..")
31
The Initial Project: Princeton University (with American Public Transit Association (APTA), Greater Cleveland Transit, and insurance pools from WA, CA, OH & VA) Focused on Research, Certification and Commercialization of SmartDriving Technology to Buses Pending $5M Grant from Federal Transit Administration
, Greater Cleveland Transit, and insurance pools from WA, CA, OH & VA) Focused on Research, Certification and Commercialization of SmartDriving Technology to Buses Pending $5M Grant from Federal Transit Administration")
32
Proposal Done: December 2, 2013: For next 6 months: Silence from FTA Proposal Done: December 2, 2013: For next 6 months: Silence from FTA In those 6 months approximately: 39 Fatalities 7,200 Injuries $180M Claims “Level 2 Collision Avoidance Technology” Could cut those numbers in half Why the delay in spending $5M to get the process started ???????

33
Thank You alaink@princeton.edu www.SmartDrivingCar.com Discussion!

34
Assuming PLANNERS continue to PLAN as they do now. – How will people “get around”? Assuming this new way of “getting around” offers different opportunities and constraints for PLANNERS to improve “Quality of Life”. – How will Zoning/Land-Use Change? – How will people “get around”? What about Level 4 Implications on Energy, Congestion, Environment?

35
Land-Use hasn’t changed – Trip ends don’t change! Assume Trip Distribution Doesn’t Change – Then it is only Mode Split. – Do I: Walk? Ride alone? Ride with someone? All about Ride-sharing What about Level 4 Implications on Energy, Congestion, Environment? Assuming Planners Don’t Change

36
“AVO < 1” RideSharing – “Daddy, take me to school.” (Lots today) “Organized” RideSharing – Corporate commuter carpools (Very few today) “Tag-along” RideSharing – One person decides: “I’m going to the store. Wanna come along”. Other: “Sure”. (Lots today) There exists a personal correlation between ride-sharers “Casual” RideSharing – Chance meeting of a strange that wants to go in my direction at the time I want to go “Slug”, “Hitch hiker” Kinds of RideSharing
 There exists a personal correlation between ride-sharers Casual RideSharing – Chance meeting of a strange that wants to go in my direction at the time I want to go Slug , Hitch hiker Kinds of RideSharing.")
37
“AVO < 1” RideSharing – Eliminate the “Empty Back-haul”; AVO Plus “Organized” RideSharing – Diverted to aTaxis “Tag-along” RideSharing – Only Primary trip maker modeled, “Tag-alongs” are assumed same after as before. “Casual” RideSharing – This is the opportunity of aTaxis – How much spatial and temporal aggregation is required to create significant casual ride-sharing opportunities. aTaxis and RideSharing

38
By walking to a station/aTaxiStand – At what point does a walk distance makes the aTaxi trip unattractive relative to one’s personal car? – ¼ mile ( 5 minute) max Like using an Elevator! Spatial Aggregation Elevator
 max Like using an Elevator. Spatial Aggregation Elevator.")
39
No Change in Today’s Walking, Bicycling and Rail trips – Today’s Automobile trips become aTaxi or aTaxi+Rail trips with hopefully LOTS of Ride-sharing opportunities What about Level 4 Implications on Energy, Congestion, Environment? Assuming Planners Don’t Change

40
Pixelation of New Jersey NJ State Grid Zoomed-In Grid of Mercer

41
Pixelating the State with half-mile Pixels Pixelating the State with half-mile Pixels xPixel = floor{108.907 * (longitude + 75.6)} yPixel = floor{138.2 * (latitude – 38.9)) xPixel = floor{108.907 * (longitude + 75.6)} yPixel = floor{138.2 * (latitude – 38.9))
} yPixel = floor{138.2 * (latitude – 38.9)) xPixel = floor{ * (longitude )} yPixel = floor{138.2 * (latitude – 38.9))")
42
a PersonTrip {oLat, oLon, oTime (Hr:Min:Sec),dLat, dLon, Exected: dTime} a PersonTrip {oLat, oLon, oTime (Hr:Min:Sec),dLat, dLon, Exected: dTime} O O D P1P1 An aTaxiTrip {oYpixel, oXpixel, oTime (Hr:Min:Sec), } An aTaxiTrip {oYpixel, oXpixel, oTime (Hr:Min:Sec), } An aTaxiTrip {oYpixel, oXpixel, oTime (Hr:Min:Sec),dYpixel, dXpixel, Exected: dTime} An aTaxiTrip {oYpixel, oXpixel, oTime (Hr:Min:Sec),dYpixel, dXpixel, Exected: dTime}
,dLat, dLon, Exected: dTime} a PersonTrip {oLat, oLon, oTime (Hr:Min:Sec),dLat, dLon, Exected: dTime} O O D P1P1 An aTaxiTrip {oYpixel, oXpixel, oTime (Hr:Min:Sec), } An aTaxiTrip {oYpixel, oXpixel, oTime (Hr:Min:Sec), } An aTaxiTrip {oYpixel, oXpixel, oTime (Hr:Min:Sec),dYpixel, dXpixel, Exected: dTime} An aTaxiTrip {oYpixel, oXpixel, oTime (Hr:Min:Sec),dYpixel, dXpixel, Exected: dTime}")
43
P1P1 O Common Destination (CD) CD=1p: Pixel -> Pixel (p->p) Ride-sharing Common Destination (CD) CD=1p: Pixel -> Pixel (p->p) Ride-sharing TripMiles = L TripMiles = 2L TripMiles = 3L
 CD=1p: Pixel -> Pixel (p->p) Ride-sharing Common Destination (CD) CD=1p: Pixel -> Pixel (p->p) Ride-sharing TripMiles = L TripMiles = 2L TripMiles = 3L")
44
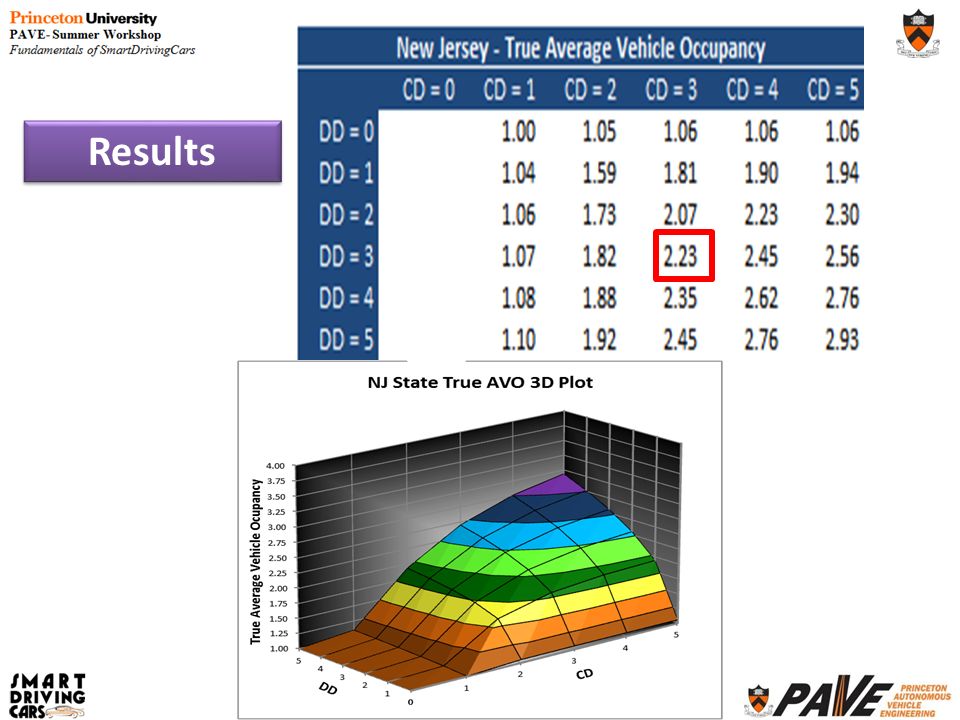
P1P1 O PersonMiles = 3L aTaxiMiles = L AVO = PersonMiles/aTaxiMiles = 3 PersonMiles = 3L aTaxiMiles = L AVO = PersonMiles/aTaxiMiles = 3

45
Elevator Analogy of an aTaxi Stand Temporal Aggregation Departure Delay: DD = 300 Seconds Elevator Analogy of an aTaxi Stand Temporal Aggregation Departure Delay: DD = 300 Seconds Kornhauser Obrien Johnson 40 sec Henderson Lin 1:34 Popkin 3:47

46
Samuels 4:50 Henderson Lin Young 0:34 Popkin 2:17 Elevator Analogy of an aTaxi Stand 60 seconds later Elevator Analogy of an aTaxi Stand 60 seconds later Christie Maddow 4:12

47
By walking to a station/aTaxiStand – A what point does a walk distance makes the aTaxi trip unattractive relative to one’s personal car? – ¼ mile ( 5 minute) max By using the rail system for some trips – Trips with at least one trip-end within a short walk to a train station. – Trips to/from NYC or PHL Spatial Aggregation
 max By using the rail system for some trips – Trips with at least one trip-end within a short walk to a train station. – Trips to/from NYC or PHL Spatial Aggregation.")
48
D a PersonTrip from NYC (or PHL or any Pixel containing a Train station) a PersonTrip from NYC (or PHL or any Pixel containing a Train station) NYC O Princeton Train Station NJ Transit Rail Line to NYC, next Departure aTaxiTrip An aTaxiTrip {oYpixel, oXpixel, TrainArrivalTime, dYpixel, dXpixel, Exected: dTime} An aTaxiTrip {oYpixel, oXpixel, TrainArrivalTime, dYpixel, dXpixel, Exected: dTime}
 a PersonTrip from NYC (or PHL or any Pixel containing a Train station) NYC O Princeton Train Station NJ Transit Rail Line to NYC, next Departure aTaxiTrip An aTaxiTrip {oYpixel, oXpixel, TrainArrivalTime, dYpixel, dXpixel, Exected: dTime} An aTaxiTrip {oYpixel, oXpixel, TrainArrivalTime, dYpixel, dXpixel, Exected: dTime}")
49
By walking to a station/aTaxiStand – A what point does a walk distance makes the aTaxi trip unattractive relative to one’s personal car? – ¼ mile ( 5 minute) max By using the rail system for some trips – Trips with at least one trip end within a short walk to a train station. – Trips to/from NYC or PHL By sharing rides with others that are basically going in my direction – No trip has more than 20% circuity added to its trip time. Spatial Aggregation
 max By using the rail system for some trips – Trips with at least one trip end within a short walk to a train station. – Trips to/from NYC or PHL By sharing rides with others that are basically going in my direction – No trip has more than 20% circuity added to its trip time. Spatial Aggregation.")
50
P1P1 P2P2 O CD= 3p: Pixel ->3Pixels Ride-sharing

51
P1P1 P5P5 O P3P3

52
– I just need a Trip File for some Local {Precise O, Precise oTime, Precise D} For All Trips! – “Precise” Location: Within a Very Short Walk ~ Parking Space -> Front Door (Properly account for accessibility differences: conventionalAuto v aTaxi) – “Precise” oTime : “to the second” (Properly account for how long one must wait around to ride with someone else) What about Level 4 Implications on Energy, Congestion, Environment?
 – Precise oTime : to the second (Properly account for how long one must wait around to ride with someone else) What about Level 4 Implications on Energy, Congestion, Environment .")
53
Motivation – Publicly available TRAVEL Data do NOT contain: – Spatial precision Where are people leaving from? Where are people going? – Temporal precision At what time are they travelling? Trip Synthesizer (Activity-Based) Project Overview
 Project Overview.")
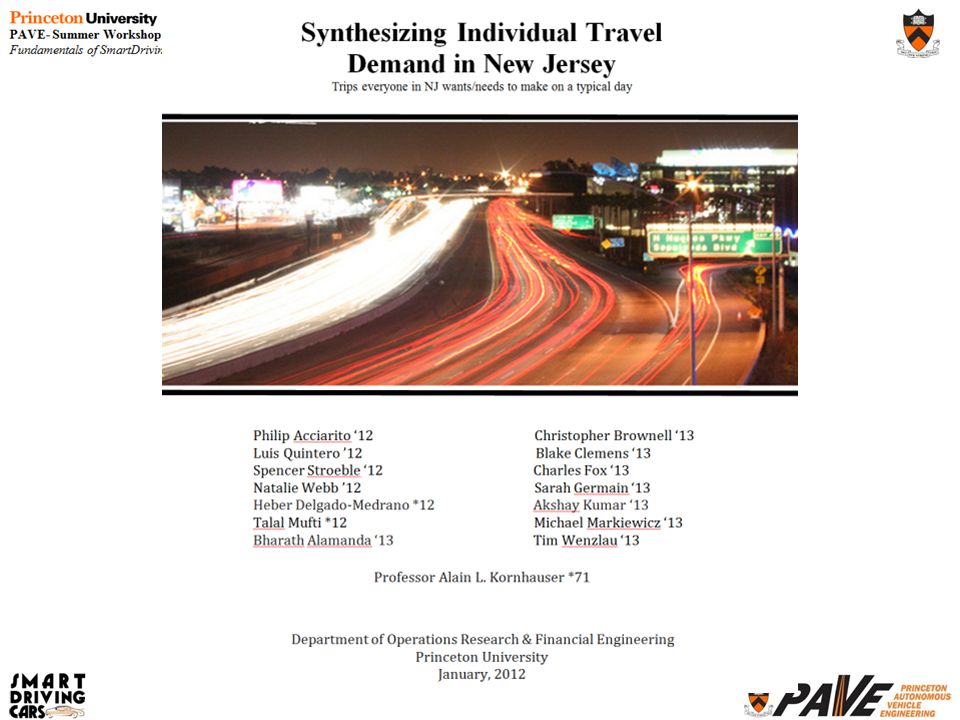
55
Synthesize from available data: “every” NJ Traveler on a typical day NJ_Resident file – Containing appropriate demographic and spatial characteristics that reflect trip making “every” trip that each Traveler is likely to make on a typical day. NJ_PersonTrip file – Containing appropriate spatial and temporal characteristics for each trip

56
Creating the NJ_Resident file for “every” NJ Traveler on a typical day NJ_Resident file Start with Publically available data:

57
Bergen County @ Block Level CountyPopulationCensus Blocks Median Pop/ Block Average Pop/Block BER 907,128 11,1165881.6

58
Assigning a Daily Activity (Trip) Tour to Each Person
 Tour to Each Person")
59
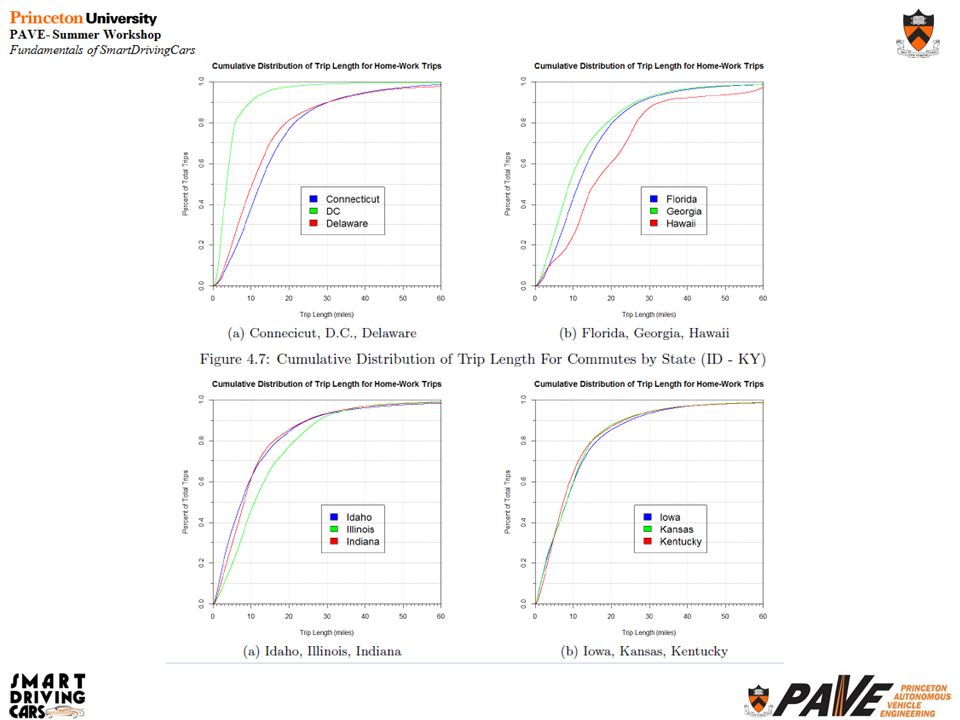
NJ_PersonTrip file 9,054,849 records – One for each person in NJ_Resident file Specifying 32,862,668 Daily Person Trips – Each characterized by a precise {oLat, oLon, oTime, dLat, dLon, Est_dTime} All Trips Home County TripsTripMilesAverageTM #Miles ATL 936,585 27,723,93129.6 BER 3,075,434 40,006,14513.0 BUC 250,006 9,725,08038.9 BUR 1,525,713 37,274,68224.4 CAM 1,746,906 27,523,67915.8 CAP 333,690 11,026,87433.0 CUM 532,897 18,766,98635.2 ESS 2,663,517 29,307,43911.0 GLO 980,302 23,790,79824.3 HUD 2,153,677 18,580,5858.6 HUN 437,598 13,044,44029.8 MER 1,248,183 22,410,29718.0 MID 2,753,142 47,579,55117.3 MON 2,144,477 50,862,65123.7 MOR 1,677,161 33,746,36020.1 NOR 12,534 900,43471.8 NYC 215,915 4,131,76419.1 OCE 1,964,014 63,174,46632.2 PAS 1,704,184 22,641,20113.3 PHL 46,468 1,367,40529.4 ROC 81,740 2,163,31126.5 SAL 225,725 8,239,59336.5 SOM 1,099,927 21,799,64719.8 SOU 34,493 2,468,01671.6 SUS 508,674 16,572,79232.6 UNI 1,824,093 21,860,03112.0 WAR 371,169 13,012,48935.1 WES 16,304 477,95029.3 Total 32,862,668 590,178,59719.3

60
NJ_PersonTrip file

62
c http://orfe.princeton.edu/~alaink/NJ_aTaxiOrf467F13/Orf467F13_NJ_TripFiles/MID-1_aTaxiDepAnalysis_300,SP.xlsx

63
Results

65
What about the whole country?

66
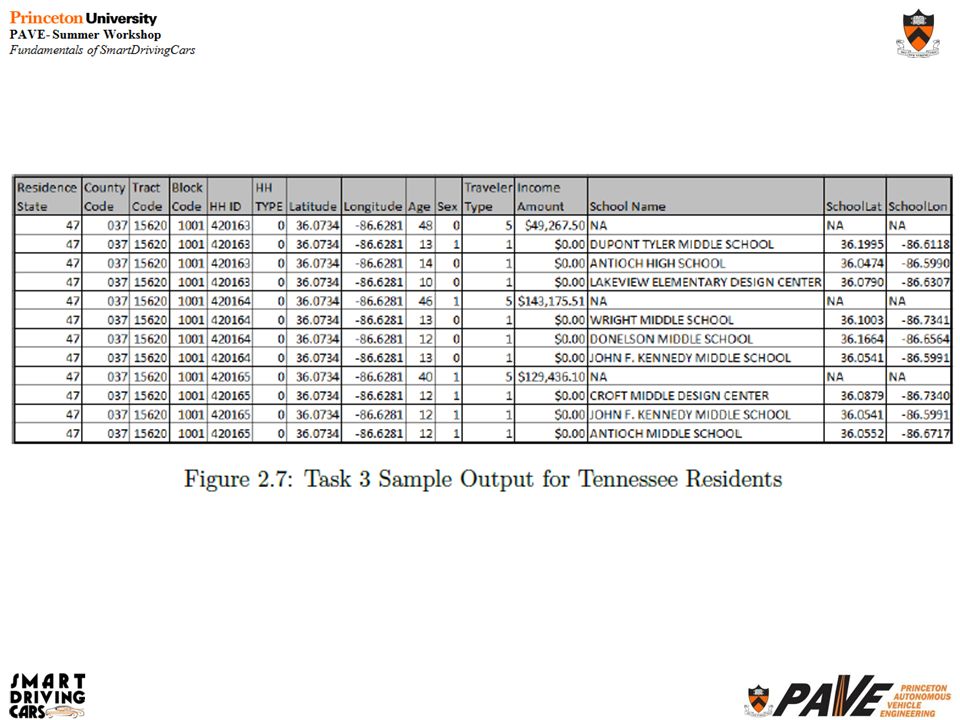
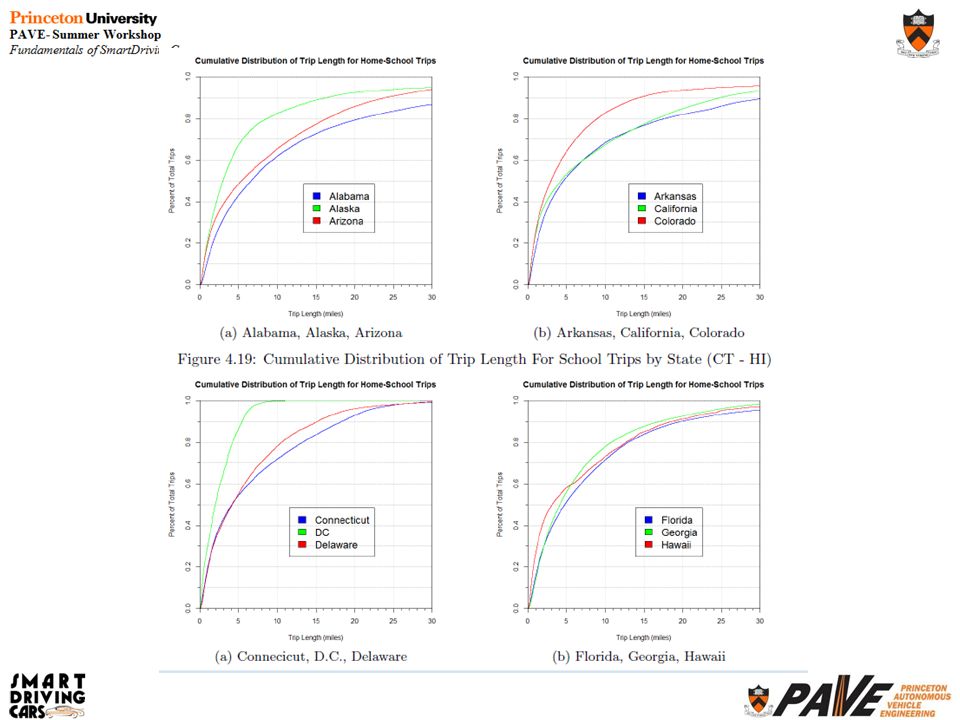
Public Schools in the US

67
Nation-Wide Businesses RankState Sales VolumeNo. Businesses 1California$1,8891,579,342 2Texas$2,115999,331 3Florida$1,702895,586 4New York$1,822837,773 5Pennsylvania$2,134550,678 9New Jersey$1,919428,596 45Washington DC$1,31749,488 47Rhode Island$1,81446,503 48North Dakota$1,97844,518 49Delaware$2,10841,296 50Vermont$1,55439,230 51Wyoming$1,67935,881 13.6 Million Businesses {Name, address, Sales, #employees}

68
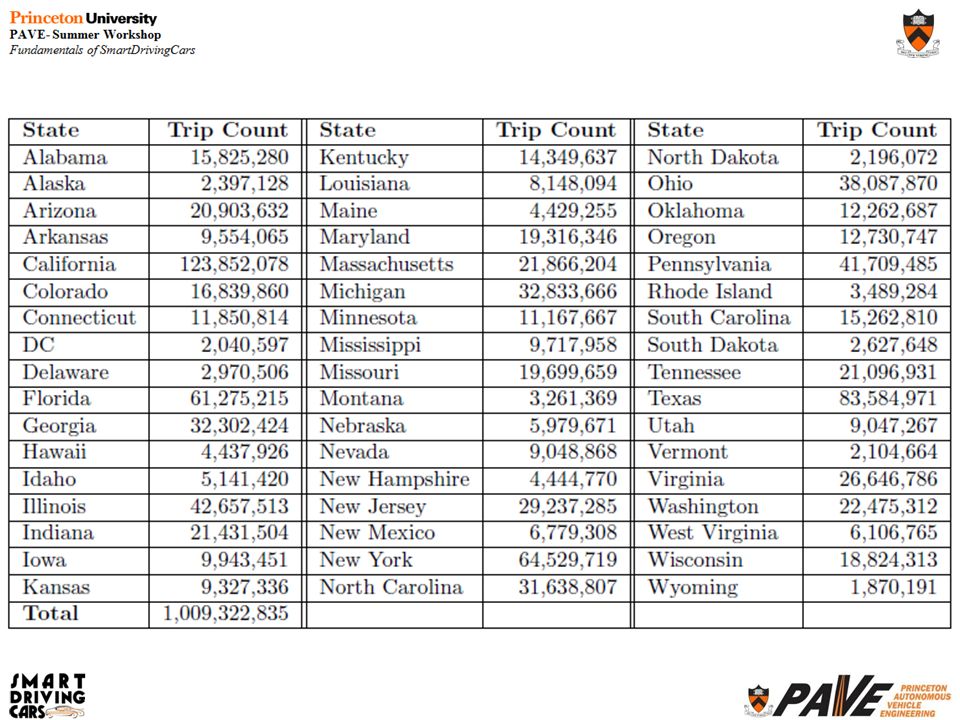
US_PersonTrip file will have.. 308,745,538 records – One for each person in US_Resident file Specifying 1,009,332,835 Daily Person Trips – Each characterized by a precise {oLat, oLon, oTime, dLat, dLon, Est_dTime} Will Perform Nationwide aTaxi AVO analysis Results ????

73
Trip Files are Available If You want to Play

74
Thank You alaink@princeton.edu www.SmartDrivingCar.com Discussion!

76
Conventional Cars Drive Urban/City Planning

77
Current State of Public Transport… Not Good!: – Serves about 2% of all motorized trips – Passenger Miles (2007)*: 2.640x10 12 Passenger Car; 1.927x10 12 SUV/Light Truck; 0.052x10 12 All Transit; 0.006x10 12 Amtrak – Does a little better in “peak hour” and NYC 5% commuter trips NYC Met area contributes about half of all transit trips – Financially it’s a “train wreck” http://www.bts.gov/publications/national_transportation_statistics/2010/pdf/entire.pdfhttp://www.bts.gov/publications/national_transportation_statistics/2010/pdf/entire.pdf, Table1-37
*: 2.640x10 12 Passenger Car; 1.927x10 12 SUV/Light Truck; 0.052x10 12 All Transit; 0.006x10 12 Amtrak – Does a little better in peak hour and NYC 5% commuter trips NYC Met area contributes about half of all transit trips – Financially it’s a train wreck Table1-37")
78
Transit’s Fundamental Problem… Transit is non-competitive to serve most travel demand – Travel Demand (desire to go from A to B in a time window A & B are walk accessible areas, typically: – Very large number of very geographically diffused {A,B} pairs is diffused throughout the day with only modest concentration in morning and afternoon peak hours The conventionalAutomobile at “all” times Serves… – Essentially all {A,B} pairs demand-responsively within a reasonable Transit at “few” times during the day Serves… – a modest number of A & B on scheduled fixed routes – But very few {A,B} pairs within a reasonable Transit’s need for an expensive driver Forces it to only offer infrequent scheduled fixed route service between few {A,B} pairs – But… Transit can become demand-responsive serving many {A,B} if the driver is made cheap and it utilizes existing roadway infrastructure. 0.25 mi.

Similar presentations


 Professor, Operations Research.>")


>")


