Download presentation
Presentation is loading. Please wait.

1
Charlie Kalech Director, J-Town Internet Services Ltd. February 26, 2015

2
✔ Customized Reports (Dashboards) ✔ Segmentation ✔ Filtering ✔ Tracking On-Site Actions ✔ Comparing Your Site to the Competition ✔ (Benchmarking) ✔ Integrating Your Site and Google Analytics ✔ With Other Google Assets
 ✔ Segmentation ✔ Filtering ✔ Tracking On-Site Actions ✔ Comparing Your Site to the Competition ✔ (Benchmarking) ✔ Integrating Your Site and Google Analytics ✔ With Other Google Assets")
3
Data Is Only Useful If It Answers Informed Questions What Are Your Goals and What Information Do You Need To Have In Order To Reach Them? What Are Your Business Intelligence Questions?

4
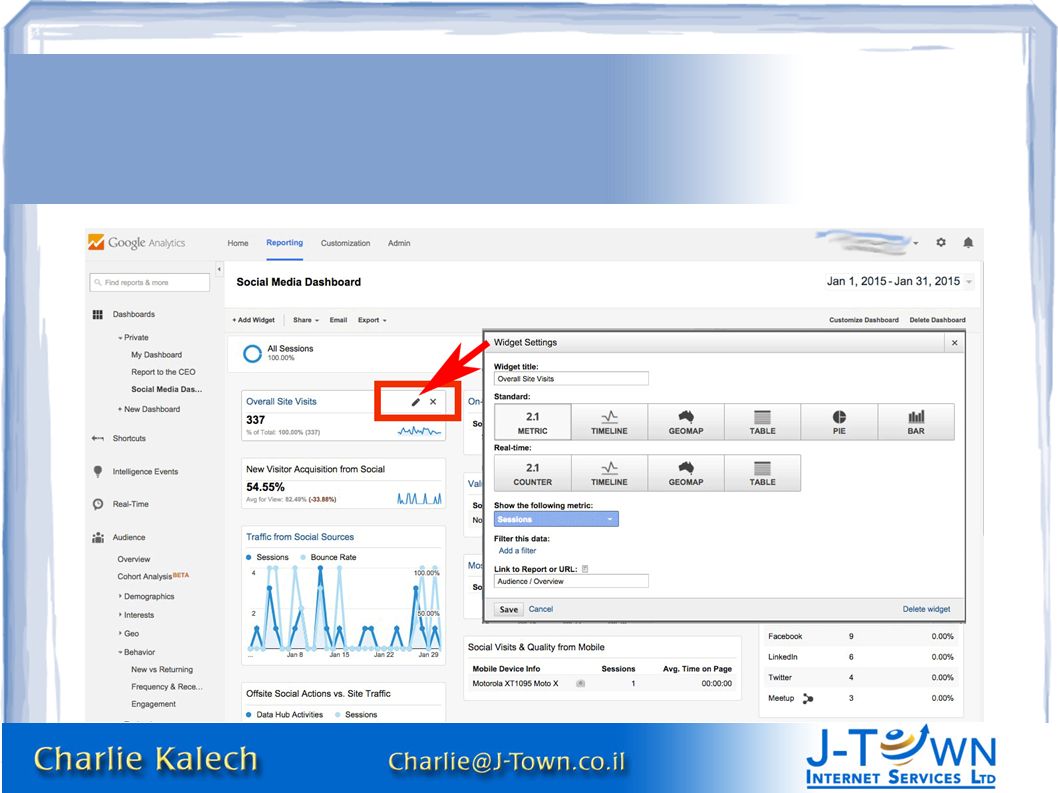
Dashboards contain up to 12 Widgets Widgets are mini-reports displaying data as maps numbers, charts or tables Widgets can be created in the dashboard and can link to standard or custom reports by clicking on the widget title

8
✔ Metric/Counter - Number of a single metric. ✔ Timeline - Graph of metric over time. ✔ You can compare this to a secondary metric. ✔ Geomap - Metric plotted on the map of the selected region. ✔ Table – Table of up to 2 metrics ✔ Pie - Pie chart of the selected metric grouped by a dimension. ✔ Bar - Bar chart of the metric grouped by up to 2 dimensions. Mouse over a segments of charts or regions on maps to see the specific metric values.

9
Real-Time Widgets can only display Active Users or Pageviews, depending on the Widget ✔ Counter - A count of the active users on your site. ✔ You can optionally group these users by a selected dimension. ✔ Timeline - Graph of pageviews on your site ✔ for the past 30 to 60 minutes. ✔ Geomap - Map showing where your active users are. ✔ Table - Plots active users against up to 3 selected dimensions.

16
www.google.com/analytics/gallery

21
Dimensions: Describe Data Example: Location Dimension – City Name, Latitude, Longitude Metrics: Measure Example: Location Metric - Population

23
https://developers.google.com/analytics/devguides/reporting/core/dimsmets

24
Dimensions: Describe Data Example: Location Dimension – City Name, Latitude, Longitude Metrics: Measure Example: Location Metric - Population

25
You can add up to 4 segments to your Dashboard to compare different types of session or groups of user. Segments are either: ● Subsets of Users ● Example: Users who added an item in their shopping cart ● but did not purchase ● Subsets of Sessions ● Example: Sessions which reached a conversion goal

26
Segments are Defined by Dimensions and Metrics Example: COUNTRY contains “Israel” SESSION DURATION > “360” TRAFFIC SOURCE contains “Google”

30
Filters transform the data for a certain view according to conditions you specify If the condition you set is true, an action is taken Once the data has been transformed, it is irreversible and can not be applied retroactively (unlike segments) Therefore, Always Save A Default View With No Filters For Example: Excluding Your Business' IP Address So Your Employees Visits Are Not Included In Analytics Reports
 Therefore, Always Save A Default View With No Filters For Example: Excluding Your Business IP Address So Your Employees Visits Are Not Included In Analytics Reports")
32
Create A New Filter AND A NEW VIEW

40
Custom Events 1) Add an HTML event to an element of your web page (e.g., clicks, loads, mouse-overs, plays, etc.) 2) Use Google's standard Google Analytics JavaScript to send event data to your account. How Many People Watched My Video? How Many People Started Watching and Then Stopped?

41
Google Analytics push: The "_gaq.push()" part of the code connects to your page and signals that data needs to be sent to your Google Analytics account. Category: Events are best organized into different categories depending on the behavior or functionality they track (e.g., video, ads, links, etc.). Action: How people interact with what you're tracking (e.g., plays, views, clicks, etc.). SOURCE: http://searchenginewatch.com/sew/how-to/2287906/10-google-analytics-custom-events-that-track-the-untrackable
. Action: How people interact with what you re tracking (e.g., plays, views, clicks, etc.). SOURCE:")
42
Label: (Optional) Associate data with custom events (e.g., names of videos, URLs of clicked links, user-provided values such as ZIP codes, etc.). Value: (Optional) Stores integers with your events (e.g., price, time codes, etc.). Interaction: (Optional) the non-interaction value can be set to "true" or "false" and dictates whether your event will contribute to your site's bounce rate. SOURCE: http://searchenginewatch.com/sew/how-to/2287906/10-google-analytics-custom-events-that-track-the-untrackable
 Stores integers with your events (e.g., price, time codes, etc.). Interaction: (Optional) the non-interaction value can be set to true or false and dictates whether your event will contribute to your site s bounce rate. SOURCE:")
43
Examples: Clicking on a link that goes to a page without GA code (eg., Offsite, PDF). gaq.push(['trackEvent', 'External Link', 'Click'. 'Download 2014 Annual Report']); Used in conjunction with onclick events SOURCE: http://searchenginewatch.com/sew/how-to/2287906/10-google-analytics-custom-events-that-track-the-untrackable
; Used in conjunction with onclick events SOURCE:")
44
Examples: Tracking plays, starts, stops, & other forms of engagement when users interact with a video. gaq.push(['trackEvent', 'Video', 'Play'. '2015 Keynote Presentation']); Can Not Be Used With All Players – Check Out http://wistia.com/doc/google-analytics SOURCE: http://searchenginewatch.com/sew/how-to/2287906/10-google-analytics-custom-events-that-track-the-untrackable
; Can Not Be Used With All Players – Check Out SOURCE:")
45
Compare with sites with similar traffic levels in your industry and location. ✔ Over 1600 industry categories ✔ Refine the data by geographic location ✔ And 7 traffic size classifications Example: “Universities” in Israel that receive 500-1000 avg. daily sessions.

46
Benchmarking data is available within the following dimensions: ✔ Channel ✔ Location ✔ Device

47
You can compare your data against benchmarks for the following metrics: ✔ Sessions ✔ % New Sessions ✔ New Sessions ✔ Page /Session ✔ Avg. Session Duration ✔ Bounce Rate

48
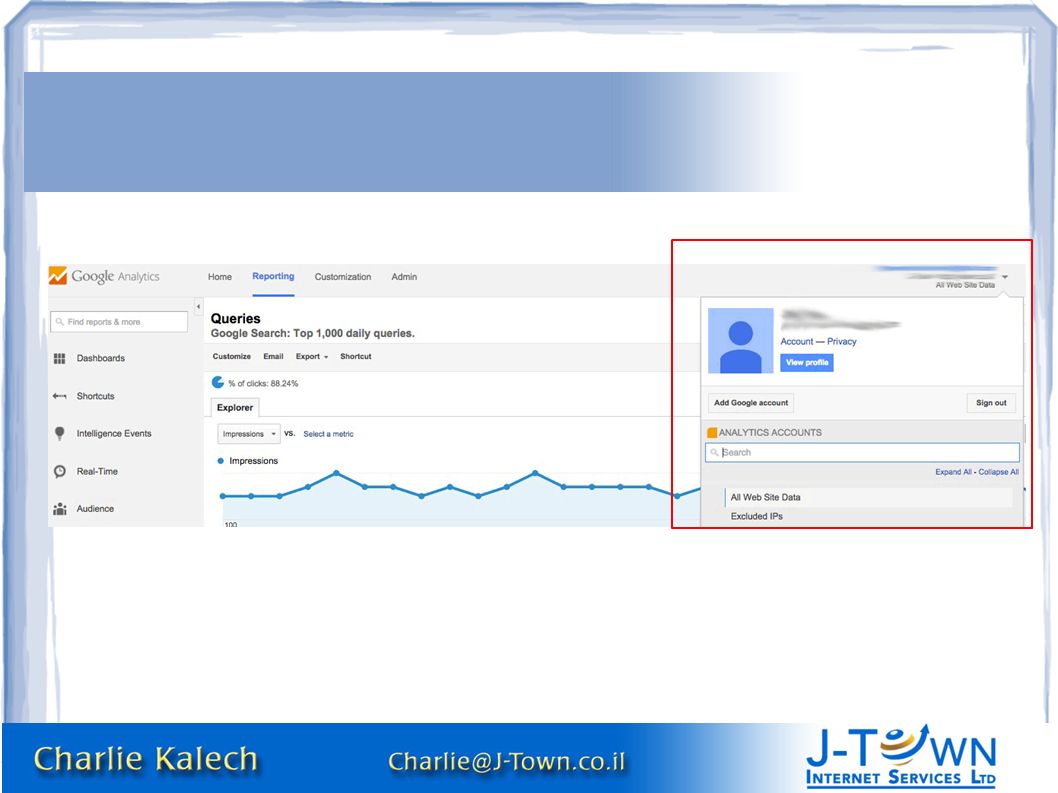
1) Sign in to your Google Analytics account. 2) Select the Admin tab. 3) Under ACCOUNT, Click Account Settings. 4) Select the Anonymously with Google and others checkbox. 5) Click Save.
 Under ACCOUNT, Click Account Settings. 4) Select the Anonymously with Google and others checkbox. 5) Click Save..")
49
1) Sign in to your Google Analytics account. 2) Select the Admin tab. 3) Under ACCOUNT, Click Account Settings. 4) Select the Anonymously with Google and others checkbox. 5) Click Save.
 Under ACCOUNT, Click Account Settings. 4) Select the Anonymously with Google and others checkbox. 5) Click Save..")
50
Use the selection menus (at the top of each report) to define the benchmark against which you want to compare your data. ✔ Industry Vertical: Select one of over 1600 industry categories. ✔ Size by Daily Visits: Select from seven traffic size classifications. This allows you to compare your property against properties with similar traffic levels in your industry. ✔ Geographic Location: Limit Benchmarking data to the a specific country or territory by selecting a geographic location. The number of properties contributing to the aggregate benchmark data is shown at the top of the report.

52
The values in the table show the percentage by which your property outperforms or underperforms the benchmark for each metric.

53
Toggle Metrics On/Off

54
Toggle Background Color On/Off

55
How Do We Use This?

59
Thank You Charlie Kalech Director, J-Town Internet Services Ltd. www.j-town.co.il charlie@j-town.co.il @CharlieKalech For More Resources Fan Us on Facebook Facebook.com/JTownInternetServices

Similar presentations