Download presentation
Presentation is loading. Please wait.

1
Medway: Here we David Whiting David.whiting@medway.gov.uk SEPHIG, 16 June, 2016

3
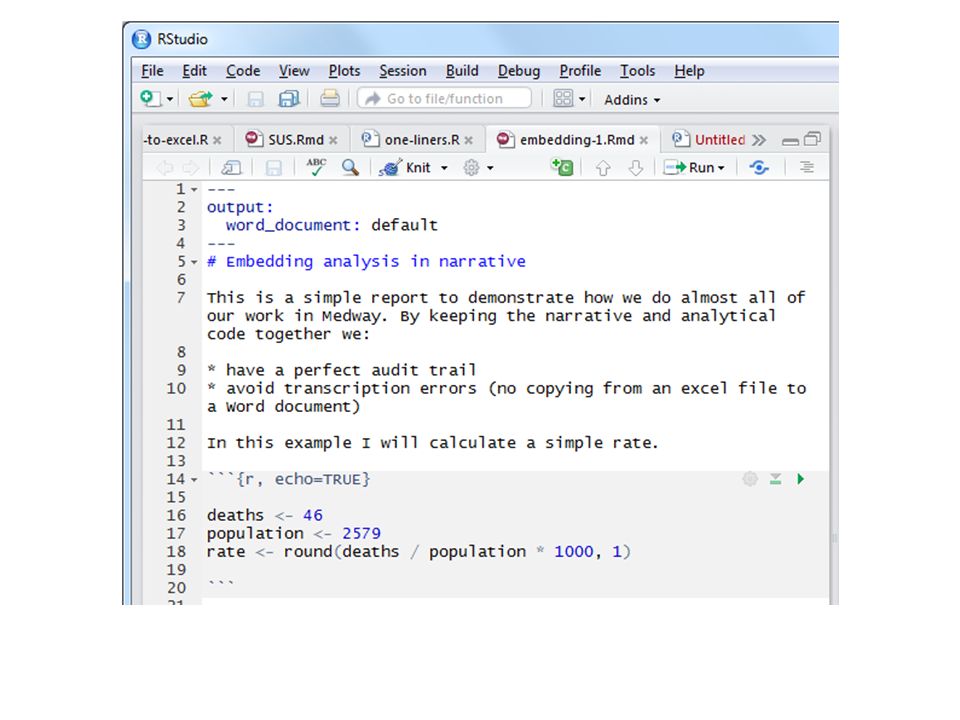
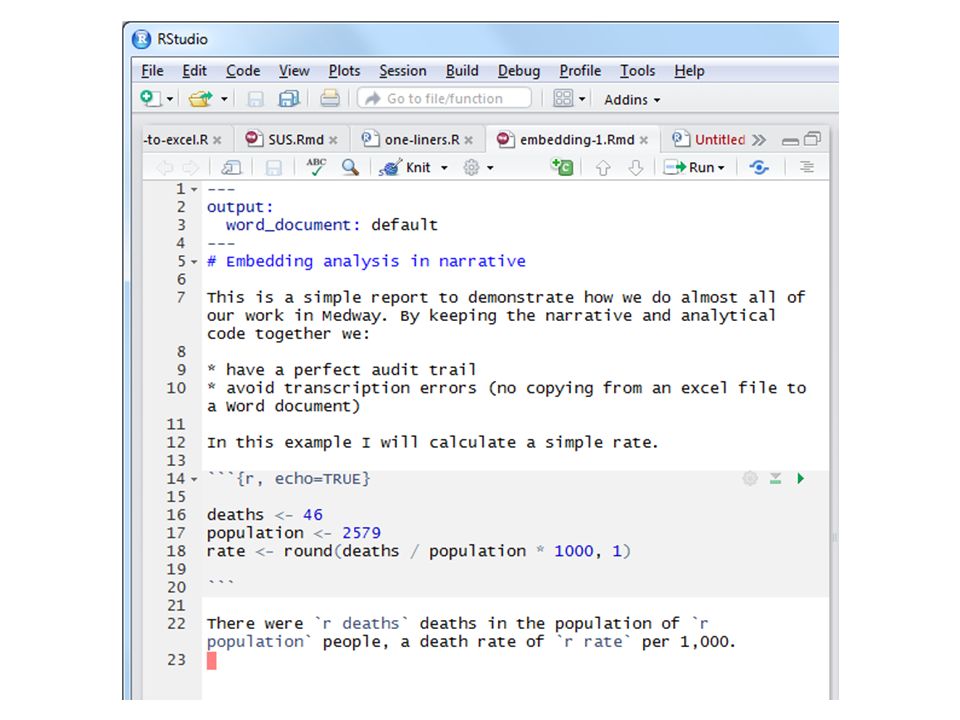
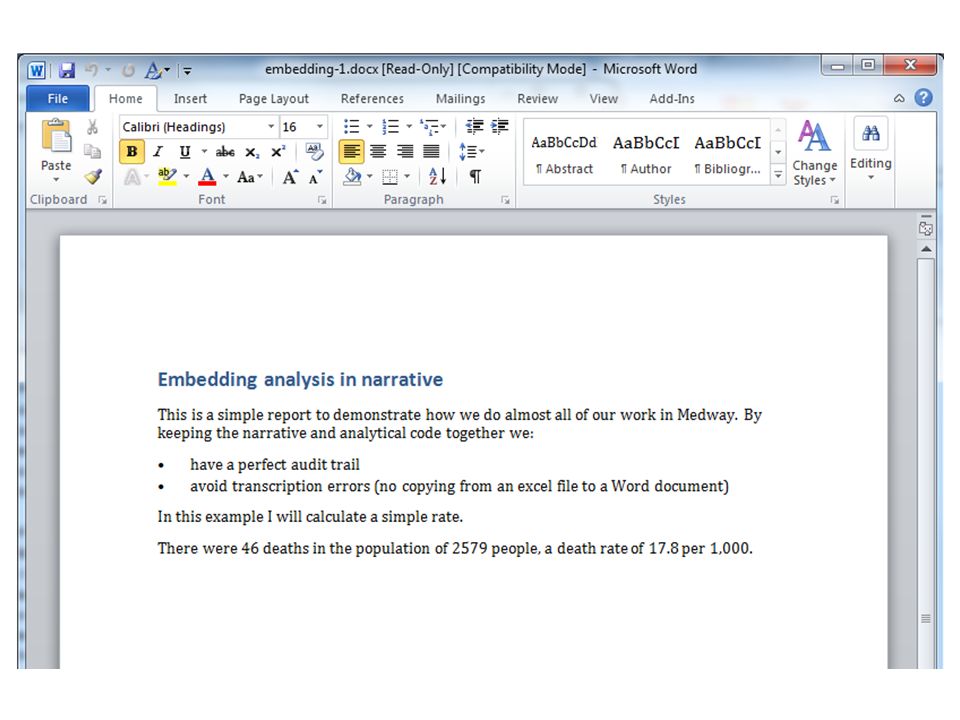
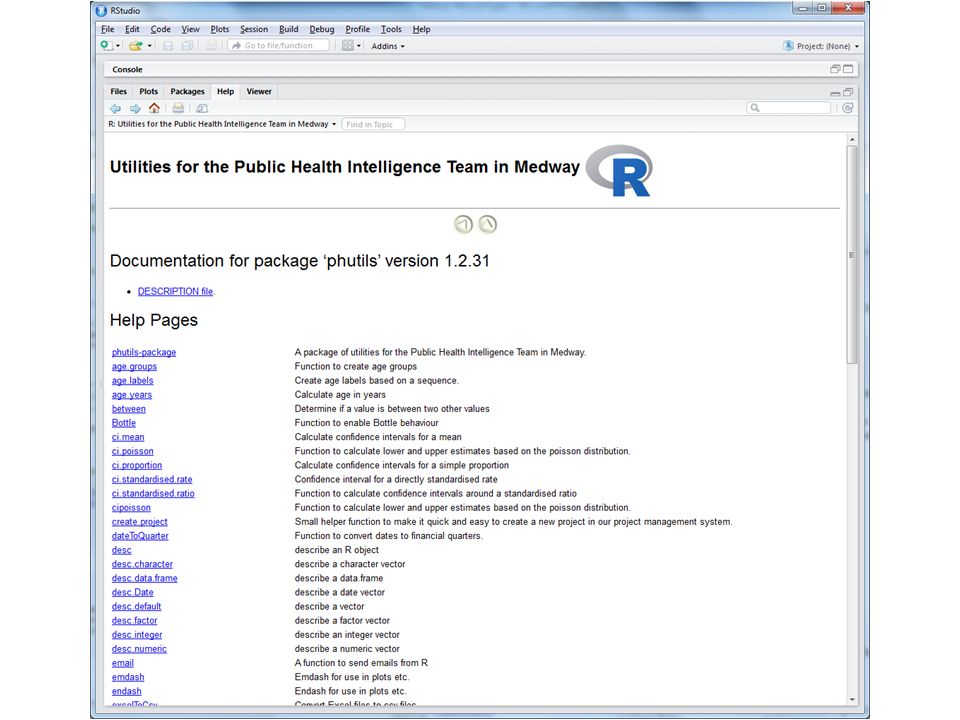
How we use R in Medway Quick calculations (one-liners) Statistical and epidemiological analysis Repeated tasks (rule of 5) Embedding R in narrative – No transcription errors – Perfect audit trail Using R to create tools – little things like pop_summary() – big things like the public health dashboard framework Other kinds of automation
 Statistical and epidemiological analysis Repeated tasks (rule of 5) Embedding R in narrative – No transcription errors – Perfect audit trail Using R to create tools – little things like pop_summary() – big things like the public health dashboard framework Other kinds of automation")
4
Some concepts

5
is a statistical programming language

8
Using code is not so different…

9
When you use Excel etc.… 1

10
1 2

11
1 2 3 …you tend to start with blank spreadsheet and manually move data around, clean it up, and calculate things. It is possible to create templates, but most situations aren’t suited to using a template. So you go back to the beginning each time.

12
When you use R… 1

13
1 2

14
1 2 3 …you build on what you created previously so there is a continuous sense of forward progress, as opposed to re-doing the same thing over and over again. You also tend to create little tools that you can combine in different ways to perform new tasks.

15
Also… Combines but provides clean separation of… – Raw data/inputs – Analytical process – Output R encourages and enables sharing Analysts spend a lot of time preparing data – Make it easy – Make it efficient – Make it fun! – Allow more time for thinking and interpreting

16
One-liners R terminal always open, so is quick to access

17
Medway population aged 10 to 15

18
Number aged 10 to 15 who are carers

19
Confidence interval for a percentage

21
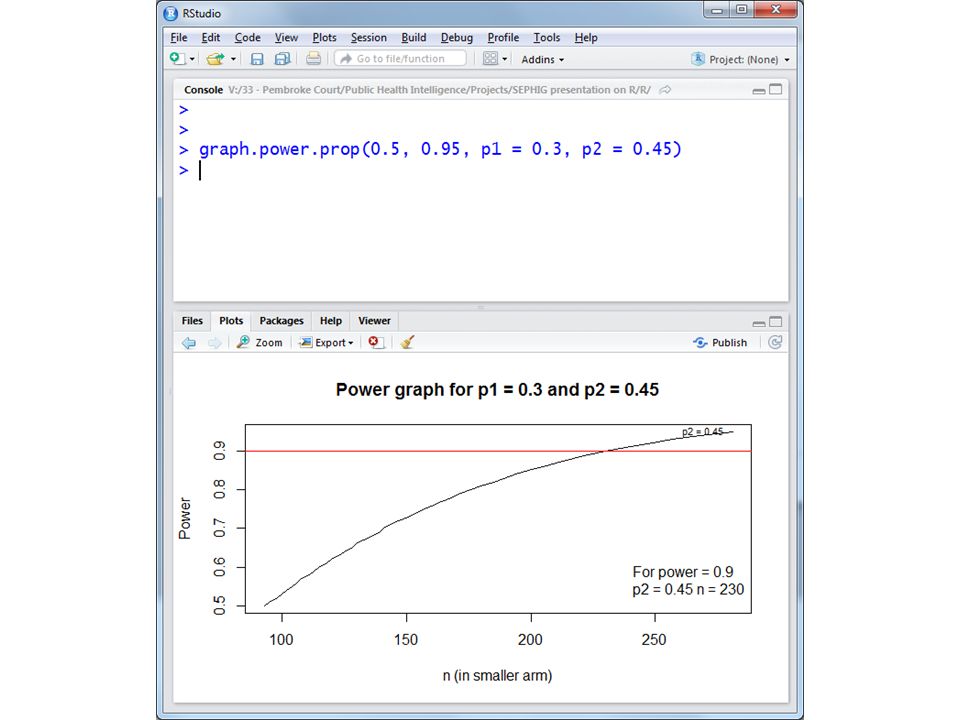
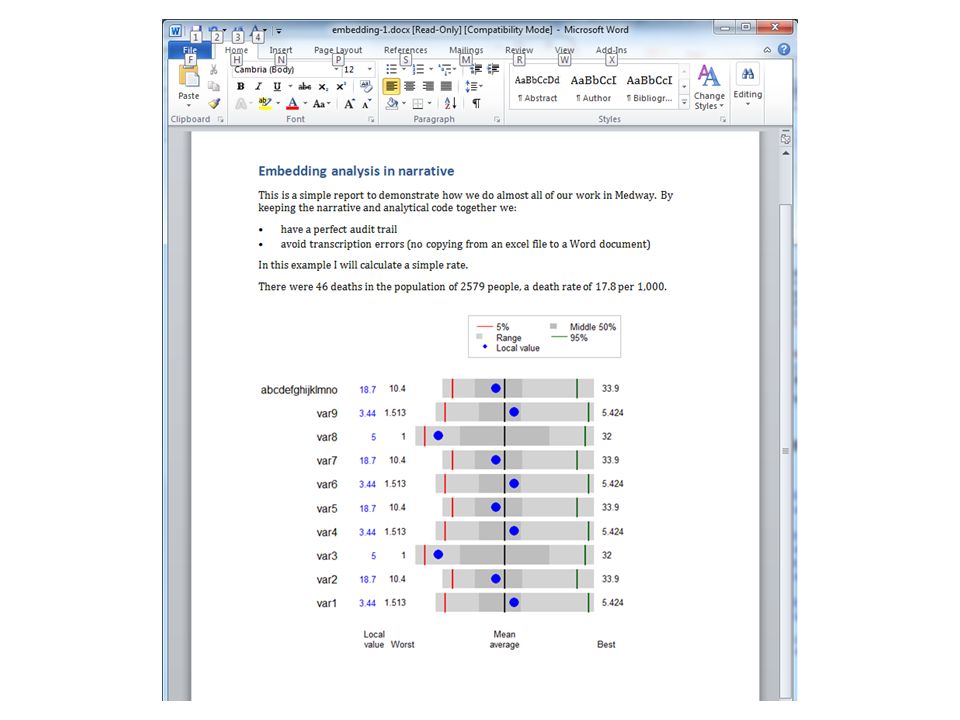
Statistical and epidemiological analysis Very powerful range of statistical tools built-in or available as packages E.g. glm() Great graphical tools
 Great graphical tools.")
22
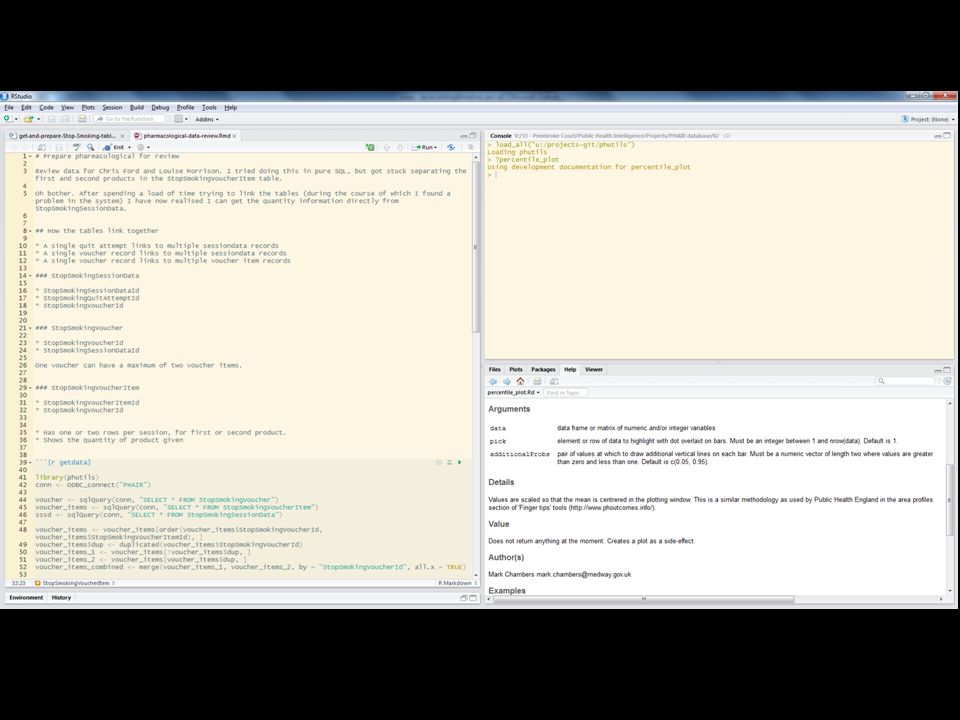
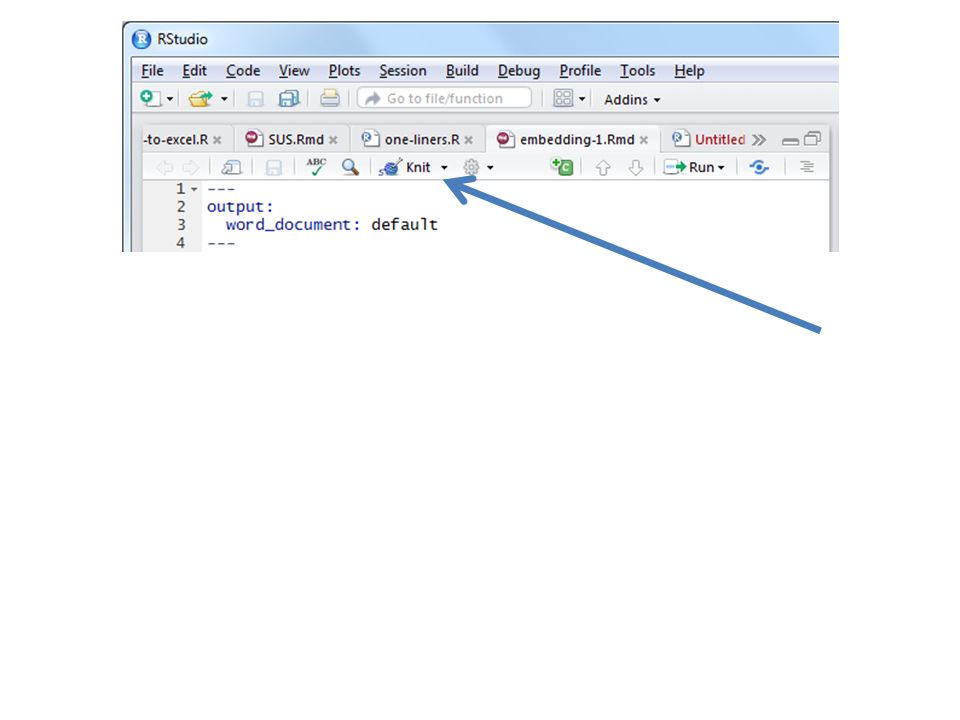
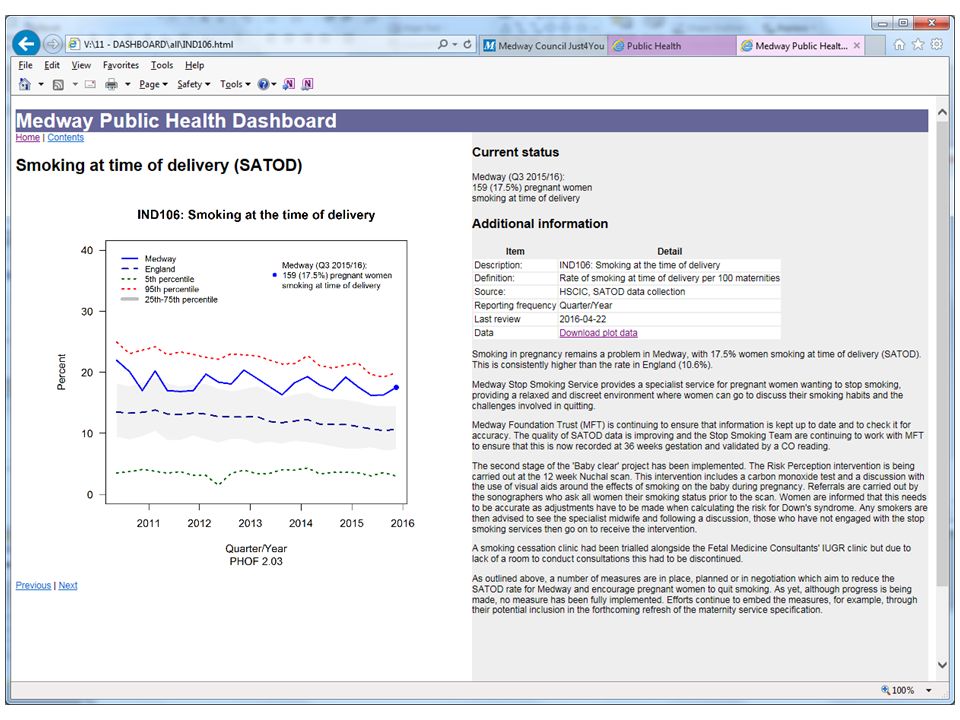
Embedding in narrative Avoid transcription errors A perfect audit trail Facilitates shared-working Our default practice, for short or long reports

32
Repeated tasks

33
Quarterly Health Checks report for GP practices 51 practices 7 page report Narrative changes based on data 20 seconds to produce Emailed using R

34
Creating tools Potato peeler Microwave oven

37
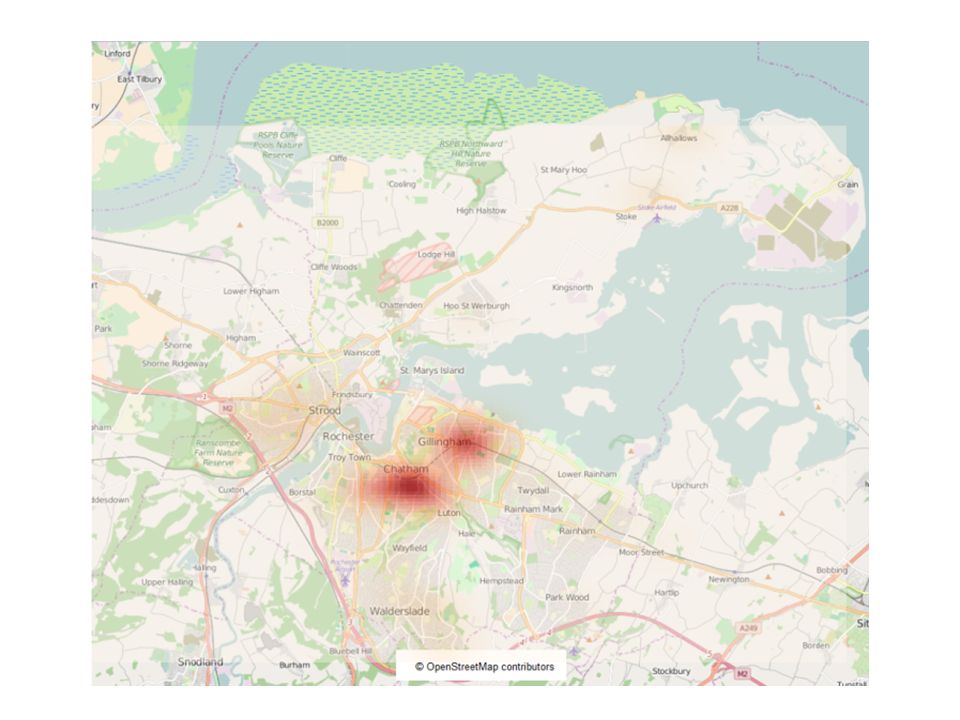
Load some packages Read in shape files for mapping Read in and cleans up the data we want to display (SATOB who declined support to quit) Get LSOA and x-y co- ordinates for each postcode Second chunk: Creates a base map Creates a heatmap, also adding individial data points Think about the steps you would take to do this manually.
 Get LSOA and x-y co- ordinates for each postcode Second chunk: Creates a base map Creates a heatmap, also adding individial data points Think about the steps you would take to do this manually.")
43
If you want to know fundamentally what R is, see the about page on the main R website: https://www.r-project.org/about.html R is used by multinational companies such as Google and facebook and widely throughout academia. Much less so in the public sector which is a shame but the skills are very transferable to other applications and therefore desirable to future employers. For example, Learning R naturally teaches you command line basics and there are ways of using R which integrate very neatly with HTML and SQL. You would also gain a grasp of how to use regular expressions in text pattern searching and matching – much more powerful than anything else I’ve come across in Excel or Access. A good starting point is to visit the Rstudio online learning page. We use Rstudio as a user-friendly front-end to R. Both bits of software are completely free to download and use by the way. Rstudio online learning page https://www.rstudio.com/resources/training/online-learning/ First I’d recommend doing the online tutorials to get a flavour of the system. They are fairly basic and assume no prior knowledge. You can run them in a browser without having to download anything. If writing code isn’t your thing, that’s fine, R is probably not for you. Everyone has their own preferred way of doing things. If on the other hand, you make it through the tutorial relatively unscathed (and still interested) we could give you some further advice about starting to use R in your day-to-day work. Online interactive tutorials Try R https://www.codeschool.com/courses/try-r - by creating an account, you can start course and resume at a later date. http://tryr.codeschool.com/levels/1/challenges/1 - dive straight in without registering. Data Camp https://www.datacamp.com/courses/free-introduction-to-r - similar exercises to Try R but more realistic working environment. MOOCs (I’ve not done any of these) https://www.coursera.org/learn/r-programming https://www.udacity.com/courses/ud651 https://lagunita.stanford.edu/courses/HumanitiesScience/StatLearning/W inter2014/about http://www.statistics.com/landing-page/r-courses/ Reference guides (just a selection) http://r-tutorials.com/ https://www.udemy.com/r-basics/ http://www.statmethods.net/index.html (Quick-R) https://cran.r-project.org/doc/manuals/R-intro.html https://cran.r-project.org/doc/manuals/R-intro.pdf http://www.r-tutor.com/r-introduction http://stackoverflow.com/questions/tagged/r http://research.stowers-institute.org/efg/R/Color/Chart/ (colour guide) http://www.r-bloggers.com/ Resources From Mark Chambers:
 we could give you some further advice about starting to use R in your day-to-day work. Online interactive tutorials Try R - by creating an account, you can start course and resume at a later date. - dive straight in without registering. Data Camp - similar exercises to Try R but more realistic working environment. MOOCs (I’ve not done any of these) inter2014/about Reference guides (just a selection) (Quick-R) (colour guide) Resources From Mark Chambers:.")
Similar presentations


 R. Olsen USEPA ORD NHEERL Western Ecology Division Corvallis, OR 97333 (541) 754-4790>")

 is a server-side programming technology that enables the creation of dynamic,>")


 It allows free tools to help design your website and.>")


