Download presentation
Presentation is loading. Please wait.

1
Journalism 614: Non-Response and Cell Phone Adoption Issues

2
Nonresponse Declining contact and cooperation rates –Especially for “gold standard” RDD National Telephone Surveys Early research suggests the issues are rather small, with little bias on results –Examined by comparing “easy to contact” individuals to “hard to contact” –More systematic version is to compare between standard 5-day and “rigorous” survey

3
Accelerating Problem Survey firms reporting increasingly high rates of non-contact and non-cooperation –Americans leading increasingly busy lives –More and more unsolicited calls to home –Sophisticated technologies to avoid calls Big drop offs in last 15-20 years –Call screening (I only take known callers) –Cell phones (I pay for minutes during survey)
 –Cell phones (I pay for minutes during survey)")
4
Hard to Gauge the Effect Initial work conducted in late 90s Curtain et al - Low effort “restricted call” design versus high effort “all call” design –See no difference in population estimates Keeter et al – Two parallel surveys, one using standard 5 day vs. “rigorous” –On average, a two percentage point difference Seem to suggest that lower response rate does not effect survey quality

5
Non-response in this Century Lot has changed in last decade + –More legislative restrictions –More mobile technologies –More VOIP technologies Re-ran the study and found similar results comparing 5-day and rigorous –5-day – 10 call backs, one refusal conversion –Rigorous – 21 weeks, advance letters, left messages, additional call backs, etc. –Little difference in findings

6
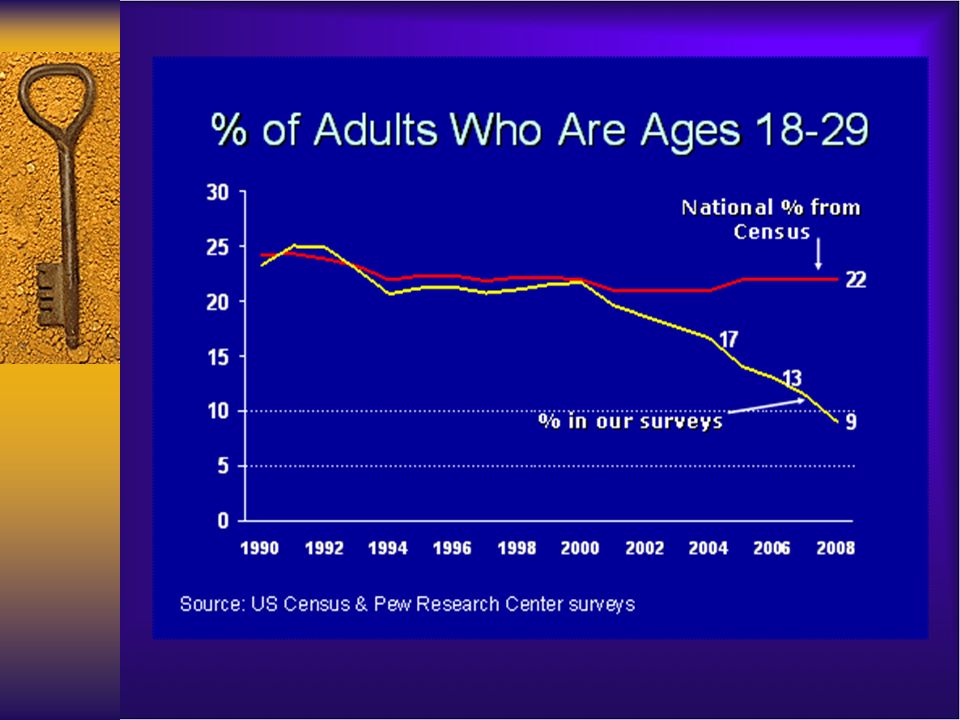
The Problem of Cell Phones In 2006, 13% of cell phone only HHs –Increasing 1% every six months 2003-2006 –Increasing 2% every six months after 2006 By 2015, 46% of U.S. Adults Live In Cellphone-Only HHsBy 2015, 46% of U.S. Adults Live In Cellphone-Only HHs 64% of Millennials (born 1977-1994) are Cellphone-Only64% of Millennials (born 1977-1994) are Cellphone-Only Bias in terms of who is missed is most prominent among young people. –“Serious coverage problem” –“Particular challenge”
 are Cellphone-Only64% of Millennials (born ) are Cellphone-Only Bias in terms of who is missed is most prominent among young people. – Serious coverage problem – Particular challenge .")
7
Big differences in wireless only HHs by Age and SES Only 16% of those 65+ Nearly 70% among 25-29 Just over 40% among “not poor” Over 50% for “near poor” Nearly 60% for the “poor” This creates systematic biases

9
Some substantial differences Big differences between cell and non-cell respondents to a range of questions Especially for issues that affect younger people, and behaviors such as voting –Register to vote? –Political knowledge? –Media usage?

10
Strive for Higher Response Rate

11
To Achieve a High Response Rate Incentives: gifts or drawings for completion –prize drawing vs smaller incentives to alll –donating to a charity as an inducement –Run experiments to see which incentive works Online: pre-invitation and landing page –Test different versions to see what encourages respondents to click on survey link (online) Reminders and follow-ups to boost response –In general, you only want to send one or two email reminders. Make online survey friendly for all devices/browsers. –Make it usable on mobile or tablet. See if there is a high bounce rate from particular devices

Similar presentations


 of American adults use at least three different types of media every week to get news.>")


 Lugano 25-26 August 2005 Increasing response rates Ineke Stoop SCP.>")


